

Investing
Realty Income Monthly Dividend: $10,000 Income Math for 2027

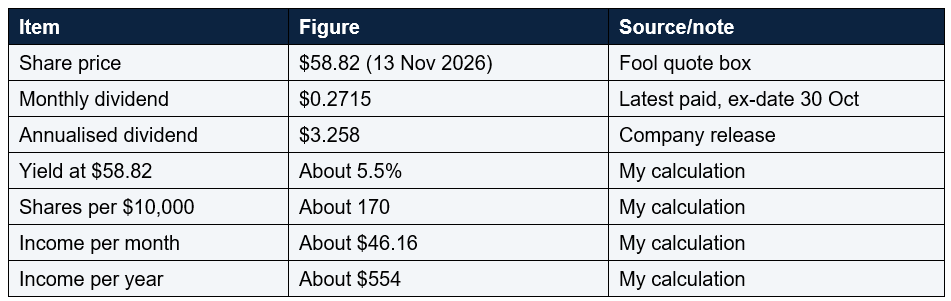
A 5.4% yield that is not paid quarterly can change how you plan around dividend income. Price $58.82 (13 Nov 2026); monthly dividend $0.2715; annualised $3.258; about 170 shares per $10,000; about $46 a month; AFFO payout ratio 72.6%.
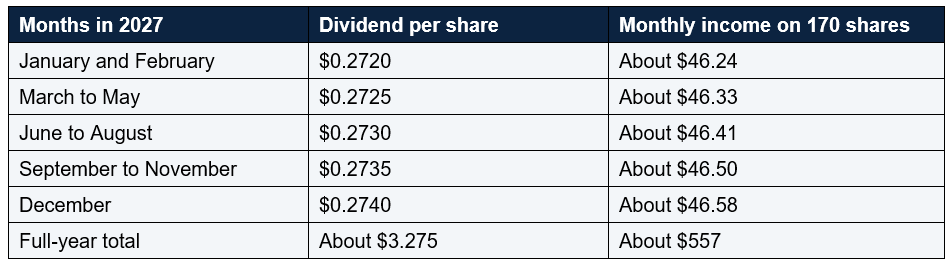
If the company keeps nudging the payout up by about half a cent per share each quarter, as it has recently, 2027 would pay roughly $557 on the same 170 shares, with each month's cheque a little larger than the last (my calculation). That is a modest rise, not a windfall.
The real appeal is the rhythm. Most dividend stocks pay four times a year, so a monthly payer lines up better with rent and bills. But the income is only half the picture, because the share price can move by far more than a year of dividends. This post covers both.
Key takeaway: Roughly $46 a month per $10,000 at today's price and payout. The dividend is steady and slow-growing, but nothing about it is guaranteed.
Compare a quarterly payer yielding the same amount. On $10,000 at today's rate, a quarterly payment would arrive as about $138 every three months, against about $46 each month (my calculation). The yearly total is the same. The difference is cash-flow timing, which is useful if you are drawing on the income, and mostly irrelevant if you are reinvesting it.
One thing to keep in mind: a monthly schedule does not make a dividend safer or bigger. It only changes when you receive it.
The annualised dividend was $3.258 per share at 30 September 2026, which is the $0.2715 monthly rate times twelve. On $58.82 that is a 5.54% yield (my calculation).
I should flag a conflict. The Fool article says the next dividend in December is $0.2740 and projects $46.03 a month for January. That does not fit the half-cent pattern, which would put December 2026 near $0.272. The $0.274 figure matches where the pattern would reach by December 2027 instead. The article also describes the dividend as quarterly in one sentence and monthly in another. I have not seen a dividend declaration to settle it, so I model the half-cent path below and treat the article's number as unconfirmed.
Using the half-cent path on 170 shares (my calculation):

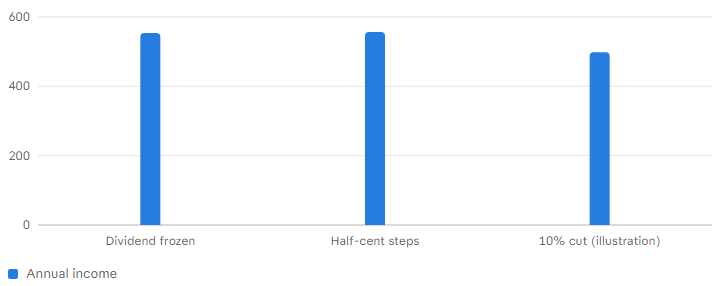
The frozen and rising cases differ by only about $3 a year, which tells you how small the growth is. The cut scenario is not a forecast. I include it because a dividend is a decision by a board, and a 10% cut would cost about $56 a year on this position.
If you wanted $1,000 a month from this stock at today's yield, you would need roughly $217,000 invested (my calculation). For $500 a month, about $108,000.
Full-year 2026 AFFO guidance was raised to $4.45 to $4.46 per share. Against the $3.258 annualised dividend, that is a payout of about 73% (my calculation), which leaves roughly a quarter of AFFO to reinvest.
Beware of the payout ratio you see on some data sites. One page shows 238%, which is probably calculated against net income rather than AFFO . Net income per share guidance for 2026 is only $1.55 to $1.56, which is below the dividend. That is normal for REITs because of depreciation, and it is why AFFO is used, but it also means you should read the numbers carefully before concluding anything. Another thing to flag: that same page lists "22" years of dividend growth, while the Fool article says 32 consecutive years of annual increases. The longer figure is the one I would trust more, but they define it differently, so I do not know which is right.
Growth comes mostly from buying more properties. The company targets $10 billion of investment in 2026, and bought $2.6 billion in the third quarter at an initial yield of 6.8%. On the earnings call, management estimated a blended cost of capital near 5%, a spread of about 170 basis points, and said only 4.4% of the opportunities it sourced were selected.
Leverage looks moderate. Net debt to annualised EBITDA was 5.4 times, with $5.4 billion of liquidity. One thing worth noting from the 24/7 Wall St. article: non-investment-grade tenants made up 65.7% of base rent, and the watch list was in the high 5% range. That is a risk to watch, not a warning sign by itself.
Management also said higher long-term rates shift the economics toward Europe, credit and private capital, and weaken the case for US property purchases when rate volatility rises. In other words, the same environment that makes a 5.5% yield look attractive makes it harder for the company to grow.
There was no formal 2027 AFFO guidance on the call, so I cannot tell you what to expect for 2027 earnings. The CFO did say credit losses of 20 to 30 basis points are expected, in line with history.
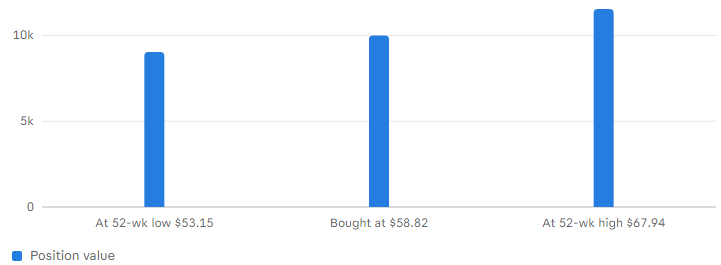
The 52-week range is $53.15 to $67.94. Applied to 170 shares (my calculation), that means the position could be worth $9,036 at the low and $11,550 at the high. A swing of around $2,500 in value is several times larger than the roughly $554 in annual income.
The shares have also had deep drops before, including about 51.5% in early 2020 and about 36% from July 2022 to October 2023. A monthly dividend smooths the cash you receive. It does nothing to smooth the value of what you own. Be careful: A 5.5% yield does not help if the share price falls by more than that in a year. Judge the stock on total return, not on the monthly cheque.
To cover a $2,000 monthly bill from this one stock you would need about $433,000 invested (my calculation), and all of it in a single company. That is a big concentration. Most people in that position would spread across several holdings, and the yield from the whole portfolio would be what matters.
The 3% annual growth in the dividend over the last ten years (from $0.202 in September 2016 to $0.2715 in September 2026, my calculation) is roughly in line with inflation in many years, and lower in others. So a retiree might find the income does not grow fast enough to keep its purchasing power.
The bear case: slow growth, because rent increases are about 1% and growth depends on buying property at a profit; higher interest rates making acquisitions and refinancing harder; a large share of tenants without investment-grade ratings; and a share price that has lagged the market for years.
Both cases draw on the same data. If you want income and can live with price swings, the bull case may appeal. If you want growth or a smooth ride, the bear case may matter more.
What the monthly schedule cannot do is protect you from the price. Over the last year, price losses outweighed the dividend, and rising interest rates remain the key risk. Whether the income is worth that risk depends on your goals, your tax position and how much of your portfolio you are putting in one company. This post is education only, not advice.
The most recent monthly dividend was $0.2715 per share, or $3.258 annualised .
How much would $10,000 pay monthly in 2027?
At $58.82 you could buy about 170 shares, which pay roughly $46 a month, or about $554 to $557 over the year if the payout is held or rises by half a cent per quarter (my calculation).
Is the dividend safe?
Nothing is guaranteed. The payout ratio was 72.6% of AFFO in the third quarter and management called it among the lowest ever, but rising rates and tenant credit are risks.
Why do sources show different yields?
They use different share prices and dates. I saw 5.4%, 5.52%, 5.54% (my calculation) and 5.70%, all from the same dividend with different prices.
Is a monthly dividend better than a quarterly one?
Not necessarily. The total is the same, but monthly timing can suit people who draw on the income to pay bills.
Table of Contents
- The quick answer
- Why a monthly payer feels different
- What $10,000 buys today
- Month-by-month: what 2027 could look like
- Three scenarios for 2027
- How safe is the payout?
- The business behind the dividend
- Interest rates: the main headwind
- Price risk can outweigh the income
- Could you live off this?
- Taxes and where you hold it
- Bull case versus bear case
- What to watch next
- Conclusion
- FAQ
2027 income on $10,000 (170 shares): three scenarios ($)
US$ per year by My calculation at $58.82/share; not a forecast
Value of 170 shares across the 52-week range ($)
US$ by My calculation; range from Fool quote box
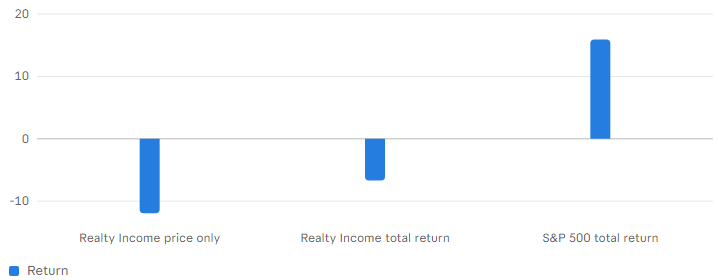
Realty Income vs S&P 500: 1-year return to Oct 2026 (%)
% return by Source: 24/7 Wall St. (to 1 Oct 2026)The quick answer
If you put $10,000 into Realty Income at the November 2026 price of $58.82, you could buy about 170 shares. At the current monthly dividend of $0.2715 a share, that works out to roughly $46 a month, or about $554 over a year (my calculation).If the company keeps nudging the payout up by about half a cent per share each quarter, as it has recently, 2027 would pay roughly $557 on the same 170 shares, with each month's cheque a little larger than the last (my calculation). That is a modest rise, not a windfall.
The real appeal is the rhythm. Most dividend stocks pay four times a year, so a monthly payer lines up better with rent and bills. But the income is only half the picture, because the share price can move by far more than a year of dividends. This post covers both.
Key takeaway: Roughly $46 a month per $10,000 at today's price and payout. The dividend is steady and slow-growing, but nothing about it is guaranteed.
Why a monthly payer feels different
Realty Income calls itself "The Monthly Dividend Company", and the schedule is the point. Each month it pays a small amount, and each quarter or so it raises it by a tiny step. For someone who wants income to arrive like a pay cheque, that matters more than the yield alone.Compare a quarterly payer yielding the same amount. On $10,000 at today's rate, a quarterly payment would arrive as about $138 every three months, against about $46 each month (my calculation). The yearly total is the same. The difference is cash-flow timing, which is useful if you are drawing on the income, and mostly irrelevant if you are reinvesting it.
One thing to keep in mind: a monthly schedule does not make a dividend safer or bigger. It only changes when you receive it.
What $10,000 buys today
The article behind this post's headline says $10,000 buys about 168 shares and that the dividend yield is 5.4% [1]. At the closing price of $58.82 on 13 November 2026, I get about 170 whole shares (my calculation), and the data box on the same page shows a yield of 5.52%. The gap comes from using slightly different prices or rounding. A page dated 26 October put the yield at 5.70% when the share price was lower.The annualised dividend was $3.258 per share at 30 September 2026, which is the $0.2715 monthly rate times twelve. On $58.82 that is a 5.54% yield (my calculation).
Month-by-month: what 2027 could look like
The dividend has risen in tiny steps. Looking at the recent payment history, it went from $0.270 in January 2026 to $0.2705 in March, $0.271 in June and $0.2715 in September. Each step is about half a cent. If that pattern simply continued, the sequence from December 2026 would be $0.272, $0.2725, $0.273, $0.2735 and $0.274.I should flag a conflict. The Fool article says the next dividend in December is $0.2740 and projects $46.03 a month for January. That does not fit the half-cent pattern, which would put December 2026 near $0.272. The $0.274 figure matches where the pattern would reach by December 2027 instead. The article also describes the dividend as quarterly in one sentence and monthly in another. I have not seen a dividend declaration to settle it, so I model the half-cent path below and treat the article's number as unconfirmed.
Using the half-cent path on 170 shares (my calculation):
Three scenarios for 2027
Nobody knows what 2027 will actually pay, so here are three simple scenarios for the same 170 shares, using today's price to set the share count (my calculation).The frozen and rising cases differ by only about $3 a year, which tells you how small the growth is. The cut scenario is not a forecast. I include it because a dividend is a decision by a board, and a 10% cut would cost about $56 a year on this position.
If you wanted $1,000 a month from this stock at today's yield, you would need roughly $217,000 invested (my calculation). For $500 a month, about $108,000.
How safe is the payout?
The usual way to judge a REIT dividend is against adjusted funds from operations, or AFFO, because depreciation makes ordinary earnings misleading for property companies. In the third quarter, Realty Income earned $1.12 of AFFO per share and paid out 72.6% of it. Management said the payout ratio is among the lowest in the company's history [5].Full-year 2026 AFFO guidance was raised to $4.45 to $4.46 per share. Against the $3.258 annualised dividend, that is a payout of about 73% (my calculation), which leaves roughly a quarter of AFFO to reinvest.
Beware of the payout ratio you see on some data sites. One page shows 238%, which is probably calculated against net income rather than AFFO . Net income per share guidance for 2026 is only $1.55 to $1.56, which is below the dividend. That is normal for REITs because of depreciation, and it is why AFFO is used, but it also means you should read the numbers carefully before concluding anything. Another thing to flag: that same page lists "22" years of dividend growth, while the Fool article says 32 consecutive years of annual increases. The longer figure is the one I would trust more, but they define it differently, so I do not know which is right.
The business behind the dividend
Behind the dividend is a very large and diversified portfolio: 15,536 properties leased to 1,842 clients across 96 industries, with occupancy of 98.8% and about 8.5 years left on leases on average [2]. Same-store rent growth is only about 1.1% this year, which tells you why the dividend grows slowly.Growth comes mostly from buying more properties. The company targets $10 billion of investment in 2026, and bought $2.6 billion in the third quarter at an initial yield of 6.8%. On the earnings call, management estimated a blended cost of capital near 5%, a spread of about 170 basis points, and said only 4.4% of the opportunities it sourced were selected.
Leverage looks moderate. Net debt to annualised EBITDA was 5.4 times, with $5.4 billion of liquidity. One thing worth noting from the 24/7 Wall St. article: non-investment-grade tenants made up 65.7% of base rent, and the watch list was in the high 5% range. That is a risk to watch, not a warning sign by itself.
Interest rates: the main headwind
The main headwind is interest rates. The 24/7 Wall St. article says the 10-year Treasury yield rose from 1.52% at the end of 2021 to 5.29% at 30 September 2026. The CFO warned on the call that matching 2026's debt costs will be difficult, and that about $2.9 billion of debt maturing in 2027 carries a sub-3% rate. Refinancing that at higher rates would eat into growth.Management also said higher long-term rates shift the economics toward Europe, credit and private capital, and weaken the case for US property purchases when rate volatility rises. In other words, the same environment that makes a 5.5% yield look attractive makes it harder for the company to grow.
There was no formal 2027 AFFO guidance on the call, so I cannot tell you what to expect for 2027 earnings. The CFO did say credit losses of 20 to 30 basis points are expected, in line with history.
Price risk can outweigh the income
Here is the part that income-focused articles tend to skip. Over the year to early October 2026, the 24/7 Wall St. analysis shows a total return (with dividends reinvested) of -6.69% and a price-only return of -11.94%, while the S&P 500 returned +15.92%. Over ten years, the price return was about -20%, and dividends turned that into a total gain of about 33%, or about 2.9% a year.The 52-week range is $53.15 to $67.94. Applied to 170 shares (my calculation), that means the position could be worth $9,036 at the low and $11,550 at the high. A swing of around $2,500 in value is several times larger than the roughly $554 in annual income.
The shares have also had deep drops before, including about 51.5% in early 2020 and about 36% from July 2022 to October 2023. A monthly dividend smooths the cash you receive. It does nothing to smooth the value of what you own. Be careful: A 5.5% yield does not help if the share price falls by more than that in a year. Judge the stock on total return, not on the monthly cheque.
Could you live off this?
Many people are drawn to monthly payers because they want to live off the income. This is where the arithmetic bites. At about 5.5%, the monthly income you can expect from a portfolio is a bit over $46 per $10,000.To cover a $2,000 monthly bill from this one stock you would need about $433,000 invested (my calculation), and all of it in a single company. That is a big concentration. Most people in that position would spread across several holdings, and the yield from the whole portfolio would be what matters.
The 3% annual growth in the dividend over the last ten years (from $0.202 in September 2016 to $0.2715 in September 2026, my calculation) is roughly in line with inflation in many years, and lower in others. So a retiree might find the income does not grow fast enough to keep its purchasing power.
Taxes and where you hold it
The Fool article notes that REIT dividends are taxed as ordinary income, and that holding the stock in a Roth account can avoid that tax. I would add that tax treatment varies by country and by account type, and that I cannot give personal tax advice. If you are in the UK, for example, the rules on foreign dividends and withholding tax differ, so check with a qualified adviser or the tax authority before you buy.Bull case versus bear case
The bull case: occupancy near 99%, a payout ratio of about 73% of AFFO, rising AFFO guidance, an "A" credit rating from Fitch, a 32-year record of annual increases, and a monthly schedule that suits income planning.The bear case: slow growth, because rent increases are about 1% and growth depends on buying property at a profit; higher interest rates making acquisitions and refinancing harder; a large share of tenants without investment-grade ratings; and a share price that has lagged the market for years.
Both cases draw on the same data. If you want income and can live with price swings, the bull case may appeal. If you want growth or a smooth ride, the bear case may matter more.
What to watch next
If you own or are considering Realty Income, these are the points I would track: The dividend declarations: whether the half-cent steps continue each quarter, and whether December's figure matches the $0.2740 in the article or the $0.272 the pattern suggests. AFFO and the payout ratio: guidance for 2027, which management has not yet given. Interest rates: the 10-year Treasury yield and the spread between acquisition yields and the cost of capital. Credit quality: the watch list and credit losses. Share price: whether it holds above the 52-week low of $53.15.Conclusion
A $10,000 investment in Realty Income at today's price would buy about 170 shares and pay roughly $46 a month, or about $554 to $557 over 2027, if the dividend is maintained and keeps growing by a half cent a quarter. That is dependable-looking income with slow growth.What the monthly schedule cannot do is protect you from the price. Over the last year, price losses outweighed the dividend, and rising interest rates remain the key risk. Whether the income is worth that risk depends on your goals, your tax position and how much of your portfolio you are putting in one company. This post is education only, not advice.
FAQ
How much does Realty Income pay per month?The most recent monthly dividend was $0.2715 per share, or $3.258 annualised .
How much would $10,000 pay monthly in 2027?
At $58.82 you could buy about 170 shares, which pay roughly $46 a month, or about $554 to $557 over the year if the payout is held or rises by half a cent per quarter (my calculation).
Is the dividend safe?
Nothing is guaranteed. The payout ratio was 72.6% of AFFO in the third quarter and management called it among the lowest ever, but rising rates and tenant credit are risks.
Why do sources show different yields?
They use different share prices and dates. I saw 5.4%, 5.52%, 5.54% (my calculation) and 5.70%, all from the same dividend with different prices.
Is a monthly dividend better than a quarterly one?
Not necessarily. The total is the same, but monthly timing can suit people who draw on the income to pay bills.
0 Comments
Be the first to share your thoughts on this article.