
Investing
Netflix Stock Down 50%: What Happened After Its Last 5 Drops

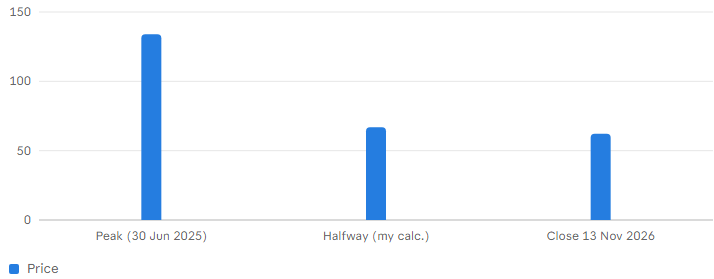
It has happened just five times before. Did buying at the halfway mark pay off? About 53% below $133.91 peak; $62.15 close on 13 Nov 2026; 1-year return after past drops positive in 2 of 5; 3-year return positive in 4 of 5; forward P/E about 17x.
US$ by Source: Motley Fool analysis; split-adjusted
The short version, using the figures in one published analysis: buying when Netflix first fell 50% below its record produced a gain after one year in only two of five cases, but a gain after three years in four of five. That is a very different story from "buy the dip and watch it pop".
This post walks through those five episodes, what is different about today's drop, and why the halfway mark has rarely been the bottom. It is education, not a recommendation.
Key takeaway: History favours patience over a quick bet. The one-year record after past halving was weak, the three-year record was strong, and the stock often kept falling first.
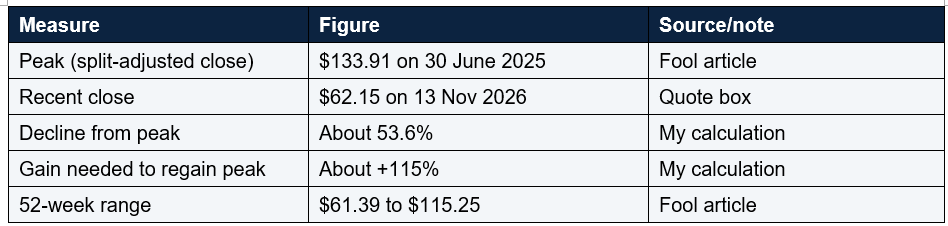
Sources do not agree on the starting line. A 24/7 Wall St. article measures from the post-split close of $110.29 on 17 November 2025 and gets a smaller drop, and the 52-week high quoted is $115.25 (about 46% above today's price, my calculation). Another site quotes a 52-week high of $116.73. The difference is simply which date you start counting from. The June 2025 peak is the one that supports the headline, and the later starting points make the fall look smaller.
The stock first closed more than 50% below its peak on 21 October 2026, the day after third-quarter results. Halfway from $133.91 is $66.96 (my calculation), so the shares are now a little below that mark.
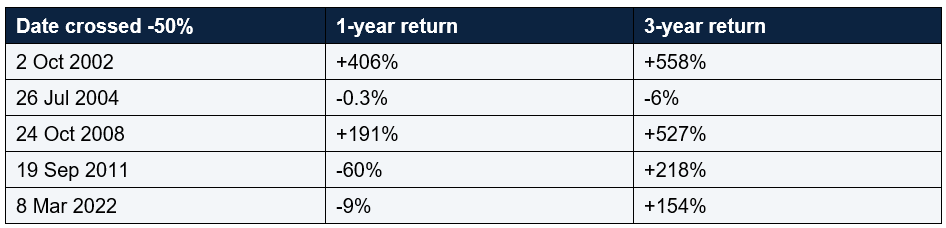
I could not verify these figures against raw price data, so please treat them as one analyst's table rather than gospel. One other site claimed five crashes too, but its article gave no details for four of them and no sources, so I did not rely on it.
A few context points are worth knowing. In 2002 and 2008 the whole market was already deeply down, so Netflix's drop came during a broad sell-off, and in 2008 the stock bottomed about three days later, roughly 5% below the crossing point. In 2011 the shares fell a further 63% before bottoming in September 2012. In 2022 they fell another 51% before bottoming in May 2022.
If you only look at three-year outcomes, it looks like halving was a gift. If you only look at one-year outcomes, it looks like a trap. Both are true, and the gap between them is volatility: you often had to sit through more pain before the payoff arrived.
To make this concrete, here is what $10,000 would have become over three years, starting from each crossing date (my calculation): about $65,800 in 2002, $9,400 in 2004, $62,700 in 2008, $31,800 in 2011 and $25,400 in 2022. Over one year the range was far wider, from about $4,000 (2011) to about $50,600 (2002).
Be careful: Five data points is a tiny sample. Two of the five came during market-wide crashes, which is not the situation today. Do not treat this as a forecast.
The author of that analysis notes the S&P 500 was less than 1% below its record on 21 October 2026, so this slide is mainly company-specific. That makes it look more like the cases where the first year went badly, not like 2002 or 2008, though one analyst's reading is not proof.
Today it is not. Third-quarter 2026 revenue was $12.87 billion, up 11.8%. Operating margin was 34.6% and diluted earnings per share were $0.87, against $0.59 a year earlier. The prior-year quarter included a $619 million Brazil tax charge, so some of that jump is a flattering comparison, according to the same summary. Free cash flow was $2.88 billion in the quarter and $11.4 billion over the trailing twelve months.
So this drop is not a subscriber collapse. It is a story about expectations, growth slowing and a handful of strategic missteps, which is a different kind of problem and could resolve differently.
The advertising cut. Netflix reduced its 2026 ad revenue forecast to about $2.7 billion from about $3 billion, and said ad product rollouts were slower than planned. It also pushed an ad tier launch in 15 countries to March 2027.
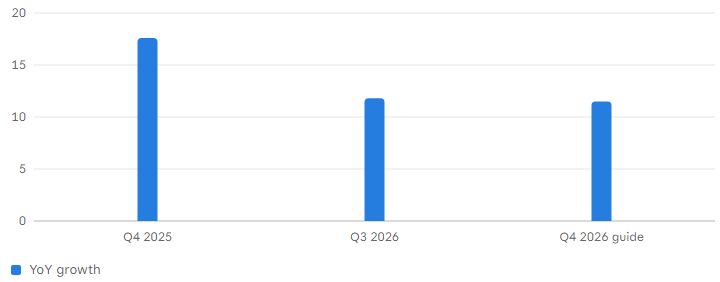
Slowing growth. The fourth-quarter revenue forecast implies about 11.5% growth, the fourth straight quarter of slower growth, down from 17.6% at the end of 2025. The fourth-quarter operating margin guide is 26%, including about 120 basis points from job cuts of roughly 1,000 roles.
Engagement worries. The finance chief was quoted saying the company wants to grow view hours faster and is "not satisfied". Nobody can say exactly how much each factor cost the shares, and the TIKR article does not try to isolate the Warner effect either.
Netflix is also buying back stock aggressively. In the third quarter it repurchased $4.8 billion of shares, a record, and $10.7 billion over nine months, with $22.3 billion of authorisation left . Using the market value of about $255 billion quoted with the Fool article, nine months of buybacks is roughly 4% of the company (my calculation). Diluted shares are down about 3% from a year ago.
The balance sheet looks manageable. Total debt was $15.1 billion against $8.2 billion in cash at 30 September, a net debt of about $7.1 billion, against trailing free cash flow of $11.4 billion (my comparison). These figures come from a third-party summary of filings, which I could not check against the filings themselves.
One source disagrees, quoting a P/E of around 23. It may use a different earnings basis or a stale figure, which is a good reminder to check how any multiple was built. The article behind the Yahoo piece also says the forward P/E was about 40 at the June 2025 peak. If so, the multiple has shrunk by more than half (my calculation) while the share price fell about 54%, meaning earnings have grown rather than collapsed.
Analysts remain mostly positive. One tally shows 7 strong buys, 28 buys, 15 holds and 1 sell, with an average target near $85 [2]. That is about 36% above $62.15 (my calculation). Targets lag price moves, so they may be stale. Also, TIKR notes the average target is down 37% from its high.
That matters for how you might act. Someone who bought in 2011 at the crossing point saw their money cut by more than half within a year, then tripled over three. Someone who bought in 2022 lost about 9% over a year, but made over 150% over three. Both are "history says it worked" stories, and both required living through a bad stretch first.
The other lesson is that the starting point is arbitrary. The 24/7 Wall St. piece shows $1,000 invested right after the split is now worth about $568. If the stock had been bought at the peak, the loss is steeper. If bought near the recent low, it is not. Your own result depends on your own timing.
Others decide first how much of a portfolio one company should be, and then size any position to that limit. If a 50% drop would hurt you badly, the position may simply be too large.
Others wait for evidence, such as signs that revenue growth and the ad business stabilise. That costs some upside if the shares recover fast, but it avoids guessing. If you did something like this, the numbers worth checking are the ones above: slowing growth, margin guidance, ad revenue and buyback pace.
If the smallest three-year gain in the table (154%) repeated from $62.15, the stock would reach about $158 (my calculation), roughly 18% above the $133.91 record. That is arithmetic, not a prediction.
The bear case: revenue growth has slowed four quarters running, the ad forecast was cut, the Warner Bros. attempt hurt credibility, and the history shows the stock often keeps falling after the halfway mark. In 2004 the shares were still lower after three years. A cheaper multiple can get cheaper still if earnings estimates are cut. Notice that both cases use the same facts. What differs is how much you trust management to reaccelerate growth.
What looks different this time is the business, which is profitable and cash generative rather than shrinking, and the valuation, which has fallen to the high teens. What looks the same is the risk that expectations keep resetting lower. That leaves a real judgement call, and it should be made against your own time horizon, not a chart. This post is education only, not advice.
About 53% from the $133.91 split-adjusted closing high of 30 June 2025, based on a $62.15 close on 13 November 2026. Other starting dates give a smaller drop.
Did buying after past 50% drops pay off?
Not quickly. By the figures I found, the one-year return was positive in two of five cases, while the three-year return was positive in four of five.
Was the halfway mark the bottom before?
Rarely. In four of five cases the stock fell at least another third after the crossing, according to that analysis.
Is Netflix cheap now?
It trades around 17 to 18 times earnings on several measures, versus about 40 at the peak, but one source quotes about 23. Cheap compared with its own history is not the same as cheap in absolute terms.
Does Netflix pay a dividend?
As general knowledge, Netflix has historically not paid a regular dividend and has returned cash through share buybacks. I did not retrieve a source on this, so please check the latest position.
Table of Contents
- The quick answer
- How far Netflix has fallen
- The five earlier drops
- What the history actually says
- Why this drop is different from 2022
- What went wrong this time
- The numbers that still look strong
- Valuation: what you pay now
- Why the halfway mark is not a floor
- What a buyer could do with this history
- Bull case versus bear case
- What to watch next
- Conclusion
- FAQ
Netflix share price: peak, halfway mark, now ($)
US$ by Source: Motley Fool analysis; split-adjusted
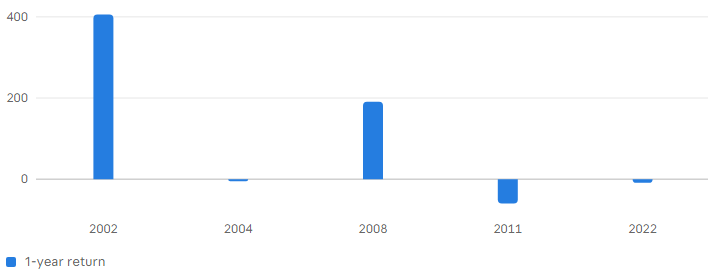
1-year return after Netflix first fell 50% (%)
% return by Source: Motley Fool analysis (unverified against raw prices)
Netflix revenue growth is slowing (%)
% growth by Source: Motley Fool; sec-api.io summary of filingsThe quick answer
Netflix shares have lost more than half their value since the 2025 peak, and the question every investor asks after a drop like that is simple: have I seen this before, and what happened next? For Netflix, the answer is yes, five times, and the results are surprisingly mixed.The short version, using the figures in one published analysis: buying when Netflix first fell 50% below its record produced a gain after one year in only two of five cases, but a gain after three years in four of five. That is a very different story from "buy the dip and watch it pop".
This post walks through those five episodes, what is different about today's drop, and why the halfway mark has rarely been the bottom. It is education, not a recommendation.
Key takeaway: History favours patience over a quick bet. The one-year record after past halving was weak, the three-year record was strong, and the stock often kept falling first.
How far Netflix has fallen
Netflix closed at $62.15 on 13 November 2026, according to the quote shown with one recent article. The split-adjusted closing high was $133.91 on 30 June 2025, which puts the shares about 53% below peak by that article's count. By my calculation, $62.15 against $133.91 is a 53.6% decline.Sources do not agree on the starting line. A 24/7 Wall St. article measures from the post-split close of $110.29 on 17 November 2025 and gets a smaller drop, and the 52-week high quoted is $115.25 (about 46% above today's price, my calculation). Another site quotes a 52-week high of $116.73. The difference is simply which date you start counting from. The June 2025 peak is the one that supports the headline, and the later starting points make the fall look smaller.
The stock first closed more than 50% below its peak on 21 October 2026, the day after third-quarter results. Halfway from $133.91 is $66.96 (my calculation), so the shares are now a little below that mark.
The five earlier drops
According to the analysis behind this post's headline, Netflix has fallen to 50% below its record five times since its 2002 IPO. The returns below are measured from the day the shares first closed that far below their high, using split-adjusted prices.I could not verify these figures against raw price data, so please treat them as one analyst's table rather than gospel. One other site claimed five crashes too, but its article gave no details for four of them and no sources, so I did not rely on it.
A few context points are worth knowing. In 2002 and 2008 the whole market was already deeply down, so Netflix's drop came during a broad sell-off, and in 2008 the stock bottomed about three days later, roughly 5% below the crossing point. In 2011 the shares fell a further 63% before bottoming in September 2012. In 2022 they fell another 51% before bottoming in May 2022.
What the history actually says
Look at the middle of the table. The median one-year return is about flat (-0.3%), while the median three-year return is +218% (my calculation from the five rows). That one comparison explains why the history is so easy to misread.If you only look at three-year outcomes, it looks like halving was a gift. If you only look at one-year outcomes, it looks like a trap. Both are true, and the gap between them is volatility: you often had to sit through more pain before the payoff arrived.
To make this concrete, here is what $10,000 would have become over three years, starting from each crossing date (my calculation): about $65,800 in 2002, $9,400 in 2004, $62,700 in 2008, $31,800 in 2011 and $25,400 in 2022. Over one year the range was far wider, from about $4,000 (2011) to about $50,600 (2002).
Be careful: Five data points is a tiny sample. Two of the five came during market-wide crashes, which is not the situation today. Do not treat this as a forecast.
The author of that analysis notes the S&P 500 was less than 1% below its record on 21 October 2026, so this slide is mainly company-specific. That makes it look more like the cases where the first year went badly, not like 2002 or 2008, though one analyst's reading is not proof.
Why this drop is different from 2022
The 2022 episode is the closest comparison because it is the most recent, and it is where the difference shows. In early 2022 Netflix lost 200,000 paid memberships and forecast losing 2 million more . The business itself was shrinking.Today it is not. Third-quarter 2026 revenue was $12.87 billion, up 11.8%. Operating margin was 34.6% and diluted earnings per share were $0.87, against $0.59 a year earlier. The prior-year quarter included a $619 million Brazil tax charge, so some of that jump is a flattering comparison, according to the same summary. Free cash flow was $2.88 billion in the quarter and $11.4 billion over the trailing twelve months.
So this drop is not a subscriber collapse. It is a story about expectations, growth slowing and a handful of strategic missteps, which is a different kind of problem and could resolve differently.
What went wrong this time
Several things have hit the stock, and they are hard to separate from one another. The Warner Bros. bid. In December 2025 Netflix agreed to buy Warner Bros. Discovery's streaming and studios business at $27.75 a share, an equity value of about $72 billion. The deal was later changed to all cash. In February 2026 Warner terminated it to sign with Paramount Skydance, and Netflix received a termination fee of about $2.8 billion. One source says $3 billion in one place and $2.8 billion in another, so I use the lower, more widely repeated figure.The advertising cut. Netflix reduced its 2026 ad revenue forecast to about $2.7 billion from about $3 billion, and said ad product rollouts were slower than planned. It also pushed an ad tier launch in 15 countries to March 2027.
Slowing growth. The fourth-quarter revenue forecast implies about 11.5% growth, the fourth straight quarter of slower growth, down from 17.6% at the end of 2025. The fourth-quarter operating margin guide is 26%, including about 120 basis points from job cuts of roughly 1,000 roles.
Engagement worries. The finance chief was quoted saying the company wants to grow view hours faster and is "not satisfied". Nobody can say exactly how much each factor cost the shares, and the TIKR article does not try to isolate the Warner effect either.
The numbers that still look strong
It would be misleading to leave out the strong side. Full-year 2026 guidance is for revenue of about $51.1 billion (up 13%) and an operating margin of 31.5%, up from 29.5% in 2025, which implies operating income growth above 20%. Free cash flow is guided to about $12 billion.Netflix is also buying back stock aggressively. In the third quarter it repurchased $4.8 billion of shares, a record, and $10.7 billion over nine months, with $22.3 billion of authorisation left . Using the market value of about $255 billion quoted with the Fool article, nine months of buybacks is roughly 4% of the company (my calculation). Diluted shares are down about 3% from a year ago.
The balance sheet looks manageable. Total debt was $15.1 billion against $8.2 billion in cash at 30 September, a net debt of about $7.1 billion, against trailing free cash flow of $11.4 billion (my comparison). These figures come from a third-party summary of filings, which I could not check against the filings themselves.
Valuation: what you pay now
Valuation is where the decline has done its work. Several sources put the stock at roughly 17 to 18 times earnings: a forward P/E of 17.3, a trailing P/E of 17.6, and about 18 times 2027 estimates. TIKR cites 18.3 times next-twelve-month earnings and about 17.5 times 2027 estimates. The Fool article says about 17 times 2027 estimates.One source disagrees, quoting a P/E of around 23. It may use a different earnings basis or a stale figure, which is a good reminder to check how any multiple was built. The article behind the Yahoo piece also says the forward P/E was about 40 at the June 2025 peak. If so, the multiple has shrunk by more than half (my calculation) while the share price fell about 54%, meaning earnings have grown rather than collapsed.
Analysts remain mostly positive. One tally shows 7 strong buys, 28 buys, 15 holds and 1 sell, with an average target near $85 [2]. That is about 36% above $62.15 (my calculation). Targets lag price moves, so they may be stale. Also, TIKR notes the average target is down 37% from its high.
Why the halfway mark is not a floor
The most useful lesson from the table is not about the endings, it is about the middle. In four of the five cases, the stock fell at least another third after crossing the halfway mark. The halfway line is a round number on a chart, not a floor under the business.That matters for how you might act. Someone who bought in 2011 at the crossing point saw their money cut by more than half within a year, then tripled over three. Someone who bought in 2022 lost about 9% over a year, but made over 150% over three. Both are "history says it worked" stories, and both required living through a bad stretch first.
The other lesson is that the starting point is arbitrary. The 24/7 Wall St. piece shows $1,000 invested right after the split is now worth about $568. If the stock had been bought at the peak, the loss is steeper. If bought near the recent low, it is not. Your own result depends on your own timing.
What a buyer could do with this history
I cannot tell you what to do, but I can describe how people commonly think about a situation like this, so you can compare it with your own plan. Some investors split a purchase into several smaller ones over time rather than committing all at once, which is the approach the Fool author says he would consider near $60 . That spreads out the timing risk that history shows is real.Others decide first how much of a portfolio one company should be, and then size any position to that limit. If a 50% drop would hurt you badly, the position may simply be too large.
Others wait for evidence, such as signs that revenue growth and the ad business stabilise. That costs some upside if the shares recover fast, but it avoids guessing. If you did something like this, the numbers worth checking are the ones above: slowing growth, margin guidance, ad revenue and buyback pace.
Bull case versus bear case
The bull case: a business with a 34.6% operating margin, rising earnings, record buybacks, strong cash flow and a forward multiple in the high teens, down from about 40 at the peak. If the three-year pattern holds, the downside looks cushioned by valuation.If the smallest three-year gain in the table (154%) repeated from $62.15, the stock would reach about $158 (my calculation), roughly 18% above the $133.91 record. That is arithmetic, not a prediction.
The bear case: revenue growth has slowed four quarters running, the ad forecast was cut, the Warner Bros. attempt hurt credibility, and the history shows the stock often keeps falling after the halfway mark. In 2004 the shares were still lower after three years. A cheaper multiple can get cheaper still if earnings estimates are cut. Notice that both cases use the same facts. What differs is how much you trust management to reaccelerate growth.
What to watch next
If you follow Netflix, these are the data points I would track: Revenue growth: does it stabilise near 11% or keep slowing? Advertising: does revenue recover toward the guided growth above 80%, and does the March 2027 ad tier launch go to plan? Margins: management guides 31.5% for 2026 and 26% for the fourth quarter, including job cut costs. The January report: TIKR expects it to set the 2027 outlook. Buybacks: whether the record pace continues at lower prices.Conclusion
Netflix has fallen more than 50% from its peak only five times before, and the record is mixed: roughly flat after a year, strongly positive after three, and often painful in between. The halfway mark was rarely the bottom.What looks different this time is the business, which is profitable and cash generative rather than shrinking, and the valuation, which has fallen to the high teens. What looks the same is the risk that expectations keep resetting lower. That leaves a real judgement call, and it should be made against your own time horizon, not a chart. This post is education only, not advice.
FAQ
How far has Netflix stock fallen from its peak?About 53% from the $133.91 split-adjusted closing high of 30 June 2025, based on a $62.15 close on 13 November 2026. Other starting dates give a smaller drop.
Did buying after past 50% drops pay off?
Not quickly. By the figures I found, the one-year return was positive in two of five cases, while the three-year return was positive in four of five.
Was the halfway mark the bottom before?
Rarely. In four of five cases the stock fell at least another third after the crossing, according to that analysis.
Is Netflix cheap now?
It trades around 17 to 18 times earnings on several measures, versus about 40 at the peak, but one source quotes about 23. Cheap compared with its own history is not the same as cheap in absolute terms.
Does Netflix pay a dividend?
As general knowledge, Netflix has historically not paid a regular dividend and has returned cash through share buybacks. I did not retrieve a source on this, so please check the latest position.
0 Comments
Be the first to share your thoughts on this article.