

Investing
S&P 500 Has Gone 18 Months Without a 10% Drop: What's Ahead?

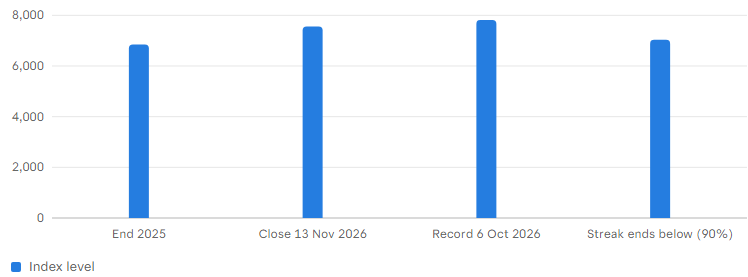
Only seven past stretches since 1950 lasted this long. Did a tough year normally follow? Last 10% drop closed 28 Apr 2025; record close 7,818.93 (6 Oct 2026); close 7,561.67 (13 Nov 2026); +10.5% year to date; higher a year later in 5 of 7 past streaks.
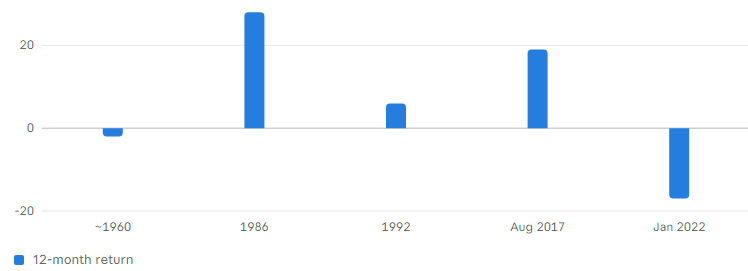
So what usually came next? In that analysis, the index was higher a year later in five of the seven cases, and the average gain was about 7%. Two cases were down: one around 1960, which was about -2%, and one starting in January 2022, which was about -17%.
It is worth saying what the headline does not claim. It does not say a decline is overdue, and it does not say the market is safe. It simply counts months and asks what followed, which is a fair question even if the answer is untidy.
My read, which is a framing and not advice: the streak by itself tells you very little. The calm lasted only a couple of months in some cases and years in others. This post explains why, with the numbers.
Key takeaway: A long calm stretch was not a reliable warning or a reliable green light. What mattered more was interest rates, valuation and the economy, not the number of months.
The Fool article describes a sharper wobble. On 5 November the index fell 4.36% on weakness in AI-linked chipmakers, leaving it about 6% below the October record at that point. The article also says the index was near 7,520, about 4% below the record, when it was written. The two figures are slightly different because they use different dates, so I would not read anything into the gap.
There is one detail that matters for the streak. The worst drawdown in 2026 was -9.1%, from a peak on 27 January to a low on 30 March, and the index regained its record on 15 April. That was close to ending the streak, though it did not.
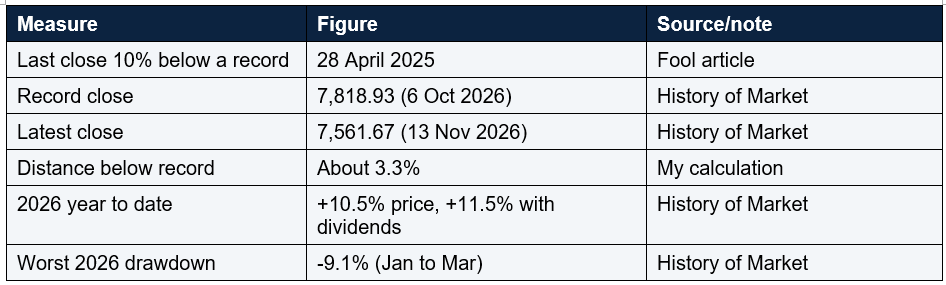
By that rule, the current streak ends if the S&P 500 closes below about 7,037, which is 90% of the October record (my calculation, 7,818.93 times 0.9). From the 13 November close, that is a fall of about 6.9%, or about 525 points (my calculation).
Note that the streak could have an intraday dip below 10% and not end, because only closes count. A different analyst using intraday lows or another start date would count differently, which is why you will see slightly different numbers in different places.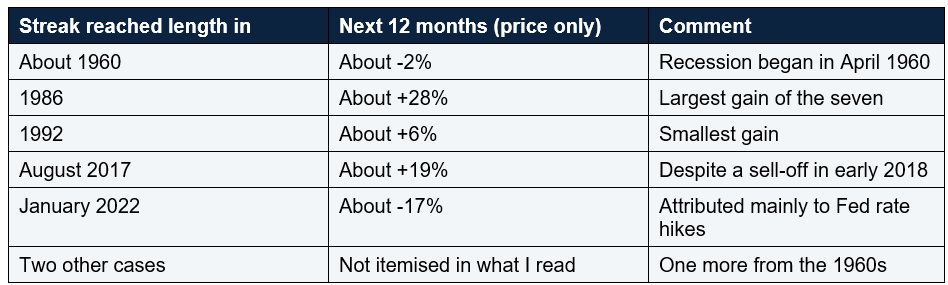
I could not reconstruct all seven rows from what I retrieved, so the table shows only the cases I can support. The article's summary figures are: higher in five of seven (about 71%), an average near 7% and, excluding 2022, an average near 11% for the other six .
The 7% average checks out with the numbers above if the six non-2022 cases sum to about 66 percentage points (my calculation): 66 minus 17, divided by seven, is about 7%. Three of the seven streaks ended within the following year, and four lasted at least another year.
For comparison, across all trading days since 1950 the S&P 500 finished the next 12 months higher about 75% of the time, with a median gain of about 11% and an average of about 9%. After long calm streaks, the figures were about 71% higher and an average of 7%. That is slightly worse than normal, but the difference is well within what chance could produce with seven cases.
The article's author also notes that streak length leaves out things he considers more important, such as interest rates and valuation. I could not retrieve a valuation figure for today's index, so I cannot tell you whether the S&P 500 looks expensive. That is a gap in this post. Be careful: Seven observations cannot tell you what a year will do. Treat the pattern as context, not a forecast.
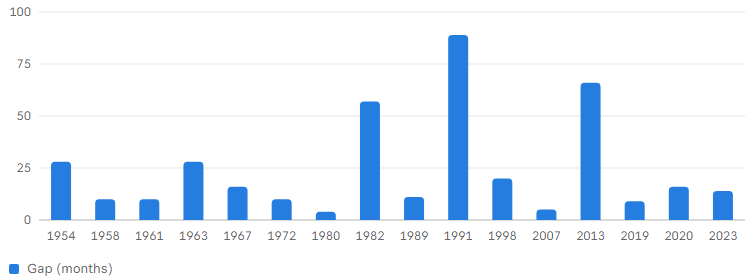
By my count of the 16 gaps in that catalog, six were longer than 18 months. The catalog's own stated median gap is 12.5 months, though my calculation of the listed values gives about 15, so one of us has slipped. Either way, the point stands: 18 months is long, but not rare.
There is a method difference to flag. That catalog uses monthly averages and the Fool article uses daily closes, and a different October 2026 Fool article counts 24 drops of 10% or more since 1950, about one every three years. The counts differ because the definitions differ. None of these is wrong, but you should not mix them.
In other words, the bad years had identifiable causes that were separate from how long the calm had lasted. That cuts both ways. A streak does not make a decline more likely, but it also does not protect you from the next shock.
In the 1990s the calm lasted for years with no major decline, so the streak clearly did not predict trouble then. The author's own conclusion is that the pattern is neither a warning sign nor a bullish signal.
Applying the streak outcomes to $10,000 over a year (my calculation, price only, ignoring dividends): the best case in the list, +28%, would give about $12,800; the average, +7%, about $10,700; and the 2022 case, -17%, about $8,300.
The point is the spread. Even in a seven-case sample, the one-year outcomes ranged from about -17% to +28%, which is a gap of 45 percentage points. That variability is something to plan for, whatever the average says.
Those are price-only figures. Reinvested dividends would usually have shortened the wait somewhat. The 2025 example is a recent case: a drop of about 19% from the February record to the 8 April low, and a new record on 27 June, under three months later.
The author of that article suggests that the slow cases matter more than the median for planning, because money you need soon could be stuck during a long downturn. That seems a sensible way to think about it, though it is his view.
If you hold the index through a workplace pension or a regular monthly contribution, the streak is mostly background noise. Your purchases already spread themselves across highs and lows, which is one reason many people find this approach easier to stick with than trying to guess the next turn. If you are tempted to move to cash because the market has gone a long time without a drop, the data in this post suggests that timing is hard. Calm lasted months in some cases and years in others.
AI-linked stocks: the 5 November sell-off was tied to chipmakers, and a larger share of index gains may sit in a few names. I did not retrieve data on concentration, so treat that as a question to check. Interest rates and the Federal Reserve: the 2022 fall was linked to rate rises. Valuation: which this post does not measure. Recession signals: the 1960 dip happened alongside a recession.
That is not a signal to buy or to sell. It is a reminder that long calm periods happen, that they can end suddenly or last for years, and that the best preparation is a plan that can survive a 10% fall. This post is education only, not advice.
The last close at least 10% below the record was 28 April 2025, at 5,528.75 against a record of 6,144.
How far would the index have to fall to end the streak?
A close below about 7,037, which is 90% of the 7,818.93 record, or about 6.9% below the 13 November close of 7,561.67 (my calculation).
What happened after past streaks this long?
Higher a year later in five of seven cases, with an average of about 7%, and about 11% excluding 2022.
Does a long streak mean a crash is coming?
No. The article's author sees it as neither a warning nor a bullish signal, and long calm stretches in the 1990s lasted for years.
Are the figures in this post exact?
No. Different sources use different methods and dates, and I could not retrieve all seven past cases in detail. Conflicts are flagged in the text.
Table of Contents
- The quick answer
- Where the S&P 500 stands
- What counts as a streak
- How the next year went after past streaks
- Why the sample is so small
- Streaks are not rare
- Why 2022 was different
- What a 10% drop would look like from here
- How often corrections come and go
- What this means for different investors
- Bull case versus bear case
- What to watch next
- Conclusion
- FAQ
S&P 500 next-12-month return after past long streaks (%)
S&P 500 levels: where the streak would end
Index points by Source: History of Market, Fool; threshold is my calculation
Months between 10%+ S&P 500 drawdowns since 1950
Months by Gap start (recovery year); source: Eco3min, monthly-average method
The quick answer
The S&P 500 last closed 10% or more below its record on 28 April 2025. Since then, more than 380 trading days have passed without a repeat, which is about 18 months. By one analysis, only seven earlier stretches since 1950 lasted this long.So what usually came next? In that analysis, the index was higher a year later in five of the seven cases, and the average gain was about 7%. Two cases were down: one around 1960, which was about -2%, and one starting in January 2022, which was about -17%.
It is worth saying what the headline does not claim. It does not say a decline is overdue, and it does not say the market is safe. It simply counts months and asks what followed, which is a fair question even if the answer is untidy.
My read, which is a framing and not advice: the streak by itself tells you very little. The calm lasted only a couple of months in some cases and years in others. This post explains why, with the numbers.
Key takeaway: A long calm stretch was not a reliable warning or a reliable green light. What mattered more was interest rates, valuation and the economy, not the number of months.
Where the S&P 500 stands
The S&P 500 closed at 7,561.67 on 13 November 2026, up about 10.5% for the year on a price basis (my calculation matches the 10.5% shown, and about 11.5% including dividends). The record close is 7,818.93, set on 6 October 2026, which puts the index about 3.3% below its high (my calculation).The Fool article describes a sharper wobble. On 5 November the index fell 4.36% on weakness in AI-linked chipmakers, leaving it about 6% below the October record at that point. The article also says the index was near 7,520, about 4% below the record, when it was written. The two figures are slightly different because they use different dates, so I would not read anything into the gap.
There is one detail that matters for the streak. The worst drawdown in 2026 was -9.1%, from a peak on 27 January to a low on 30 March, and the index regained its record on 15 April. That was close to ending the streak, though it did not.
What counts as a streak
Definitions matter here. The Fool article uses daily closing prices from Yahoo Finance and counts how long the index stayed within 10% of its most recent record close, excluding dividends. A stretch ends when the index closes 10% or more below the record.By that rule, the current streak ends if the S&P 500 closes below about 7,037, which is 90% of the October record (my calculation, 7,818.93 times 0.9). From the 13 November close, that is a fall of about 6.9%, or about 525 points (my calculation).
Note that the streak could have an intraday dip below 10% and not end, because only closes count. A different analyst using intraday lows or another start date would count differently, which is why you will see slightly different numbers in different places.
How the next year went after past streaks
I could not reconstruct all seven rows from what I retrieved, so the table shows only the cases I can support. The article's summary figures are: higher in five of seven (about 71%), an average near 7% and, excluding 2022, an average near 11% for the other six .
The 7% average checks out with the numbers above if the six non-2022 cases sum to about 66 percentage points (my calculation): 66 minus 17, divided by seven, is about 7%. Three of the seven streaks ended within the following year, and four lasted at least another year.
Why the sample is so small
Seven cases is a tiny sample, and the averages are heavily affected by one bad year. Without 2022, the average gain is about 11%. With it, about 7%. One data point moved the answer by four percentage points.For comparison, across all trading days since 1950 the S&P 500 finished the next 12 months higher about 75% of the time, with a median gain of about 11% and an average of about 9%. After long calm streaks, the figures were about 71% higher and an average of 7%. That is slightly worse than normal, but the difference is well within what chance could produce with seven cases.
The article's author also notes that streak length leaves out things he considers more important, such as interest rates and valuation. I could not retrieve a valuation figure for today's index, so I cannot tell you whether the S&P 500 looks expensive. That is a gap in this post. Be careful: Seven observations cannot tell you what a year will do. Treat the pattern as context, not a forecast.
Streaks are not rare
It helps to remember that long gaps between corrections are not unusual. A separate catalog lists 17 declines of 10% or more since 1950, about one every 4.5 years (my calculation from that list). The longest stretches without one were about 89 months (February 1991 to July 1998), 66 months (March 2013 to September 2018) and 57 months (November 1982 to August 1987).By my count of the 16 gaps in that catalog, six were longer than 18 months. The catalog's own stated median gap is 12.5 months, though my calculation of the listed values gives about 15, so one of us has slipped. Either way, the point stands: 18 months is long, but not rare.
There is a method difference to flag. That catalog uses monthly averages and the Fool article uses daily closes, and a different October 2026 Fool article counts 24 drops of 10% or more since 1950, about one every three years. The counts differ because the definitions differ. None of these is wrong, but you should not mix them.
Why 2022 was different
The 2022 case is the one that hurts the average. The article attributes the 17% fall mainly to the Federal Reserve raising interest rates starting that March, not to the streak itself [1]. In 1960 the index dipped about 2% during a recession.In other words, the bad years had identifiable causes that were separate from how long the calm had lasted. That cuts both ways. A streak does not make a decline more likely, but it also does not protect you from the next shock.
In the 1990s the calm lasted for years with no major decline, so the streak clearly did not predict trouble then. The author's own conclusion is that the pattern is neither a warning sign nor a bullish signal.
What a 10% drop would look like from here
It can help to turn the percentages into dollars, though I want to be clear this is an illustration. If a $10,000 index holding fell 10% it would be worth about $9,000, a $1,000 paper loss (my calculation).Applying the streak outcomes to $10,000 over a year (my calculation, price only, ignoring dividends): the best case in the list, +28%, would give about $12,800; the average, +7%, about $10,700; and the 2022 case, -17%, about $8,300.
The point is the spread. Even in a seven-case sample, the one-year outcomes ranged from about -17% to +28%, which is a gap of 45 percentage points. That variability is something to plan for, whatever the average says.
How often corrections come and go
When corrections do arrive, they have usually passed. Since 1950, all 24 declines of 10% or more eventually reached a new record close, with a median wait of about five months from the bottom [4]. Corrections under 20% had a median wait of about three months, while bear markets took a median of about 15 months, and the slowest recovery took almost six years, after the October 1974 low.Those are price-only figures. Reinvested dividends would usually have shortened the wait somewhat. The 2025 example is a recent case: a drop of about 19% from the February record to the 8 April low, and a new record on 27 June, under three months later.
The author of that article suggests that the slow cases matter more than the median for planning, because money you need soon could be stuck during a long downturn. That seems a sensible way to think about it, though it is his view.
10. What this means for different investors
The same facts mean different things for different people. If you invest regularly over many years, a correction is mostly an opportunity to buy at lower prices, and the length of the current calm should not change your plan. If you are close to needing the money, for a house deposit or retirement, the issue is not the streak but how much of your savings could fall by 10% to 20% without forcing you to sell. That is a question about your own situation.If you hold the index through a workplace pension or a regular monthly contribution, the streak is mostly background noise. Your purchases already spread themselves across highs and lows, which is one reason many people find this approach easier to stick with than trying to guess the next turn. If you are tempted to move to cash because the market has gone a long time without a drop, the data in this post suggests that timing is hard. Calm lasted months in some cases and years in others.
Bull case versus bear case
The bull case: the index is up about 10.5% this year, it is only about 3.3% off its record, it survived a -9.1% dip in the spring, and long calm stretches have often continued, as in the 1990s and 2010s. The bear case: the 5 November fall of 4.36% on AI-linked chipmaker weakness shows how concentrated some of the gains may be, the streak is long by historical standards, and the one bad outcome in recent history was caused by rate rises, which remain a live risk. Both cases are consistent with the same history. I do not think the streak helps you choose between them.What to watch next
If you follow the market, these are the points I would watch: The 7,037 line: the level of a close that would end the streak, about 6.9% below the 13 November close.AI-linked stocks: the 5 November sell-off was tied to chipmakers, and a larger share of index gains may sit in a few names. I did not retrieve data on concentration, so treat that as a question to check. Interest rates and the Federal Reserve: the 2022 fall was linked to rate rises. Valuation: which this post does not measure. Recession signals: the 1960 dip happened alongside a recession.
Conclusion
The S&P 500 has gone about 18 months without a 10% decline on a closing basis, and past stretches this long ended with a higher index a year later in five of seven cases, with an average of about 7%. The two down years each had a cause, a recession in 1960 and rate hikes in 2022.That is not a signal to buy or to sell. It is a reminder that long calm periods happen, that they can end suddenly or last for years, and that the best preparation is a plan that can survive a 10% fall. This post is education only, not advice.
FAQ
When did the S&P 500 last fall 10% from a record?The last close at least 10% below the record was 28 April 2025, at 5,528.75 against a record of 6,144.
How far would the index have to fall to end the streak?
A close below about 7,037, which is 90% of the 7,818.93 record, or about 6.9% below the 13 November close of 7,561.67 (my calculation).
What happened after past streaks this long?
Higher a year later in five of seven cases, with an average of about 7%, and about 11% excluding 2022.
Does a long streak mean a crash is coming?
No. The article's author sees it as neither a warning nor a bullish signal, and long calm stretches in the 1990s lasted for years.
Are the figures in this post exact?
No. Different sources use different methods and dates, and I could not retrieve all seven past cases in detail. Conflicts are flagged in the text.
0 Comments
Be the first to share your thoughts on this article.