

Vehicles & Cars
Car Ownership Costs $5,851 a Year Beyond Your Loan
New research from Insurify — published today, September 14, 2026 — reveals that U.S. drivers spend an average of $5,851 every year on car ownership costs before a single loan payment is made. Insurance, petrol, and maintenance are silently consuming thousands of dollars that most drivers never add up. This guide breaks down every component, reveals who is hit hardest, and shows the concrete steps that can bring the total down.

Insurify, the insurance comparison platform, has totalled them up. Their analysis, published today — September 14, 2026 — and reported by CNBC, finds that U.S. drivers spend an average of $5,851 per year on car ownership costs beyond their auto loan payments. That is $487.58 every month in insurance, fuel, and maintenance alone. For a driver paying the average $770 monthly payment on a new car, the true monthly outlay exceeds $1,257 before depreciation is even considered.
This is not a marginal add-on. It is a second, near-invisible car payment — and it has been driven sharply higher by the same forces reshaping household finances in 2026: insurance premiums re-accelerating after a brief 2025 reprieve, gasoline prices up 56% from 2019 levels amid the ongoing Iran War's impact on oil markets, and maintenance costs swollen by parts inflation and the rising complexity of modern vehicles. This guide dissects each component, quantifies who pays the most and the least, and identifies the specific actions that meaningfully reduce the total.
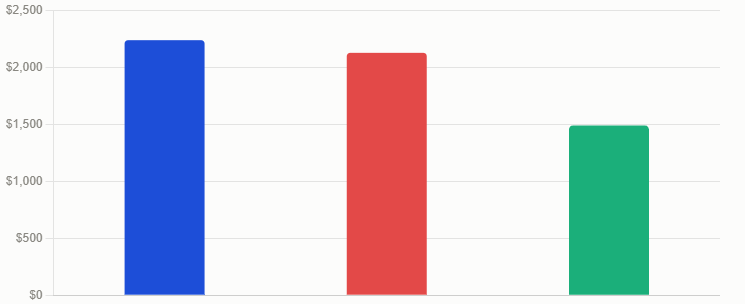
$5,851/year = average annual car ownership costs beyond loan payments (Insurify analysis, September 14, 2026, reported by CNBC today). Breakdown: $2,237 full-coverage insurance + $2,126 gasoline + $1,488 maintenance/repairs. On top of: average new car loan payment $770/month (Experian Q1 2026); average used car payment $531/month. New car prices averaging $49,855 (Kelley Blue Book, July 2026). Gas: $4.29/gallon national average today (AAA). Insurance up ~50% since July 2019 (BLS).
The analysis is explicit about what the $5,851 does and does not include. It covers insurance, fuel, and maintenance. It does not include the loan payment itself, depreciation (the largest single cost of vehicle ownership for most drivers), registration fees, or parking. It is, in other words, the floor — the minimum ongoing cost before the largest expenses are counted.
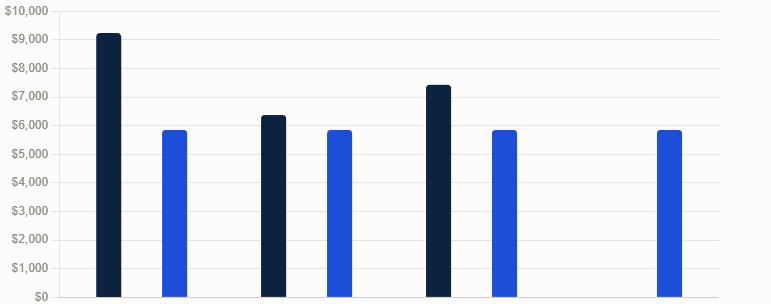
For context: the average new car monthly payment in Q1 2026 was $770, according to Experian — up 2.9% from Q1 2025. Adding the $487.58 monthly ownership cost from Insurify's figure brings the average new-car driver's total monthly cash outlay to $1,257.58, or $15,090 per year in out-of-pocket cash — before depreciation, which for a new vehicle typically runs $3,000 to $5,000 in year one alone.
Annual car costs for a typical new-car owner (September 2026 averages). Loan payment: $770/month × 12 = $9,240/year. Insurance (full coverage, Insurify H1 2026): $2,237/year. Gasoline (Insurify/AAA estimate): $2,126/year. Maintenance/repairs (Insurify/AAA estimate): $1,488/year. Total annual cash outflow: $15,091/year ($1,257/month). Add first-year depreciation (typical new vehicle, AAA 2025 Driving Costs study basis): approximately $4,000–$6,000. All-in year-one economic cost: approximately $19,000–$21,000. Note: these are national averages. Actual costs vary by location, vehicle type, credit score, and driving habits. Not financial advice.
The re-acceleration matters because the 2025 premium decline created a perception that the insurance crisis was over. Insurify CEO Snejina Zacharia, in an exclusive interview with Fox Business, put the reality plainly: 'Unfortunately, this year, a majority of the states are trending up. The severity of weather conditions and the severity of accidents have continued to be very strong. On top of that, we have seen a 45% increase in repair costs.' That 45% figure — from Bureau of Labor Statistics data on national auto maintenance and repair costs over the past five years, compared with just 14% in the previous five-year period — is the structural driver beneath every insurance renewal.
Other sources reflect similar totals. CarInsurance.com estimates full-coverage premiums at $2,578 for 2026, up from $2,513 in 2025, noting that 'premiums remain historically high due to elevated repair costs, more severe claims and ongoing weather-related losses.' The average insurance claim now costs approximately $13,000 — a 10% increase from 2024 — according to AM Best data cited by ValuePenguin. Insurers recovering from years of elevated losses are re-pricing accordingly.
The tariff dimension compounds the problem: vehicle parts costs rose roughly 18% from 2024 to 2026, partly due to tariff policy on imported components. A bumper replacement that cost $850 in parts in 2024 now runs $1,000 to $1,100, according to InsuranceRateGuard's June 2026 analysis. Auto body labour rates climbed approximately 9% over the same period. Insurers absorb these costs in claims — and recover them in premiums.
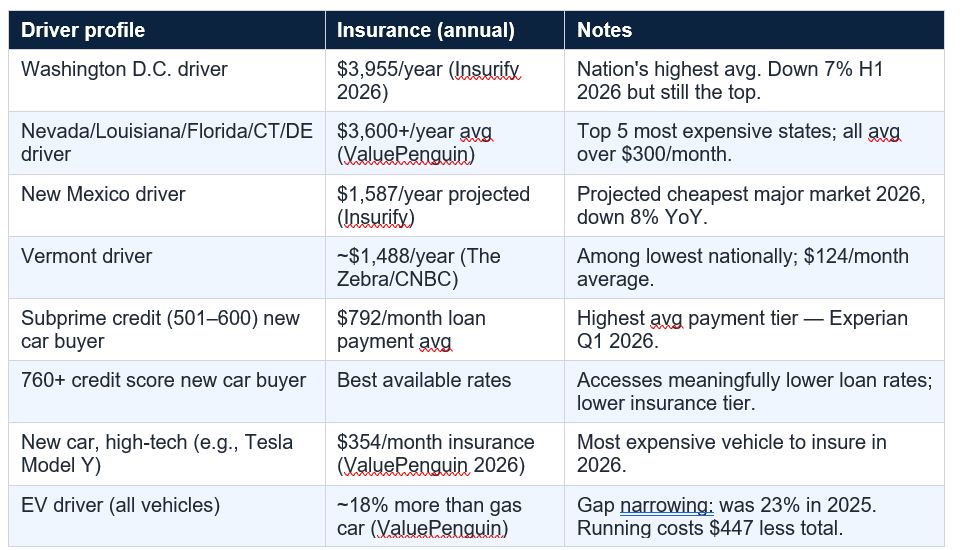
32 states are on track to see insurance rate increases by the end of 2026, according to Insurify's August 2026 report. The sharpest predicted increase is Connecticut at +15% year-over-year. Most expensive state currently: Washington D.C. at $3,955/year average full coverage (down 7% H1 2026, but still the nation's highest). Most expensive states for full coverage per ValuePenguin: Nevada, Louisiana, Florida, Connecticut, Delaware — all averaging over $300/month.
The primary driver of 2026 gasoline prices is the ongoing Iran War. U.S. West Texas Intermediate oil futures climbed above $102 per barrel last week before easing to approximately $99 on Friday, while Brent crude futures traded around $104 per barrel, reflecting heightened concern that the conflict will be prolonged and further restrict the ability of oil tankers in the Middle East to reach global markets.
For a driver covering the national average of approximately 14,000 to 15,000 miles per year in a vehicle achieving 25 to 30 miles per gallon, the fuel math at $4.29 per gallon works out to approximately $2,000 to $2,580 annually — closely aligned with the Insurify $2,126 estimate. The figure is highly sensitive to gas prices: at the May 2026 peak of $4.56, the same driver would have spent roughly $2,130 to $2,736 annually on fuel, a meaningful jump that is invisible in the monthly budget until the year-end total is calculated.
The $2,126 gasoline component could fall by approximately $1,442 for EV drivers — or $1,316 after accounting for the average state EV surcharge imposed to offset lost gasoline tax revenue — according to Insurify's 2026 EV analysis published in the same report. The Iran War-driven fuel price spike appears to be accelerating EV adoption: used EV sales jumped 54% month-over-month in the first month of the conflict (Cox EV Market Monitor, March 2026). For drivers in the market for a used vehicle, the EV economics on running costs are increasingly compelling — with important caveats discussed in Section 9.
The $1,488 figure has been climbing rapidly. National auto maintenance and repair costs have risen 45% over the past five years, compared with just 14% in the preceding five-year period, according to Bureau of Labor Statistics data cited in Insurify's August 2026 report. The primary drivers are parts cost inflation (exacerbated by tariffs on imported components), labour rate increases for increasingly specialised automotive technicians, and the growing complexity of modern vehicles — particularly the integration of driver-assistance technology and electronic systems that require specialised diagnostic equipment.
AAA's 2025 Your Driving Costs study provides the most comprehensive annual benchmark: for a new vehicle driven 75,000 miles over five years, the average ownership cost is $11,577 annually — approximately $965 per month — including depreciation, financing, insurance, taxes, fees, fuel, and maintenance. The maintenance component within that figure runs approximately $1,300 per year for a new vehicle, rising as the vehicle ages and warranty coverage expires.
Insurify's own car maintenance cost data (updated July 31, 2026) puts average maintenance at $792 per year, or $66 per month — somewhat lower than the $1,488 figure in the CNBC/Insurify analysis published today, suggesting the published figure may incorporate a broader definition of routine plus minor unplanned repairs, or reflects 2026 cost escalation beyond the July maintenance data.
The underlying loan amounts explain why payments are at record levels. The average new vehicle loan amount in Q1 2026 was $43,925, up from $42,582 at the end of 2025. The average used vehicle loan was $27,070. Kelley Blue Book data cited in today's CNBC analysis puts the average transaction price for a new car at $49,855 in July 2026 — approximately 34% higher than July 2019. The average used car list price from Cox Automotive was $27,028 in the same month, about 29% above 2019 levels, compared with overall inflation of approximately 30% since that period.
New car payments over $1,000 per month now account for 18.91% of all new car loans, according to LendingTree and Experian data. Banks remain the most common source of auto financing at 28.42% of loans, followed by captive finance companies (26.83%) and credit unions (20.09%). Auto loan debt is the second-largest category of consumer debt in the United States after mortgages — a structural position that makes the $5,851 running cost figure even more significant, as it falls on top of an already substantial debt load.
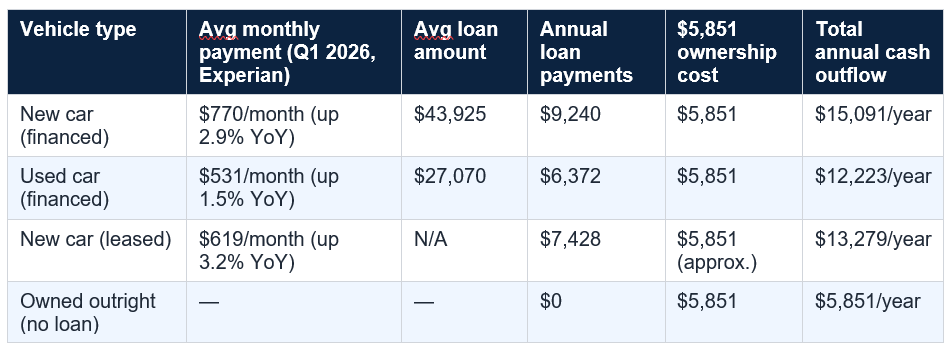
Sources: Experian State of the Automotive Finance Market Q1 2026 (cited LendingTree June 2026, Bankrate August 2026, Yahoo Finance August 2026); Insurify analysis September 14, 2026. Not financial advice. Excludes depreciation, registration, parking, and tolls.
AAA's 2025 Your Driving Costs study — the most authoritative annual benchmark for total vehicle ownership cost — places the average annual ownership cost for a new vehicle driven 75,000 miles over five years at $11,577, or approximately $965 per month. This figure incorporates depreciation, financing costs, insurance, taxes and fees, fuel, and maintenance. It declined $719 from the prior year's study as vehicle prices eased somewhat, but it remains substantially elevated relative to pre-pandemic benchmarks.
A third data point, from Veredictor's 2026 Total Cost of Ownership Reference — a deep-dive analysis incorporating depreciation, fuel, electricity, maintenance, insurance, and registration across different vehicle types — places the 2026 US industry-average five-year cost to own at $80,238, or approximately $16,048 per year, or $1,337 per month. This figure, which includes depreciation and all running costs but excludes loan interest (which depends on the buyer's rate and down payment), represents the comprehensive economic cost of vehicle ownership for the average American driver in 2026.
The difference between the Insurify $5,851 (running costs only, excluding loan), the AAA $11,577 (all-in including depreciation and financing), and the Veredictor $16,048 (five-year average including depreciation) is largely explained by depreciation. A new $49,855 car (Kelley Blue Book July 2026 average) loses approximately 15–25% of its value in the first year — $7,478 to $12,464 in economic value disappearing regardless of whether the driver makes loan payments or not. This is the hidden cost that makes 'buying outright' still expensive, and that makes used cars so financially compelling from a total-cost perspective.
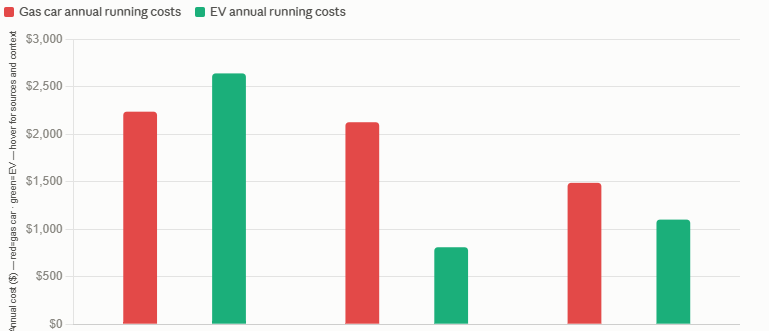
On fuel alone, the EV advantage is substantial. Insurify calculates that the typical EV driver spends $1,442 less annually on fuelling than a comparable gas-powered vehicle driver — reduced to $1,316 once the average state EV surcharge is included. These surcharges, imposed in most states to replace lost gasoline tax revenue, partially offset the fuel savings but leave a meaningful net advantage. With gasoline at $4.29 per gallon today and WTI crude above $99 per barrel amid Iran War concerns, the fuel saving from an EV is near its most compelling level in years. This explains the 54% month-over-month surge in used EV sales in the first month of the Iran War (Cox EV Market Monitor, March 2026).
Combining insurance, maintenance, and fuel, EV drivers spend approximately $447 less annually than gas-powered vehicle drivers, according to Insurify's 2026 analysis. This is the total net running cost advantage of an EV — meaningful, but smaller than the fuel saving alone because EV insurance costs more (18% more expensive than equivalent gas-powered coverage, per ValuePenguin, narrowed from 23% in 2025) and EV maintenance is less predictable for high-value repairs.
The EV repair cost figure deserves careful attention. When damaged — whether in an accident or from road debris — the typical EV repair costs $6,042, which is 23% more than the typical gas-powered car repair of $4,902, according to Mitchell's Q1 2026 Plugged-In EV Collision Insights report. This higher repair cost is one reason EV insurance is more expensive. For drivers who are accident-prone or live in high-theft or severe-weather areas, the $447 annual running cost advantage could be partially or fully consumed by higher insurance premiums and out-of-pocket repair exposure. EVs can also become significantly more costly if battery damage is involved — a consideration not captured in the Insurify $447 figure.
The forces driving state-specific insurance costs include: mandatory minimum coverage requirements (which vary enormously); population density and traffic accident frequency; weather patterns (hail, flooding, hurricane exposure); uninsured motorist rates; the speed at which state regulators approve insurer rate filings; and claims litigation environments. Florida is expensive partly because of its no-fault insurance system and high rate of uninsured drivers. Louisiana's costs reflect its litigation culture and severe weather exposure. Connecticut's 2026 spike is driven by exceptionally high collision repair costs — the average collision claim in Connecticut costs approximately $7,285, one of the highest figures nationally.
The Insurify August 2026 report projects that by year-end 2026, 32 states will have seen net insurance cost increases. The sharpest predicted rise is Connecticut at +15% year-over-year. New Mexico is the notable outlier in the other direction: rates are projected to fall 8% to a $1,587 annual average by year-end 2026, driven by declining auto theft rates and fewer severe weather events.
For drivers in high-cost states, the state-level premium differential is largely uncontrollable — short of relocating. What is controllable is the spread between carriers within the state. InsuranceRateGuard's June 2026 analysis notes that 'the typical spread between cheapest and most expensive carrier in each market is where most of the savings opportunity actually lives.' In a $3,000+/year insurance market, a 30% spread between carriers represents $900+ in annual savings from shopping alone.
Tariffs on auto parts have pushed vehicle parts costs up roughly 18% from 2024 to 2026, according to InsuranceRateGuard's June 2026 analysis. The pass-through mechanism to consumers works through two channels: directly, via higher prices for parts when repairs are needed; and indirectly, through higher insurance premiums as insurers pass on elevated claims costs. CarInsurance.com's 2026 State of Auto Insurance report notes that 'tariffs on vehicles and auto parts have had a limited immediate impact, though some cost pressure may surface later in 2026.' Insurify's Zacharia has been more direct: 'We have seen a 45% increase in repair costs' in the five years through 2026, with tariffs being a contributing factor to the acceleration in recent years.
The Iran War's oil market impact is more immediate and directly visible at the pump. WTI crude above $99 per barrel and Brent crude at approximately $104 represent a significant oil price floor driven by tanker route disruption concerns. At these crude prices and current refinery margins, retail gasoline at $4.29 is likely to remain elevated — and the May 2026 peak of $4.56 demonstrated how quickly prices can spike on supply disruption fears. The CNBC analysis published today explicitly links the gasoline component of the $5,851 figure to this environment.
For drivers making vehicle purchase decisions in this environment: the tariff-driven repair cost inflation makes reliability and parts availability an increasingly important purchasing criterion. Vehicles with simpler drivetrains, domestically sourced parts, and lower accident repair complexity are structurally cheaper to own in a high-tariff environment. For EV buyers, the calculus is complex: fuel savings are maximised by high gas prices, but EV-specific components (battery modules, specialised electronics) are disproportionately exposed to parts cost tariffs.
The forces driving those costs upward in 2026 are structural, not temporary. Insurance premiums are re-accelerating after a brief 2025 reprieve, with 32 states projected to see increases by year-end. Parts inflation — up 45% over five years — is not reversing. Gasoline at $4.29 per gallon reflects an oil market in which the Iran War has established a new price floor. Maintenance costs for increasingly complex vehicles continue to climb at twice the rate of the previous five-year period.
The actionable response to a $5,851 bill is not to accept it passively. Shopping insurance at every renewal remains the highest-leverage single action — with average savings of approximately $996 per year for drivers who compare three or more quotes. Fuel economy optimisation is free and cuts the second-largest cost component. And for buyers still in the market for a vehicle, the total cost of ownership — not the sticker price and monthly payment — is the figure that determines the true affordability of any car. The $5,851 is not a surprise hidden in the fine print. It is the real cost of driving in America in 2026.
The $5,851 figure comes from an analysis by Insurify, the insurance comparison platform, published today — September 14, 2026 — and reported by CNBC. It represents the average annual cost of car ownership in the United States beyond the auto loan payment. The figure breaks down into three components: $2,237 in full-coverage auto insurance (Insurify's own premium data for H1 2026), $2,126 in gasoline costs (based on AAA estimates), and $1,488 in maintenance and repair costs (based on AAA estimates). The analysis was conducted by Julia Taliesin, economic analyst at Insurify. It does not include the loan payment itself, vehicle depreciation, registration fees, or parking — making it a floor for car ownership costs, not a ceiling.
What is the total monthly cost of owning a car in 2026?
For the average new-car owner, the monthly cash outflow is approximately $1,257 per month: $770 average monthly loan payment (Experian Q1 2026) plus $487.58 from the $5,851 annual running cost (insurance, fuel, maintenance). Add depreciation — typically $3,000 to $5,000 in year one for a new vehicle, or $250 to $417 per month — and the economic cost approaches $1,507 to $1,674 per month. AAA's 2025 Your Driving Costs study places the all-in average annual cost of a new vehicle at $11,577 ($965/month), which includes depreciation, financing, insurance, taxes, fees, fuel, and maintenance. Veredictor's 2026 five-year total cost of ownership estimate is $80,238, or approximately $16,048 per year ($1,337/month) before loan interest.
Why is car insurance so expensive in 2026?
Car insurance costs are elevated in 2026 due to a combination of structural factors that have been building since 2020. Vehicle repair costs have risen 45% over the past five years, compared with 14% in the previous five-year period (BLS data, Insurify August 2026). Vehicle parts costs rose roughly 18% from 2024 to 2026, partly due to tariff policy on imported components. The average insurance claim now costs approximately $13,000 — a 10% increase from 2024 (AM Best, ValuePenguin June 2026). Severe weather events continue to drive claims in high-exposure states. After premiums fell 6% in 2025 — briefly offering relief — Insurify projects a 1% rise in 2026, with 32 states expected to see increases by year-end. CarInsurance.com places the 2026 average full-coverage premium at $2,578, up from $2,513 in 2025. The Insurify H1 2026 figure used in the CNBC analysis published today is $2,237 for full coverage.
Are EVs actually cheaper to own than gas cars in 2026?
On running costs — fuel, maintenance, and insurance combined — EVs offer a modest annual advantage. Insurify's analysis (published today, September 14, 2026) finds EV drivers spend approximately $447 less per year on ongoing running costs than gas-powered vehicle drivers. This net figure reflects: $1,316 annual fuel saving (net of average state EV surcharge) minus higher EV insurance premiums (18% more expensive than gas-powered equivalents in 2026, per ValuePenguin, down from 23% in 2025). The fuel saving is near its most compelling in years due to gasoline at $4.29 per gallon today. However, EV repair costs when damaged are substantially higher: the typical EV repair costs $6,042 versus $4,902 for a gas-powered vehicle (Mitchell Q1 2026), a 23% premium. For the purchase decision, the upfront cost of a new EV and the availability of charging infrastructure remain significant factors that vary by geography. The $447 annual running cost advantage is real but modest relative to the typical new vehicle's total cost.
What are the most and least expensive states for car insurance in 2026?
Washington D.C. remains the most expensive market for full-coverage car insurance at $3,955/year average (down 7% in H1 2026 but still the national high), according to Insurify's August 2026 data. Among the 50 states, Nevada, Louisiana, Florida, Connecticut, and Delaware are the five most expensive, all averaging over $300/month for full coverage (ValuePenguin, June 2026). Connecticut faces the sharpest projected increase in 2026 at +15% year-over-year, driven by high collision repair costs — the average Connecticut collision claim costs approximately $7,285. New Mexico is the notable cheapest major market, projected to average $1,587 for full coverage by year-end 2026 (down 8% year-over-year). Vermont is among the nationally cheapest at approximately $124/month ($1,488/year). The spread between most expensive and least expensive states — over $2,400/year — is larger than the entire gasoline or maintenance component of Insurify's $5,851 annual figure.
What is the current average gas price and how does it affect car ownership costs?
As of September 14, 2026 — today — the national average price of regular unleaded gasoline is $4.29 per gallon, according to AAA, cited in the CNBC analysis published this morning. This is down from the 2026 high of $4.56 per gallon in May 2026, and dramatically below the $5.01 per gallon peak of mid-2022. However, it remains 56% higher than the July 2019 average of $2.75 per gallon. The current price reflects the Iran War's impact on oil markets: WTI crude has been trading above $99 per barrel (reaching over $102 last week), and Brent crude trades around $104. At $4.29 per gallon, gasoline is the second-largest component of the $5,851 annual running cost at $2,126. Each $0.25 rise in the per-gallon price adds approximately $110 to $150 in annual fuel costs for a driver covering 14,000 to 15,000 miles per year at 30 mpg.
Table of Contents
- The Bill Most Drivers Never See
- The Insurify Finding: $5,851 a Year Beyond Your Loan Payment
- Component 1 — Auto Insurance: $2,237 and Rising Again
- Component 2 — Gasoline: $2,126 at $4.29 a Gallon
- Component 3 — Maintenance and Repairs: $1,488 and Climbing
- The Loan Payment Layer: What You Owe Before Running Costs
- The Full Picture: AAA's All-In Cost Including Depreciation
- Who Pays the Most — and the Least
- EVs vs. Gas: Is an Electric Car Actually Cheaper to Run?
- Five Strategies to Reduce Your Total Car Ownership Cost
- The State-by-State Insurance Gap You Need to Know About
- What Tariffs and the Iran War Are Doing to Your Car Costs
- Conclusion: The $5,851 Wake-Up Call
- Frequently Asked Questions
Annual Cost Breakdown: What The $5,851 Contains
Total Cash Out: Loan + Running Costs By Vehicle Type
EV vs Gas: Running Cost Comparison 2026
The Bill Most Drivers Never See
Ask most drivers what their car costs them each month and they'll quote their loan payment. Ask what the car costs them each year and the number gets blurry. The monthly loan payment is visible, predictable, and impossible to ignore. The insurance renewal, the fill-up at the pump, the brake job, the registration fee, the annual inspection — these arrive separately, feel routine, and rarely get totalled up.Insurify, the insurance comparison platform, has totalled them up. Their analysis, published today — September 14, 2026 — and reported by CNBC, finds that U.S. drivers spend an average of $5,851 per year on car ownership costs beyond their auto loan payments. That is $487.58 every month in insurance, fuel, and maintenance alone. For a driver paying the average $770 monthly payment on a new car, the true monthly outlay exceeds $1,257 before depreciation is even considered.
This is not a marginal add-on. It is a second, near-invisible car payment — and it has been driven sharply higher by the same forces reshaping household finances in 2026: insurance premiums re-accelerating after a brief 2025 reprieve, gasoline prices up 56% from 2019 levels amid the ongoing Iran War's impact on oil markets, and maintenance costs swollen by parts inflation and the rising complexity of modern vehicles. This guide dissects each component, quantifies who pays the most and the least, and identifies the specific actions that meaningfully reduce the total.
$5,851/year = average annual car ownership costs beyond loan payments (Insurify analysis, September 14, 2026, reported by CNBC today). Breakdown: $2,237 full-coverage insurance + $2,126 gasoline + $1,488 maintenance/repairs. On top of: average new car loan payment $770/month (Experian Q1 2026); average used car payment $531/month. New car prices averaging $49,855 (Kelley Blue Book, July 2026). Gas: $4.29/gallon national average today (AAA). Insurance up ~50% since July 2019 (BLS).
The Insurify Finding: $5,851 a Year Beyond Your Loan Payment
The $5,851 figure comes from Insurify's analysis combining their own insurance-quote data with AAA estimates for gasoline and maintenance costs. Julia Taliesin, economic analyst at Insurify, notes that insurance premiums were pushed up partly by inflation-driven increases in vehicle repair costs — a feedback loop between what mechanics charge, what insurers pay out in claims, and what they then charge in premiums.The analysis is explicit about what the $5,851 does and does not include. It covers insurance, fuel, and maintenance. It does not include the loan payment itself, depreciation (the largest single cost of vehicle ownership for most drivers), registration fees, or parking. It is, in other words, the floor — the minimum ongoing cost before the largest expenses are counted.
For context: the average new car monthly payment in Q1 2026 was $770, according to Experian — up 2.9% from Q1 2025. Adding the $487.58 monthly ownership cost from Insurify's figure brings the average new-car driver's total monthly cash outlay to $1,257.58, or $15,090 per year in out-of-pocket cash — before depreciation, which for a new vehicle typically runs $3,000 to $5,000 in year one alone.
Annual car costs for a typical new-car owner (September 2026 averages). Loan payment: $770/month × 12 = $9,240/year. Insurance (full coverage, Insurify H1 2026): $2,237/year. Gasoline (Insurify/AAA estimate): $2,126/year. Maintenance/repairs (Insurify/AAA estimate): $1,488/year. Total annual cash outflow: $15,091/year ($1,257/month). Add first-year depreciation (typical new vehicle, AAA 2025 Driving Costs study basis): approximately $4,000–$6,000. All-in year-one economic cost: approximately $19,000–$21,000. Note: these are national averages. Actual costs vary by location, vehicle type, credit score, and driving habits. Not financial advice.
Component 1 — Auto Insurance: $2,237 and Rising Again
Insurance is the single largest component of the $5,851 figure at $2,237 per year for full coverage — a number drawn from Insurify's own premium data for the first half of 2026. This represents a 1% rise from the prior year, meaning that after a meaningful 6% fall in 2025 (when the average driver paid $140 less than in 2024), premiums are climbing again in 2026.The re-acceleration matters because the 2025 premium decline created a perception that the insurance crisis was over. Insurify CEO Snejina Zacharia, in an exclusive interview with Fox Business, put the reality plainly: 'Unfortunately, this year, a majority of the states are trending up. The severity of weather conditions and the severity of accidents have continued to be very strong. On top of that, we have seen a 45% increase in repair costs.' That 45% figure — from Bureau of Labor Statistics data on national auto maintenance and repair costs over the past five years, compared with just 14% in the previous five-year period — is the structural driver beneath every insurance renewal.
Other sources reflect similar totals. CarInsurance.com estimates full-coverage premiums at $2,578 for 2026, up from $2,513 in 2025, noting that 'premiums remain historically high due to elevated repair costs, more severe claims and ongoing weather-related losses.' The average insurance claim now costs approximately $13,000 — a 10% increase from 2024 — according to AM Best data cited by ValuePenguin. Insurers recovering from years of elevated losses are re-pricing accordingly.
The tariff dimension compounds the problem: vehicle parts costs rose roughly 18% from 2024 to 2026, partly due to tariff policy on imported components. A bumper replacement that cost $850 in parts in 2024 now runs $1,000 to $1,100, according to InsuranceRateGuard's June 2026 analysis. Auto body labour rates climbed approximately 9% over the same period. Insurers absorb these costs in claims — and recover them in premiums.
32 states are on track to see insurance rate increases by the end of 2026, according to Insurify's August 2026 report. The sharpest predicted increase is Connecticut at +15% year-over-year. Most expensive state currently: Washington D.C. at $3,955/year average full coverage (down 7% H1 2026, but still the nation's highest). Most expensive states for full coverage per ValuePenguin: Nevada, Louisiana, Florida, Connecticut, Delaware — all averaging over $300/month.
Component 2 — Gasoline: $2,126 at $4.29 a Gallon
The second-largest component at $2,126 per year reflects a gasoline cost environment that has been volatile and, by historical standards, expensive throughout 2026. The national average price of a gallon of regular unleaded gasoline stood at $4.29 on September 14, 2026, according to AAA — the same publication date as the Insurify report. This figure is down from the 2026 high of $4.56 per gallon in May 2026, and far below the $5.01 per gallon peak hit in mid-2022. But it is 56% higher than the $2.75 per gallon average in July 2019, according to GasBuddy.The primary driver of 2026 gasoline prices is the ongoing Iran War. U.S. West Texas Intermediate oil futures climbed above $102 per barrel last week before easing to approximately $99 on Friday, while Brent crude futures traded around $104 per barrel, reflecting heightened concern that the conflict will be prolonged and further restrict the ability of oil tankers in the Middle East to reach global markets.
For a driver covering the national average of approximately 14,000 to 15,000 miles per year in a vehicle achieving 25 to 30 miles per gallon, the fuel math at $4.29 per gallon works out to approximately $2,000 to $2,580 annually — closely aligned with the Insurify $2,126 estimate. The figure is highly sensitive to gas prices: at the May 2026 peak of $4.56, the same driver would have spent roughly $2,130 to $2,736 annually on fuel, a meaningful jump that is invisible in the monthly budget until the year-end total is calculated.
The $2,126 gasoline component could fall by approximately $1,442 for EV drivers — or $1,316 after accounting for the average state EV surcharge imposed to offset lost gasoline tax revenue — according to Insurify's 2026 EV analysis published in the same report. The Iran War-driven fuel price spike appears to be accelerating EV adoption: used EV sales jumped 54% month-over-month in the first month of the conflict (Cox EV Market Monitor, March 2026). For drivers in the market for a used vehicle, the EV economics on running costs are increasingly compelling — with important caveats discussed in Section 9.
Component 3 — Maintenance and Repairs: $1,488 and Climbing
The third and smallest component of Insurify's $5,851 figure is maintenance and repairs at $1,488 per year — based on AAA maintenance cost estimates incorporated into the analysis. This figure covers routine upkeep: oil changes, tyre rotations, brake inspections, air filters, and the periodic component replacements that accumulate across a vehicle's life. It does not cover major unplanned repairs — a blown transmission, a failed turbocharger, or the accident damage that tips over into insurance claims territory.The $1,488 figure has been climbing rapidly. National auto maintenance and repair costs have risen 45% over the past five years, compared with just 14% in the preceding five-year period, according to Bureau of Labor Statistics data cited in Insurify's August 2026 report. The primary drivers are parts cost inflation (exacerbated by tariffs on imported components), labour rate increases for increasingly specialised automotive technicians, and the growing complexity of modern vehicles — particularly the integration of driver-assistance technology and electronic systems that require specialised diagnostic equipment.
AAA's 2025 Your Driving Costs study provides the most comprehensive annual benchmark: for a new vehicle driven 75,000 miles over five years, the average ownership cost is $11,577 annually — approximately $965 per month — including depreciation, financing, insurance, taxes, fees, fuel, and maintenance. The maintenance component within that figure runs approximately $1,300 per year for a new vehicle, rising as the vehicle ages and warranty coverage expires.
Insurify's own car maintenance cost data (updated July 31, 2026) puts average maintenance at $792 per year, or $66 per month — somewhat lower than the $1,488 figure in the CNBC/Insurify analysis published today, suggesting the published figure may incorporate a broader definition of routine plus minor unplanned repairs, or reflects 2026 cost escalation beyond the July maintenance data.
The Loan Payment Layer: What You Owe Before Running Costs
The $5,851 figure is explicitly framed as a cost on top of monthly auto loan payments — and those payments have reached record levels. Experian's State of the Automotive Finance Market for Q1 2026, the most recent comprehensive data, shows the average monthly payment for new vehicles reached $770, up 2.9% from Q1 2025. The average payment for used vehicles was $531 (up 1.5%), and for leased vehicles $619 (up 3.2%).The underlying loan amounts explain why payments are at record levels. The average new vehicle loan amount in Q1 2026 was $43,925, up from $42,582 at the end of 2025. The average used vehicle loan was $27,070. Kelley Blue Book data cited in today's CNBC analysis puts the average transaction price for a new car at $49,855 in July 2026 — approximately 34% higher than July 2019. The average used car list price from Cox Automotive was $27,028 in the same month, about 29% above 2019 levels, compared with overall inflation of approximately 30% since that period.
New car payments over $1,000 per month now account for 18.91% of all new car loans, according to LendingTree and Experian data. Banks remain the most common source of auto financing at 28.42% of loans, followed by captive finance companies (26.83%) and credit unions (20.09%). Auto loan debt is the second-largest category of consumer debt in the United States after mortgages — a structural position that makes the $5,851 running cost figure even more significant, as it falls on top of an already substantial debt load.
Sources: Experian State of the Automotive Finance Market Q1 2026 (cited LendingTree June 2026, Bankrate August 2026, Yahoo Finance August 2026); Insurify analysis September 14, 2026. Not financial advice. Excludes depreciation, registration, parking, and tolls.
The Full Picture: AAA's All-In Cost Including Depreciation
Insurify's $5,851 deliberately excludes depreciation — the largest single cost of vehicle ownership for most drivers — to focus on the out-of-pocket running costs that sit on top of the loan. But any complete accounting of what a car actually costs must include depreciation: the portion of the vehicle's value consumed each year simply by the passage of time and accumulation of miles.AAA's 2025 Your Driving Costs study — the most authoritative annual benchmark for total vehicle ownership cost — places the average annual ownership cost for a new vehicle driven 75,000 miles over five years at $11,577, or approximately $965 per month. This figure incorporates depreciation, financing costs, insurance, taxes and fees, fuel, and maintenance. It declined $719 from the prior year's study as vehicle prices eased somewhat, but it remains substantially elevated relative to pre-pandemic benchmarks.
A third data point, from Veredictor's 2026 Total Cost of Ownership Reference — a deep-dive analysis incorporating depreciation, fuel, electricity, maintenance, insurance, and registration across different vehicle types — places the 2026 US industry-average five-year cost to own at $80,238, or approximately $16,048 per year, or $1,337 per month. This figure, which includes depreciation and all running costs but excludes loan interest (which depends on the buyer's rate and down payment), represents the comprehensive economic cost of vehicle ownership for the average American driver in 2026.
The difference between the Insurify $5,851 (running costs only, excluding loan), the AAA $11,577 (all-in including depreciation and financing), and the Veredictor $16,048 (five-year average including depreciation) is largely explained by depreciation. A new $49,855 car (Kelley Blue Book July 2026 average) loses approximately 15–25% of its value in the first year — $7,478 to $12,464 in economic value disappearing regardless of whether the driver makes loan payments or not. This is the hidden cost that makes 'buying outright' still expensive, and that makes used cars so financially compelling from a total-cost perspective.
Who Pays the Most — and the Least
The $5,851 national average masks very wide geographic and demographic variation. Where you live determines your insurance premium more than almost any other factor. What you drive determines your fuel costs and repair costs. Your credit score determines your loan rate, which compounds through the total payment. And your driving habits — annual mileage, highway versus city driving — determine your fuel and maintenance consumption.
EVs vs. Gas: Is an Electric Car Actually Cheaper to Run?
The Insurify analysis published today includes a direct EV comparison, and the headline finding will surprise drivers who assume EVs are always cheaper to run. The picture is mixed in a way that depends heavily on which cost component you are measuring and what happens if you have an accident.On fuel alone, the EV advantage is substantial. Insurify calculates that the typical EV driver spends $1,442 less annually on fuelling than a comparable gas-powered vehicle driver — reduced to $1,316 once the average state EV surcharge is included. These surcharges, imposed in most states to replace lost gasoline tax revenue, partially offset the fuel savings but leave a meaningful net advantage. With gasoline at $4.29 per gallon today and WTI crude above $99 per barrel amid Iran War concerns, the fuel saving from an EV is near its most compelling level in years. This explains the 54% month-over-month surge in used EV sales in the first month of the Iran War (Cox EV Market Monitor, March 2026).
Combining insurance, maintenance, and fuel, EV drivers spend approximately $447 less annually than gas-powered vehicle drivers, according to Insurify's 2026 analysis. This is the total net running cost advantage of an EV — meaningful, but smaller than the fuel saving alone because EV insurance costs more (18% more expensive than equivalent gas-powered coverage, per ValuePenguin, narrowed from 23% in 2025) and EV maintenance is less predictable for high-value repairs.
The EV repair cost figure deserves careful attention. When damaged — whether in an accident or from road debris — the typical EV repair costs $6,042, which is 23% more than the typical gas-powered car repair of $4,902, according to Mitchell's Q1 2026 Plugged-In EV Collision Insights report. This higher repair cost is one reason EV insurance is more expensive. For drivers who are accident-prone or live in high-theft or severe-weather areas, the $447 annual running cost advantage could be partially or fully consumed by higher insurance premiums and out-of-pocket repair exposure. EVs can also become significantly more costly if battery damage is involved — a consideration not captured in the Insurify $447 figure.
Five Strategies to Reduce Your Total Car Ownership Cost
- Shop your insurance every renewal — and mid-term. The gap between the cheapest and most expensive insurer for identical coverage on the same driver can exceed $1,000 per year. CarEdge users save an average of $996 per year by comparing rates. Insurify's own data shows that 10% of drivers cut costs by switching insurers. The easiest single action to reduce the $5,851 total is to request competing insurance quotes at every renewal — and to do it even if last year's rate was acceptable, since 32 states are projected to see increases by the end of 2026.
- Raise your insurance deductible strategically. Moving from a $500 to a $1,000 deductible typically reduces full-coverage premiums by 10–15%. For drivers with a clean record and adequate emergency savings to cover the higher deductible, this is a direct premium reduction. The trade-off: higher out-of-pocket exposure on a claim. Do not lower coverage limits to the legal minimum unless the vehicle's actual cash value is low enough that full coverage no longer makes financial sense.
- Optimise fuel consumption through driving behaviour. The difference between aggressive and smooth driving on identical routes can affect fuel economy by 15–30%. At $4.29 per gallon, a driver who improves average fuel economy from 25 mpg to 30 mpg on 15,000 annual miles reduces annual fuel spend from approximately $2,574 to $2,145 — a $429 annual saving that costs nothing beyond habit change. Tyre pressure maintenance (under-inflated tyres reduce fuel economy by up to 3% per PSI), regular air filter replacement, and removing unnecessary weight from the vehicle all contribute additional marginal savings.
- Follow the manufacturer's maintenance schedule — no more, no less. The AAA and Insurify maintenance figures are based on manufacturer-recommended service intervals. Dealer upselling can inflate maintenance costs well beyond what the vehicle's own service manual specifies. Bring the owner's manual to every service visit and ask specifically what the manufacturer recommends at that mileage interval. Conversely, skipping scheduled maintenance to save money in the short term typically produces much higher repair costs later — a false economy on a cost that is already $1,488 per year.
- Consider the total cost of ownership before purchasing. The $5,851 running cost applies to whatever vehicle you drive — but it is not uniform. A vehicle with above-average insurance ratings (driven by theft risk, accident frequency data, and repair costs), poor fuel economy, or a historically poor reliability record will cost substantially more than the average. Resources such as the AAA Vehicle Reliability Ratings, Consumer Reports reliability data, and Insurify's own vehicle-specific insurance quote tool allow buyers to estimate the full running cost of a specific vehicle before purchase — not after.
The State-by-State Insurance Gap You Need to Know About
Auto insurance is regulated at the state level, and the variation between states is extraordinary. In Vermont — the cheapest state for full coverage — the average premium runs approximately $124 per month, or $1,488 per year. In Washington D.C. — the most expensive — the average full-coverage premium is $3,955 per year, or $330 per month. The gap between cheapest and most expensive is $2,467 per year for an identical driver and vehicle.The forces driving state-specific insurance costs include: mandatory minimum coverage requirements (which vary enormously); population density and traffic accident frequency; weather patterns (hail, flooding, hurricane exposure); uninsured motorist rates; the speed at which state regulators approve insurer rate filings; and claims litigation environments. Florida is expensive partly because of its no-fault insurance system and high rate of uninsured drivers. Louisiana's costs reflect its litigation culture and severe weather exposure. Connecticut's 2026 spike is driven by exceptionally high collision repair costs — the average collision claim in Connecticut costs approximately $7,285, one of the highest figures nationally.
The Insurify August 2026 report projects that by year-end 2026, 32 states will have seen net insurance cost increases. The sharpest predicted rise is Connecticut at +15% year-over-year. New Mexico is the notable outlier in the other direction: rates are projected to fall 8% to a $1,587 annual average by year-end 2026, driven by declining auto theft rates and fewer severe weather events.
For drivers in high-cost states, the state-level premium differential is largely uncontrollable — short of relocating. What is controllable is the spread between carriers within the state. InsuranceRateGuard's June 2026 analysis notes that 'the typical spread between cheapest and most expensive carrier in each market is where most of the savings opportunity actually lives.' In a $3,000+/year insurance market, a 30% spread between carriers represents $900+ in annual savings from shopping alone.
What Tariffs and the Iran War Are Doing to Your Car Costs
Two external forces are reshaping car ownership costs in 2026 in ways that are not yet fully reflected in the averages: import tariffs on vehicles and auto parts, and the Iran War's impact on oil prices and supply chains.Tariffs on auto parts have pushed vehicle parts costs up roughly 18% from 2024 to 2026, according to InsuranceRateGuard's June 2026 analysis. The pass-through mechanism to consumers works through two channels: directly, via higher prices for parts when repairs are needed; and indirectly, through higher insurance premiums as insurers pass on elevated claims costs. CarInsurance.com's 2026 State of Auto Insurance report notes that 'tariffs on vehicles and auto parts have had a limited immediate impact, though some cost pressure may surface later in 2026.' Insurify's Zacharia has been more direct: 'We have seen a 45% increase in repair costs' in the five years through 2026, with tariffs being a contributing factor to the acceleration in recent years.
The Iran War's oil market impact is more immediate and directly visible at the pump. WTI crude above $99 per barrel and Brent crude at approximately $104 represent a significant oil price floor driven by tanker route disruption concerns. At these crude prices and current refinery margins, retail gasoline at $4.29 is likely to remain elevated — and the May 2026 peak of $4.56 demonstrated how quickly prices can spike on supply disruption fears. The CNBC analysis published today explicitly links the gasoline component of the $5,851 figure to this environment.
For drivers making vehicle purchase decisions in this environment: the tariff-driven repair cost inflation makes reliability and parts availability an increasingly important purchasing criterion. Vehicles with simpler drivetrains, domestically sourced parts, and lower accident repair complexity are structurally cheaper to own in a high-tariff environment. For EV buyers, the calculus is complex: fuel savings are maximised by high gas prices, but EV-specific components (battery modules, specialised electronics) are disproportionately exposed to parts cost tariffs.
Conclusion
The Insurify analysis published today delivers a figure that most drivers have never calculated for themselves: $5,851 per year in insurance, gasoline, and maintenance costs — before a single dollar of loan payment, depreciation, registration, or parking. For the average new-car buyer making $770 monthly loan payments, the true annual cash outflow exceeds $15,000. For a driver who adds AAA's depreciation estimate to that total, the economic cost of owning a new car exceeds $19,000 to $21,000 in year one.The forces driving those costs upward in 2026 are structural, not temporary. Insurance premiums are re-accelerating after a brief 2025 reprieve, with 32 states projected to see increases by year-end. Parts inflation — up 45% over five years — is not reversing. Gasoline at $4.29 per gallon reflects an oil market in which the Iran War has established a new price floor. Maintenance costs for increasingly complex vehicles continue to climb at twice the rate of the previous five-year period.
The actionable response to a $5,851 bill is not to accept it passively. Shopping insurance at every renewal remains the highest-leverage single action — with average savings of approximately $996 per year for drivers who compare three or more quotes. Fuel economy optimisation is free and cuts the second-largest cost component. And for buyers still in the market for a vehicle, the total cost of ownership — not the sticker price and monthly payment — is the figure that determines the true affordability of any car. The $5,851 is not a surprise hidden in the fine print. It is the real cost of driving in America in 2026.
Frequently Asked Questions
What is the $5,851 car ownership figure and where does it come from?The $5,851 figure comes from an analysis by Insurify, the insurance comparison platform, published today — September 14, 2026 — and reported by CNBC. It represents the average annual cost of car ownership in the United States beyond the auto loan payment. The figure breaks down into three components: $2,237 in full-coverage auto insurance (Insurify's own premium data for H1 2026), $2,126 in gasoline costs (based on AAA estimates), and $1,488 in maintenance and repair costs (based on AAA estimates). The analysis was conducted by Julia Taliesin, economic analyst at Insurify. It does not include the loan payment itself, vehicle depreciation, registration fees, or parking — making it a floor for car ownership costs, not a ceiling.
What is the total monthly cost of owning a car in 2026?
For the average new-car owner, the monthly cash outflow is approximately $1,257 per month: $770 average monthly loan payment (Experian Q1 2026) plus $487.58 from the $5,851 annual running cost (insurance, fuel, maintenance). Add depreciation — typically $3,000 to $5,000 in year one for a new vehicle, or $250 to $417 per month — and the economic cost approaches $1,507 to $1,674 per month. AAA's 2025 Your Driving Costs study places the all-in average annual cost of a new vehicle at $11,577 ($965/month), which includes depreciation, financing, insurance, taxes, fees, fuel, and maintenance. Veredictor's 2026 five-year total cost of ownership estimate is $80,238, or approximately $16,048 per year ($1,337/month) before loan interest.
Why is car insurance so expensive in 2026?
Car insurance costs are elevated in 2026 due to a combination of structural factors that have been building since 2020. Vehicle repair costs have risen 45% over the past five years, compared with 14% in the previous five-year period (BLS data, Insurify August 2026). Vehicle parts costs rose roughly 18% from 2024 to 2026, partly due to tariff policy on imported components. The average insurance claim now costs approximately $13,000 — a 10% increase from 2024 (AM Best, ValuePenguin June 2026). Severe weather events continue to drive claims in high-exposure states. After premiums fell 6% in 2025 — briefly offering relief — Insurify projects a 1% rise in 2026, with 32 states expected to see increases by year-end. CarInsurance.com places the 2026 average full-coverage premium at $2,578, up from $2,513 in 2025. The Insurify H1 2026 figure used in the CNBC analysis published today is $2,237 for full coverage.
Are EVs actually cheaper to own than gas cars in 2026?
On running costs — fuel, maintenance, and insurance combined — EVs offer a modest annual advantage. Insurify's analysis (published today, September 14, 2026) finds EV drivers spend approximately $447 less per year on ongoing running costs than gas-powered vehicle drivers. This net figure reflects: $1,316 annual fuel saving (net of average state EV surcharge) minus higher EV insurance premiums (18% more expensive than gas-powered equivalents in 2026, per ValuePenguin, down from 23% in 2025). The fuel saving is near its most compelling in years due to gasoline at $4.29 per gallon today. However, EV repair costs when damaged are substantially higher: the typical EV repair costs $6,042 versus $4,902 for a gas-powered vehicle (Mitchell Q1 2026), a 23% premium. For the purchase decision, the upfront cost of a new EV and the availability of charging infrastructure remain significant factors that vary by geography. The $447 annual running cost advantage is real but modest relative to the typical new vehicle's total cost.
What are the most and least expensive states for car insurance in 2026?
Washington D.C. remains the most expensive market for full-coverage car insurance at $3,955/year average (down 7% in H1 2026 but still the national high), according to Insurify's August 2026 data. Among the 50 states, Nevada, Louisiana, Florida, Connecticut, and Delaware are the five most expensive, all averaging over $300/month for full coverage (ValuePenguin, June 2026). Connecticut faces the sharpest projected increase in 2026 at +15% year-over-year, driven by high collision repair costs — the average Connecticut collision claim costs approximately $7,285. New Mexico is the notable cheapest major market, projected to average $1,587 for full coverage by year-end 2026 (down 8% year-over-year). Vermont is among the nationally cheapest at approximately $124/month ($1,488/year). The spread between most expensive and least expensive states — over $2,400/year — is larger than the entire gasoline or maintenance component of Insurify's $5,851 annual figure.
What is the current average gas price and how does it affect car ownership costs?
As of September 14, 2026 — today — the national average price of regular unleaded gasoline is $4.29 per gallon, according to AAA, cited in the CNBC analysis published this morning. This is down from the 2026 high of $4.56 per gallon in May 2026, and dramatically below the $5.01 per gallon peak of mid-2022. However, it remains 56% higher than the July 2019 average of $2.75 per gallon. The current price reflects the Iran War's impact on oil markets: WTI crude has been trading above $99 per barrel (reaching over $102 last week), and Brent crude trades around $104. At $4.29 per gallon, gasoline is the second-largest component of the $5,851 annual running cost at $2,126. Each $0.25 rise in the per-gallon price adds approximately $110 to $150 in annual fuel costs for a driver covering 14,000 to 15,000 miles per year at 30 mpg.

0 Comments Comments