
Knowledge
History Says This Is What the Nasdaq Does After the Midterms

Political uncertainty has been a source of volatility for stocks lately, and a striking historical trend may hint at what comes next. Nasdaq up 12 of 13 times, average +25.7%, median +19.6% (1974-2022); S&P 500 average +13.4%; Nasdaq Composite -5.52% on 5 Nov 2026.
Historically, the Nasdaq has done well in the year after a midterm election. One analysis of the 13 midterms since 1974 found the Nasdaq Composite higher 12 months later 12 times, with an average gain of 25.7% and a median of 19.6%, measured from the last close before election day. That is the "striking historical trend" in the headline. But 2026 has already complicated the story. The Nasdaq rose after the vote, then fell 5.52% on 5 November, two days after election day. So the honest answer is: history leans positive, the sample is small, and this year's early days have been rough.
In this post I walk through the Nasdaq record, the broader S&P 500 data, the reasons people give for the pattern, and what it can and cannot tell you.
Key takeaway: The post-midterm pattern is real in the data, but it is a tendency measured on a small sample, not a promise. A rough first month does not rule it out, and a good record does not rule out another drop.
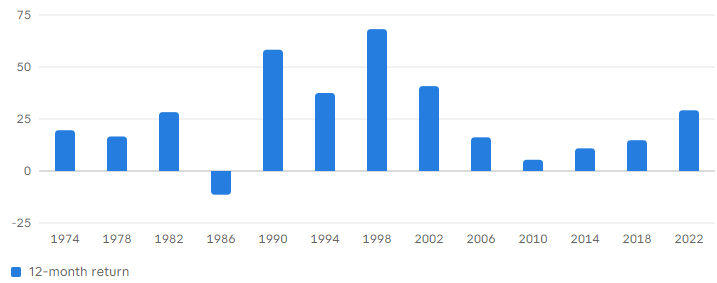
The summary figures are an average of +25.7% and a median of +19.6%, with the Nasdaq higher in 12 of 13 cycles. The best case was 1998 at +68.2%. The only losing case was 1986 at -11.4%, which the page attributes to the October 1987 crash. Notice how wide the range is. The gains run from +5.4% in 2010 to +68.2% in 1998. The average is pulled up by a few huge years, which is why the median of +19.6% is the safer number to remember. Even so, a typical result near +20% is well above what many investors expect in an ordinary year. I could not verify this table against a second independent source, so treat the exact figures as one analyst's calculation, not an official index statistic.
My reading, and it is only my inference, is that the Nasdaq's edge reflects its growth-stock tilt. Growth shares tend to benefit most when uncertainty fades and risk appetite returns. That same tilt is a double-edged sword when sentiment turns, as November 2026 showed.
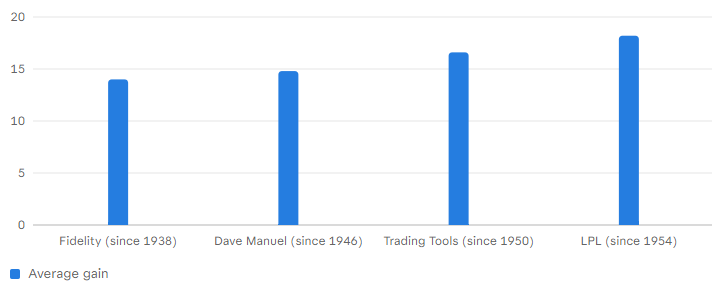
The averages differ, from about 14% to 18%, because the sources use different start dates, price versus total return, and different sets of years. That is a good reminder to read the fine print. The direction is consistent, though: positive nearly every time. The Trading Tools also found that, measured from each midterm year's lowest close rather than from election day, the average one-year gain is 30.1%. Much of the effect, in other words, is a rebound from the year's low point, which matters for 2026 because this year did not have a deep low before the vote.
An analysis cited on Nasdaq.com looked at S&P 500 recoveries after pre-midterm pullbacks and found average gains of +5.8% at three months, +10.5% at six months and +14.8% at 12 months. Not everyone buys a neat story. StockCharts Insider tested the claim that stocks rally right after the election and called it only "half true", saying the rally is real but does not show up when most people expect it. Seasonality may also play a part, since the November to April stretch is historically strong, though that analysis says the midterm effect is not simply the best six months in disguise.
Yet 2026 broke the pattern, at least until November. Finimize says the index's biggest drop this year was only 9%, against the 18% historical average. BlackRock reported US stocks up 13% through August, the sixth-best start to a midterm year since 1926. That matters because, as noted above, much of the post-midterm gain is measured from the midterm year's low. A year without a big decline leaves less to rebound from. I would not lean too hard on that, but it is a fair reason to be a little cautious about assuming this year's rebound will match the average.
Analysts framed this as relief. A WealthManagement.com piece noted that one year after every US midterm since 1950, the S&P 500 finished higher, with an average gain of 15% per Stock Trader's Almanac editor Jeffrey Hirsch. The same article warned that a Republican White House with Democrats controlling both houses of Congress has historically been among the weaker setups for equity returns. The article's own quoted strategist added a useful reminder: what truly drives the market is earnings and interest rates.
Note one conflict in the coverage. Several outlets call it the Nasdaq's worst day since April 2025, while the Bloomberg report carried by Swissinfo says the Nasdaq 100's 6.4% fall was its worst session since March 2020. Both can be true because they measure different indexes. I have used the index named in each source. The key point for this post is that the selloff appears to have been driven by chips and the AI trade, not by the election result itself. That is my reading of the coverage, not a settled fact, and the two events happened close together. I could not find a reliable source for the Nasdaq's close on the most recent trading days, so I do not state where it stands now.
The WealthManagement.com piece, though, flags that a Republican president with a Democratic Congress has been among the weaker setups. These two views are not necessarily contradictory: gains were positive in both cases, but the size can differ.
With only about 20 midterms in the post-war record, splitting the data by party leaves very few observations in each group. LPL itself cautions that with roughly 75 observations for the S&P 500 since 1950, a single outlier year can meaningfully skew the picture. That is the heart of the matter. The party result may matter less than earnings, rates and the AI cycle, which the quoted strategist named as the real drivers.
Third, results depend on how you measure. The S&P 500 averages above range from 14% to 18% depending on source . Fourth, history cannot see the news. The record includes recessions and wars, and the pattern held, but a pattern holding before does not guarantee it will again. Finally, remember the one exception. The Nasdaq fell 11.4% after the 1986 midterm. A single failure in 13 tries is a good record, but it shows that "usually" is not "always".
Another is to think about time horizon. A tendency measured over 12 months is not much use if you need the money in six. If you are investing for decades, a month of volatility, even a 5% daily drop, is a smaller part of the picture.
A third is diversification. The 2026 selloff hit the Nasdaq harder than the Russell 2000, which was still up 10.1% for the year against 4.6% for the Nasdaq Composite. If a large share of your holdings sit in a few AI-linked names, a day like 5 November will hurt more. If you are unsure, a licensed adviser who knows your finances is better placed than any blog post, including this one.
Over the coming months, a few things are worth following. The first is earnings, particularly from chip and AI-infrastructure names, since that is where the November selloff began. The second is interest rates and the Federal Reserve, which the WealthManagement.com strategist named alongside earnings as the real market drivers. Third, watch the AI spending story. Coverage of the 5 November drop centred on questions about how fast data centres can be built and financed. Fourth, watch for policy changes that follow a divided government from January 2027, when Congress will be split from the White House. Finally, watch the first three and six months after the vote. The long-run S&P 500 numbers cited by Nasdaq.com were +5.8% at three months and +10.5% at six months, so if you want to check how 2026 is tracking, those are sensible markers. The 2026 data points are not available yet.
In one analysis, the Nasdaq Composite was higher 12 months later in 12 of 13 midterms since 1974, averaging +25.7% with a median of +19.6%.
Does the stock market always go up after midterms?
Almost always, but not strictly. The S&P 500 has risen in the year after every midterm in several datasets, but the Nasdaq fell 11.4% after 1986.
Why did the Nasdaq fall on 5 November 2026?
Coverage points to AI infrastructure worries and weak results from chip names such as Qualcomm and Micron . The Nasdaq Composite fell 5.52%.
Is the post-midterm rally a reliable trading signal?
No. The sample is small, about 75 observations for the S&P 500 per LPL, so one year can skew results, and BlackRock warns that letting politics drive investing can be costly.
Does it matter which party wins?
Evidence is mixed. LPL says stocks gained after midterms no matter who held office, while one analysis flags a Republican president with a Democratic Congress as a weaker setup.
Table of Contents
- 1. The quick answer
- 2. What the Nasdaq did after every midterm since 1974
- 3. Nasdaq vs the S&P 500
- 4. The longer S&P 500 record
- 5. Why stocks tend to rise after midterms
- 6. Why midterm years feel rough
- 7. How 2026 has played out so far
- 8. The 5 November selloff
- 9. Does a split Congress matter?
- 10. What the pattern cannot tell you
- 11. How investors can think about it
- 12. What to watch next
- 13. Conclusion
- 14. FAQ
Nasdaq Composite 12 months after each midterm (%)
% by Source: SimianX (single-source calculation)
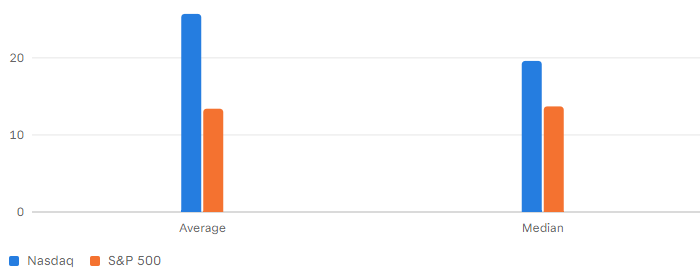
Nasdaq vs S&P 500 after midterms (%)
% by Source: SimianX, 12 months after midterms
S&P 500 average 12-month gain after midterms, by source (%)
% by Source: as named; windows differHistorically, the Nasdaq has done well in the year after a midterm election. One analysis of the 13 midterms since 1974 found the Nasdaq Composite higher 12 months later 12 times, with an average gain of 25.7% and a median of 19.6%, measured from the last close before election day. That is the "striking historical trend" in the headline. But 2026 has already complicated the story. The Nasdaq rose after the vote, then fell 5.52% on 5 November, two days after election day. So the honest answer is: history leans positive, the sample is small, and this year's early days have been rough.
In this post I walk through the Nasdaq record, the broader S&P 500 data, the reasons people give for the pattern, and what it can and cannot tell you.
Key takeaway: The post-midterm pattern is real in the data, but it is a tendency measured on a small sample, not a promise. A rough first month does not rule it out, and a good record does not rule out another drop.
What the Nasdaq did after every midterm since 1974
The most detailed Nasdaq-specific table I found comes from SimianX, which measured the Nasdaq Composite from the last close before each midterm to 12 months later. The results, by midterm year, were: 1974 +19.6%, 1978 +16.6%, 1982 +28.3%, 1986 -11.4%, 1990 +58.3%, 1994 +37.5%, 1998 +68.2%, 2002 +40.8%, 2006 +16.2%, 2010 +5.4%, 2014 +10.9%, 2018 +14.8% and 2022 +29.2%.The summary figures are an average of +25.7% and a median of +19.6%, with the Nasdaq higher in 12 of 13 cycles. The best case was 1998 at +68.2%. The only losing case was 1986 at -11.4%, which the page attributes to the October 1987 crash. Notice how wide the range is. The gains run from +5.4% in 2010 to +68.2% in 1998. The average is pulled up by a few huge years, which is why the median of +19.6% is the safer number to remember. Even so, a typical result near +20% is well above what many investors expect in an ordinary year. I could not verify this table against a second independent source, so treat the exact figures as one analyst's calculation, not an official index statistic.
Nasdaq vs the S&P 500
The Nasdaq is a more volatile, tech-heavy index, so you would expect larger swings than the S&P 500. The data bears that out. Over the same midterms, SimianX reports the S&P 500 averaged +13.4% (median +13.7%) in the 12 months afterwards, and was higher in all 12 cycles from 1978 to 2022. The Nasdaq beat the S&P 500 in 11 of those 12 cycles, by an average of 12.8 percentage points and a median of 9.5. The exception was 1986, when the Nasdaq fell 11.4% while the S&P 500 rose 1.3%. The closest contest was 2010, when the Nasdaq led by only 0.9 points. Put simply, the Nasdaq usually gave you more than the broad market after midterms, but with a wider spread of outcomes and one clear miss.My reading, and it is only my inference, is that the Nasdaq's edge reflects its growth-stock tilt. Growth shares tend to benefit most when uncertainty fades and risk appetite returns. That same tilt is a double-edged sword when sentiment turns, as November 2026 showed.
The longer S&P 500 record
The S&P 500 record is longer, which makes it a useful cross-check. Fidelity says that since 1938 the S&P 500 posted price gains in the 12 months following midterms about 95% of the time, with an average near 14%. LPL Research data shows the index positive in all 18 post-midterm periods since 1954, averaging 18.2% over the next 12 months. Dave Manuel's analysis goes back to 1946 and finds a higher S&P 500 one year after every one of 20 midterms, averaging +14.8% against +8.7% for all 12-month windows since 1946. The Trading Tools measured from 31 October to 31 October and found an average gain of 16.6% over the 19 midterms since 1950, with no losing year.The averages differ, from about 14% to 18%, because the sources use different start dates, price versus total return, and different sets of years. That is a good reminder to read the fine print. The direction is consistent, though: positive nearly every time. The Trading Tools also found that, measured from each midterm year's lowest close rather than from election day, the average one-year gain is 30.1%. Much of the effect, in other words, is a rebound from the year's low point, which matters for 2026 because this year did not have a deep low before the vote.
Why stocks tend to rise after midterms
Why would stocks rise after midterms? The most common explanation is uncertainty. Fidelity notes that the more compelling explanation for midterm-year underperformance stems from uncertainty, and one strategist quoted there says elections do not make things clear, they just get to "less unclear", which is usually enough for investors. A related argument is that the worst of the year's weakness tends to come before the vote. The Nasdaq.com explainer says the S&P 500's average 12-month return before midterms was -1.1%, compared with 8.1% for all years [20]. If much of the bad news is priced in by November, the rebound can start from a lower base.An analysis cited on Nasdaq.com looked at S&P 500 recoveries after pre-midterm pullbacks and found average gains of +5.8% at three months, +10.5% at six months and +14.8% at 12 months. Not everyone buys a neat story. StockCharts Insider tested the claim that stocks rally right after the election and called it only "half true", saying the rally is real but does not show up when most people expect it. Seasonality may also play a part, since the November to April stretch is historically strong, though that analysis says the midterm effect is not simply the best six months in disguise.
Why midterm years feel rough
Midterm years themselves have a poor reputation. LPL data shows the S&P 500 averaged just 4.6% in midterm years since 1954, the weakest of the four years in the presidential cycle. Nasdaq's Dorsey Wright puts the second year of a presidential term at an average of 3.68%, roughly half the 7.02% of year one. BlackRock says midterm-year returns have averaged 7.5%, against 12.4% in other years. Intra-year drops are common too. Finimize cites an average midterm-year drawdown of 18%, and the Motley Fool notes that of 17 midterms since 1957 the S&P 500 fell into correction territory in 12.Yet 2026 broke the pattern, at least until November. Finimize says the index's biggest drop this year was only 9%, against the 18% historical average. BlackRock reported US stocks up 13% through August, the sixth-best start to a midterm year since 1926. That matters because, as noted above, much of the post-midterm gain is measured from the midterm year's low. A year without a big decline leaves less to rebound from. I would not lean too hard on that, but it is a fair reason to be a little cautious about assuming this year's rebound will match the average.
How 2026 has played out so far
Here is what the Nasdaq Composite did around the vote, based on the SimianX figures. On 2 November it closed at 25,164.36, up 8.3% for the year but 8.8% below its 6 October record of 27,599.89. On election day, 3 November, it closed at 25,372.01. Democrats won control of both the Senate and the House, according to AP and NBC calls cited by SimianX. On 4 November the Nasdaq rose 1.4% to 25,736.51, a bigger day-after move than the median +0.18% seen in earlier midterms. Al Jazeera reported US markets rising as Democrats swept the elections, and AP reported the Dow soaring more than 1,000 points.Analysts framed this as relief. A WealthManagement.com piece noted that one year after every US midterm since 1950, the S&P 500 finished higher, with an average gain of 15% per Stock Trader's Almanac editor Jeffrey Hirsch. The same article warned that a Republican White House with Democrats controlling both houses of Congress has historically been among the weaker setups for equity returns. The article's own quoted strategist added a useful reminder: what truly drives the market is earnings and interest rates.
The 5 November selloff
Then came 5 November. According to InvestingLive, the Nasdaq Composite fell 1,421.52 points, or 5.52%, to 24,315.00, while the Nasdaq 100 fell 6.36% and the S&P 500 fell 4.35%. After that session, the Nasdaq Composite was up just 4.6% for the year, the smallest gain of the major indexes. Why? Ventura Securities points to concerns about AI infrastructure spending and possible regulatory restrictions, with Micron down about 17.5% and Qualcomm down nearly 9.5% after results showed weaker smartphone chip sales. IBTimes describes investors questioning the pace, cost and financing of the AI boom. Metir AI says it tried to separate the catalysts, including Qualcomm, Arm, Micron, memory costs and data center votes, and tested how much each could explain.Note one conflict in the coverage. Several outlets call it the Nasdaq's worst day since April 2025, while the Bloomberg report carried by Swissinfo says the Nasdaq 100's 6.4% fall was its worst session since March 2020. Both can be true because they measure different indexes. I have used the index named in each source. The key point for this post is that the selloff appears to have been driven by chips and the AI trade, not by the election result itself. That is my reading of the coverage, not a settled fact, and the two events happened close together. I could not find a reliable source for the Nasdaq's close on the most recent trading days, so I do not state where it stands now.
Does a split Congress matter?
Many investors wonder whether the outcome matters, for example Democrats winning Congress while a Republican holds the White House. LPL Research's chart of S&P 500 one-year returns after midterms colours the bars by the president's party and the headline in one of its posts is that stocks have gained a year after midterms no matter who is in office.The WealthManagement.com piece, though, flags that a Republican president with a Democratic Congress has been among the weaker setups. These two views are not necessarily contradictory: gains were positive in both cases, but the size can differ.
With only about 20 midterms in the post-war record, splitting the data by party leaves very few observations in each group. LPL itself cautions that with roughly 75 observations for the S&P 500 since 1950, a single outlier year can meaningfully skew the picture. That is the heart of the matter. The party result may matter less than earnings, rates and the AI cycle, which the quoted strategist named as the real drivers.
What the pattern cannot tell you
There are several things this history cannot tell you. First, it cannot tell you the path. A 12-month gain can include a nasty drop along the way, which is exactly what has happened this month. SimianX's table is measured from the last close before election day, so the 5 November fall sits inside the 2026 window. Second, the sample is small. There are 13 Nasdaq midterms since 1974, and the Nasdaq's makeup has changed enormously over that time. The index in 1998 or 2002 was not the AI-heavy index of 2026, so comparing them is imperfect.Third, results depend on how you measure. The S&P 500 averages above range from 14% to 18% depending on source . Fourth, history cannot see the news. The record includes recessions and wars, and the pattern held, but a pattern holding before does not guarantee it will again. Finally, remember the one exception. The Nasdaq fell 11.4% after the 1986 midterm. A single failure in 13 tries is a good record, but it shows that "usually" is not "always".
How investors can think about it
I can only offer general education here, not advice for your situation. Still, there are some sensible, widely made points. One is not to trade on the calendar alone. The Nasdaq.com piece makes the point that you want to avoid trying to time the market. BlackRock's headline takeaway is that letting politics guide investment decisions can be costlyAnother is to think about time horizon. A tendency measured over 12 months is not much use if you need the money in six. If you are investing for decades, a month of volatility, even a 5% daily drop, is a smaller part of the picture.
A third is diversification. The 2026 selloff hit the Nasdaq harder than the Russell 2000, which was still up 10.1% for the year against 4.6% for the Nasdaq Composite. If a large share of your holdings sit in a few AI-linked names, a day like 5 November will hurt more. If you are unsure, a licensed adviser who knows your finances is better placed than any blog post, including this one.
Over the coming months, a few things are worth following. The first is earnings, particularly from chip and AI-infrastructure names, since that is where the November selloff began. The second is interest rates and the Federal Reserve, which the WealthManagement.com strategist named alongside earnings as the real market drivers. Third, watch the AI spending story. Coverage of the 5 November drop centred on questions about how fast data centres can be built and financed. Fourth, watch for policy changes that follow a divided government from January 2027, when Congress will be split from the White House. Finally, watch the first three and six months after the vote. The long-run S&P 500 numbers cited by Nasdaq.com were +5.8% at three months and +10.5% at six months, so if you want to check how 2026 is tracking, those are sensible markers. The 2026 data points are not available yet.
Conclusion
Historically, the Nasdaq has been a strong performer after midterms: higher 12 months later in 12 of 13 cycles since 1974, averaging +25.7%. The S&P 500 shows a similar, longer pattern, with gains in nearly every post-midterm year. But history has not been kind in the first fortnight. The Nasdaq rose after the vote and then fell 5.52% on 5 November. That does not break the pattern, which is measured over a year, but it is a vivid reminder that averages hide bumpy paths. The sensible takeaway is balance. Treat the post-midterm record as an interesting tendency, not a trading signal. Keep your time horizon, your diversification and your own risk tolerance in view, and remember that earnings, rates and the AI cycle will probably decide more than the calendar.FAQ
What usually happens to the Nasdaq after midterm elections?In one analysis, the Nasdaq Composite was higher 12 months later in 12 of 13 midterms since 1974, averaging +25.7% with a median of +19.6%.
Does the stock market always go up after midterms?
Almost always, but not strictly. The S&P 500 has risen in the year after every midterm in several datasets, but the Nasdaq fell 11.4% after 1986.
Why did the Nasdaq fall on 5 November 2026?
Coverage points to AI infrastructure worries and weak results from chip names such as Qualcomm and Micron . The Nasdaq Composite fell 5.52%.
Is the post-midterm rally a reliable trading signal?
No. The sample is small, about 75 observations for the S&P 500 per LPL, so one year can skew results, and BlackRock warns that letting politics drive investing can be costly.
Does it matter which party wins?
Evidence is mixed. LPL says stocks gained after midterms no matter who held office, while one analysis flags a Republican president with a Democratic Congress as a weaker setup.
0 Comments
Be the first to share your thoughts on this article.