

Real Estate
Housing Affordability Crisis 2026: Data, Causes & Fixes
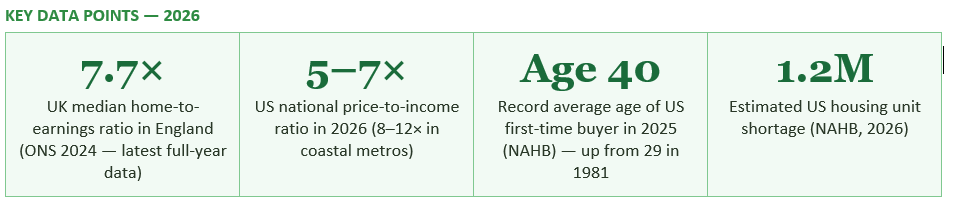
UK homes now cost 7.7 times the median income. In the US, first-time buyers have reached a record average age of 40, and their share of the market has collapsed from 44% to 21% since 1981. This is the most comprehensive picture of the housing affordability crisis in 2026 — the data, the deep causes, and the policy solutions that could actually work.
The core metric is the price-to-income ratio: how many years of gross earnings does it cost to buy a median-priced home? In 1960, the answer in both the UK and US was approximately 2 to 2.2 times annual income. By 1980 it had risen to roughly 3 times. By 2000, approximately 4.5 times. By the 2022 peak it had reached 7 times in the UK (Nationwide data) and above 5 times nationally in the US, with coastal metros at 8 to 12 times. Some easing has occurred since 2022, but ratios remain dramatically higher than any historical norm that enabled widespread homeownership.
The human consequences are visible in the demographic data. In the US, the median age of a first-time homebuyer reached a record 40 in 2025, according to the National Association of Home Builders — up from 29 in 1981. The share of first-time buyers as a proportion of all home sales has collapsed from 44% in 1981 to just 21% in 2025. Among married Americans under 30, homeownership has fallen from 52% in 1960 to just 12% today. In the UK, roughly 3.4 million 20 to 34-year-olds live with parents because they cannot afford independent housing, and the average first-time buyer in London now spends over a decade saving for a deposit.
The variation across England is stark. In Kensington and Chelsea, the least affordable local authority in the country, the price-to-income ratio stands at 27.1 — meaning a median home costs 27 years of median local earnings. At the other end, Blaenau Gwent in Wales has a ratio of 3.8, approaching historical norms for affordability. Only 9% of local authorities in England and Wales now have homes selling for less than five times median earnings — the official threshold for 'affordable' housing — the highest proportion since 2015, but still dramatically lower than the 88% that met this threshold in 1997.
The rental market has provided little relief for those locked out of ownership. Average rents across Great Britain have risen approximately 30% in four years. In Northern Ireland, rents increased 5% in the twelve months to January 2026 alone, reaching an average of £880 per month. The paradox highlighted by Economics Help is that in many parts of the UK, the monthly cost of a 25-year mortgage on a median-priced property is now lower than monthly rent for a similar property — but potential buyers cannot access the mortgage because they cannot save a deposit fast enough against rising house prices.
Even with slight improvements in affordability ratios, houses still cost close to six times the average salary in many areas. The housing crisis isn't just about expensive homes — it's a combination of several problems happening at the same time.
— UK MORTGAGE CENTRE, HOUSING CRISIS ANALYSIS, 2026
The demographic consequences are among the most striking in the data. The National Association of Home Builders reports that the share of first-time buyers in the market has fallen from 44% in 1981 to just 21% in 2025, while the median age of a first-time buyer reached a record 40 in 2025 — meaning that the typical American buying their first home in 2026 began their adult working life before the smartphone existed. Home prices have risen 53% since 2019, while median household incomes rose only 24% over the same period, according to NAHB. The affordability of homeownership for typical households is at multi-decade lows despite some improvement from the 2022 peak.
The racial dimensions of the US housing crisis compound its severity. The gap between white and Black homeownership rates is wider today than it was when the Fair Housing Act was passed in 1968 — a 28-point gap that reflects decades of redlining, predatory lending during the 2008 crisis, and ongoing appraisal disparities that continue to undervalue properties in majority-Black neighbourhoods. Among all age groups in the US, homeownership rates dropped 8 to 10 percentage points between 2000 and 2022, making this far more than a young-people problem.
In the US, NAHB estimates a shortage of approximately 1.2 million housing units nationally. Single-family housing starts are expected to reach only 940,000 in 2026 — below the rate needed to keep pace with household formation, let alone reduce the accumulated shortage. Construction has not recovered to pre-2008 levels in absolute terms, even as the population has grown substantially in the intervening period.
The undersupply problem is not new. It is the result of decades of insufficient building, exacerbated by the post-2008 financial crisis pullback in construction activity, persistent labour shortages in the construction industry (NAHB reports nearly 300,000 construction job vacancies in the US alone), rising material costs, and building safety regulatory complexity in the UK that has slowed starts.
The first impact was direct: higher rates dramatically increased the monthly cost of servicing a mortgage. A £250,000 UK mortgage at 2% costs approximately £1,060 per month. At 6%, it costs approximately £1,610 per month. Many would-be first-time buyers found that the combination of higher rates and still-elevated prices pushed their required income to qualify for a mortgage well beyond what they earned.
The second impact was the 'lock-in effect', also called the rate lock or golden handcuffs phenomenon. Homeowners who secured mortgages at 2% to 3% between 2020 and 2022 have been strongly discouraged from selling and buying a new property at 6% rates, because doing so would dramatically increase their monthly payments on the same or lower loan amount. The result has been a significant reduction in the supply of existing homes listed for sale — as the Redfin and Compass analyses confirm. In the US, inventory went from a record low 2.3 months' supply in 2021 to 4.1 months in 2025, a gradual recovery but still below the 5 to 6 months typically associated with a balanced market.
In the UK, the planning system grants local councils significant power to refuse new development. While the 2024 Labour government has introduced planning reforms designed to increase housing delivery, including restoring mandatory housing targets and updating national planning policy, the results of planning reform take years to feed through into completed homes. The green belt — land around major UK cities protected from development — has long been a target for reform advocates who argue it unnecessarily restricts supply in the areas of highest demand.
In the US, single-family zoning — laws that restrict the type of housing that can be built in most residential areas to detached single-family homes — covers the majority of residentially zoned land in most major cities. This makes it legally impossible to build the denser, more affordable housing types (apartments, townhomes, accessory dwelling units) that would be commercially viable in high-demand areas without zoning reform. The YIMBY (Yes In My Back Yard) movement has made progress in a number of US states — California, Oregon, Montana, and others have passed statewide zoning reform laws — but progress is uneven and the housing it enables takes years to be built and occupied.
The 'bank of mum and dad' has become a defining feature of first-time buyer markets in both the UK and US. In London, the average deposit required to buy a first home exceeds £100,000. For those without parental wealth to draw on, saving this sum from earned income while paying rent takes 10 to 15 years in many parts of the country. For those with wealthy parents who can contribute or gift a deposit, access to homeownership is preserved. This mechanism recycles existing property wealth into the next generation and increasingly determines who can and cannot access homeownership, independent of income or financial behaviour.
Investor and corporate ownership of residential property has also been a contributing factor, particularly in the most constrained markets. In the UK, second home ownership and buy-to-let landlordism — while subject to increasing tax disincentives including the 3% stamp duty surcharge and the removal of mortgage interest tax relief — has reduced the supply of homes available to owner-occupiers. In some US markets, large-scale institutional investors and iBuyers have purchased significant proportions of available homes, reducing supply to individual buyers and contributing to price pressure in already-constrained markets.
Homeowners insurance premiums have risen approximately 70% in the US over the past five years, driven by climate-related losses from wildfires, flooding, hurricanes, and extreme weather events. In Florida, California, and parts of the Gulf Coast, standard insurers have withdrawn from the market entirely, forcing homeowners onto expensive state-backed plans. As this guide's companion article on foreclosures examined, rising insurance costs are now a leading driver of mortgage delinquencies and foreclosures for households who secured their mortgage when insurance was affordable.
Property taxes have also risen sharply in many US markets as counties catch up with pandemic-era appreciation in assessed valuations. In the UK, while council tax is less volatile, rising energy costs, maintenance inflation, and leasehold reform complexities add to the total burden of ownership. NAHB's Robert Dietz noted that shelter costs in the US were running at a 3.6% annual rate in early 2026, outpacing overall consumer price inflation — meaning housing is still getting more expensive in real terms even as the pace of price growth has slowed.
Several converging forces are providing modest relief. Mortgage rates have fallen from their 2023 peak of above 7% in the US and above 6% in the UK to the low-to-mid 6% range in early 2026. NAHB expects US mortgage rates to remain slightly above 6% throughout 2026, with a sub-6% rate unlikely until 2027. In the UK, Capital Economics forecasts rates could fall more than previously expected in 2026. The reduction in a £250,000 UK mortgage from 6% to 3.8% has already reduced monthly payments from approximately £1,610 to £1,292 — a meaningful improvement.
Redfin's widely cited 2026 forecast predicted a 'Great Housing Reset' — a prolonged period in which income growth outpaces home price growth for the first time since the Great Recession. With US home prices expected to grow around 1% in 2026 while wages grow approximately 4%, the price-to-income ratio is slowly compressing. Compass Intelligence forecasts the US ratio falling to approximately 4.9 times by the end of 2026, from above 5 times in 2022.
However, Redfin's own economists acknowledge that even under this optimistic scenario, it would take approximately five years for the housing market to return to a 'semblance of normal' for affordability. Bankrate's analysis found that at median US income, households are still priced out of 75% of all homes on the market. The improvement is real but incremental — and for the lowest-income households, those with no family wealth, and those in the most constrained coastal markets, the crisis is not easing at any meaningful pace.
Oxford Economics' modelling for the UK suggests that boosting supply to 310,000 homes per year would bring only a 5% reduction in the baseline forecast for prices — supply alone is not a complete solution, but it is a necessary one. In the US, statewide zoning reform in California, Oregon, and Minnesota has begun to increase the pipeline of new housing, though completed homes will take years to appear at scale.
There are early signs in 2026 that affordability is marginally improving — slowly compressing price-to-income ratios, falling mortgage rates, and the beginnings of genuine planning reform in both countries. But the scale of the problem is such that the improvement will be measured in years and decades, not months. The Redfin Great Housing Reset thesis is credible but requires sustained political will to build at scale, reform planning systems, and invest in genuinely affordable housing for the households that the market will never serve at market rates. Without that commitment, the housing affordability crisis will continue to be one of the defining social and economic challenges of the 2020s and beyond.
House of Commons Library — Housing Market: Economic Indicators (updated May 2026) https://commonslibrary.parliament.uk/research-briefings/sn02820/
UK Mortgage Centre — The UK Housing Crisis Explained (2026) https://ukmc.co.uk/the-uk-housing-crisis-explained-2026/
NAHB — Impact of Affordability Challenges and Demographic Shifts on Housing Trends in 2026 (Feb 2026) https://www.nahb.org/news-and-economics/press-releases/2026/02/impact-of-affordability-challenges-and-demographic-shifts-on-housing-trends-in-2026
NAHB — 2026 Housing Outlook: Ongoing Challenges, Cautious Optimism (Feb 2026) https://www.nahb.org/news-and-economics/press-releases/2026/02/2026-housing-outlook-ongoing-challenges-cautious-optimism-and-incremental-gains
Redfin — 2026 Predictions: The Great Housing Reset (Dec 2025) https://www.redfin.com/news/housing-market-predictions-2026/
Fortune — Home Prices Out of Control: The Affordability Crisis (Apr 2026) https://fortune.com/2026/04/22/home-prices-out-of-control-affordibility-crisis/
Bankrate — Priced Out of 75% of the Market: The American Dream as Luxury (Dec 2025) https://www.bankrate.com/mortgages/american-dream-of-homeownership-turning-into-luxury/
Economics Help — UK House Price to Income Ratio and Affordability https://www.economicshelp.org/blog/5568/housing/uk-house-price-affordability/
Wealthvieu — US Homeownership Rate by Demographics 2026 https://wealthvieu.com/homeownership-rate-by-demographics/
TABLE OF CONTENTS
- The Scale of the Problem: Key Data for 2026
- UK Housing Affordability in 2026: What the Numbers Show
- US Housing Affordability in 2026: A Generation Locked Out
- Cause 1 — The Supply Shortage: Not Enough Homes Built
- Cause 2 — The Mortgage Rate and Lock-In Effect
- Cause 3 — Decades of Underbuilding and Planning Restrictions
- Cause 4 — Inequality, Investor Demand, and the Bank of Mum and Dad
- Cause 5 — Rising Costs of Ownership Beyond the Mortgage
- Is Affordability Actually Improving in 2026?
- Solutions: What Actually Works
- Conclusion
- Frequently Asked Questions
- References
The Scale of the Problem: Key Data for 2026
The housing affordability crisis is not a perception or a media narrative. It is a structural, data-confirmed reality that has been building for decades and has reached a point in 2026 where it is reshaping demographic behaviour, delaying family formation, and widening the divide between those who own property and those who do not.The core metric is the price-to-income ratio: how many years of gross earnings does it cost to buy a median-priced home? In 1960, the answer in both the UK and US was approximately 2 to 2.2 times annual income. By 1980 it had risen to roughly 3 times. By 2000, approximately 4.5 times. By the 2022 peak it had reached 7 times in the UK (Nationwide data) and above 5 times nationally in the US, with coastal metros at 8 to 12 times. Some easing has occurred since 2022, but ratios remain dramatically higher than any historical norm that enabled widespread homeownership.
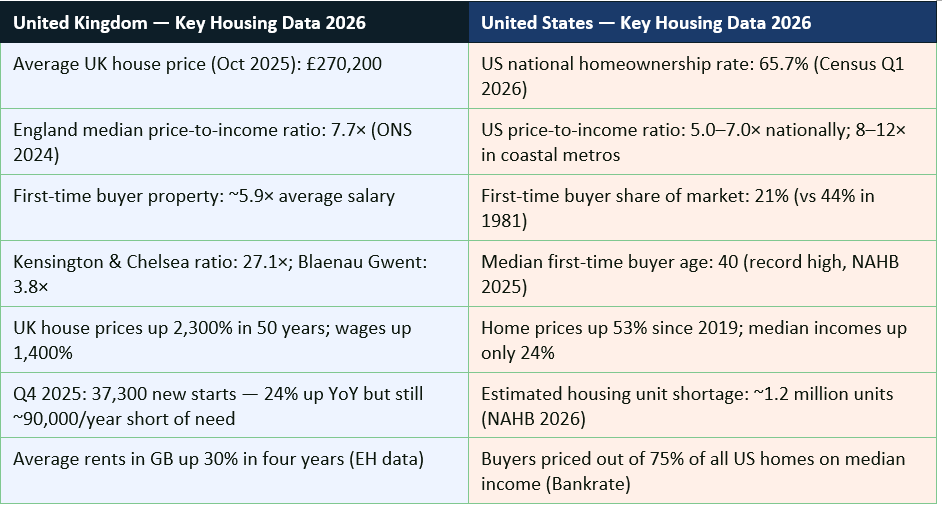
The human consequences are visible in the demographic data. In the US, the median age of a first-time homebuyer reached a record 40 in 2025, according to the National Association of Home Builders — up from 29 in 1981. The share of first-time buyers as a proportion of all home sales has collapsed from 44% in 1981 to just 21% in 2025. Among married Americans under 30, homeownership has fallen from 52% in 1960 to just 12% today. In the UK, roughly 3.4 million 20 to 34-year-olds live with parents because they cannot afford independent housing, and the average first-time buyer in London now spends over a decade saving for a deposit.
UK Housing Affordability in 2026: What the Numbers Show
The Office for National Statistics published its 2024 housing affordability data in early 2025, providing the most authoritative picture of the UK's price-to-income landscape. The headline figure is that the median home in England cost 7.7 times the median full-time earnings of a workplace-based employee — unchanged from the long-run elevated levels that have persisted since the late 2010s, though below the 2022 peak.The variation across England is stark. In Kensington and Chelsea, the least affordable local authority in the country, the price-to-income ratio stands at 27.1 — meaning a median home costs 27 years of median local earnings. At the other end, Blaenau Gwent in Wales has a ratio of 3.8, approaching historical norms for affordability. Only 9% of local authorities in England and Wales now have homes selling for less than five times median earnings — the official threshold for 'affordable' housing — the highest proportion since 2015, but still dramatically lower than the 88% that met this threshold in 1997.
The rental market has provided little relief for those locked out of ownership. Average rents across Great Britain have risen approximately 30% in four years. In Northern Ireland, rents increased 5% in the twelve months to January 2026 alone, reaching an average of £880 per month. The paradox highlighted by Economics Help is that in many parts of the UK, the monthly cost of a 25-year mortgage on a median-priced property is now lower than monthly rent for a similar property — but potential buyers cannot access the mortgage because they cannot save a deposit fast enough against rising house prices.
Even with slight improvements in affordability ratios, houses still cost close to six times the average salary in many areas. The housing crisis isn't just about expensive homes — it's a combination of several problems happening at the same time.
— UK MORTGAGE CENTRE, HOUSING CRISIS ANALYSIS, 2026
US Housing Affordability in 2026: A Generation Locked Out
The United States housing affordability crisis has followed a broadly similar trajectory to the UK's, though with important structural differences in its causes and severity by region. The national median home price-to-income ratio has risen from 4.3 in 2003 to approximately 5.0 to 7.0 today, with coastal metropolitan areas — San Francisco, New York, Seattle, Los Angeles — reaching ratios of 8 to 12 times median income. An income above $200,000 is now required to afford the median-priced home in Seattle, San Francisco, and New York, according to Bankrate's 2025 analysis.The demographic consequences are among the most striking in the data. The National Association of Home Builders reports that the share of first-time buyers in the market has fallen from 44% in 1981 to just 21% in 2025, while the median age of a first-time buyer reached a record 40 in 2025 — meaning that the typical American buying their first home in 2026 began their adult working life before the smartphone existed. Home prices have risen 53% since 2019, while median household incomes rose only 24% over the same period, according to NAHB. The affordability of homeownership for typical households is at multi-decade lows despite some improvement from the 2022 peak.
The racial dimensions of the US housing crisis compound its severity. The gap between white and Black homeownership rates is wider today than it was when the Fair Housing Act was passed in 1968 — a 28-point gap that reflects decades of redlining, predatory lending during the 2008 crisis, and ongoing appraisal disparities that continue to undervalue properties in majority-Black neighbourhoods. Among all age groups in the US, homeownership rates dropped 8 to 10 percentage points between 2000 and 2022, making this far more than a young-people problem.
Cause 1 — The Supply Shortage: Not Enough Homes Built
The most widely agreed-upon cause of the housing affordability crisis, across economists, policymakers, and housing researchers of nearly every political persuasion, is a sustained, structural undersupply of new homes relative to population growth and household formation. In the UK, the government's target is 300,000 new homes per year in England. The actual delivery for the year ending September 2025 was approximately 231,300 — significantly below target and well below the level required to address the accumulated backlog of unmet housing need.In the US, NAHB estimates a shortage of approximately 1.2 million housing units nationally. Single-family housing starts are expected to reach only 940,000 in 2026 — below the rate needed to keep pace with household formation, let alone reduce the accumulated shortage. Construction has not recovered to pre-2008 levels in absolute terms, even as the population has grown substantially in the intervening period.
The undersupply problem is not new. It is the result of decades of insufficient building, exacerbated by the post-2008 financial crisis pullback in construction activity, persistent labour shortages in the construction industry (NAHB reports nearly 300,000 construction job vacancies in the US alone), rising material costs, and building safety regulatory complexity in the UK that has slowed starts.
Cause 2 — The Mortgage Rate and Lock-In Effect
The sharp rise in mortgage rates between 2022 and 2024 — from historic lows of 2.65% to above 7% in the US and from below 2% to above 6% in the UK — had a dual affordability impact that is still working its way through the market in 2026.The first impact was direct: higher rates dramatically increased the monthly cost of servicing a mortgage. A £250,000 UK mortgage at 2% costs approximately £1,060 per month. At 6%, it costs approximately £1,610 per month. Many would-be first-time buyers found that the combination of higher rates and still-elevated prices pushed their required income to qualify for a mortgage well beyond what they earned.
The second impact was the 'lock-in effect', also called the rate lock or golden handcuffs phenomenon. Homeowners who secured mortgages at 2% to 3% between 2020 and 2022 have been strongly discouraged from selling and buying a new property at 6% rates, because doing so would dramatically increase their monthly payments on the same or lower loan amount. The result has been a significant reduction in the supply of existing homes listed for sale — as the Redfin and Compass analyses confirm. In the US, inventory went from a record low 2.3 months' supply in 2021 to 4.1 months in 2025, a gradual recovery but still below the 5 to 6 months typically associated with a balanced market.
Cause 3 — Decades of Underbuilding and Planning Restrictions
The supply shortage is itself rooted in a deeper cause: planning and zoning systems in both the UK and US that have historically restricted new housing construction in the areas where it is most needed — around major employment centres, transport hubs, and desirable residential areas.In the UK, the planning system grants local councils significant power to refuse new development. While the 2024 Labour government has introduced planning reforms designed to increase housing delivery, including restoring mandatory housing targets and updating national planning policy, the results of planning reform take years to feed through into completed homes. The green belt — land around major UK cities protected from development — has long been a target for reform advocates who argue it unnecessarily restricts supply in the areas of highest demand.
In the US, single-family zoning — laws that restrict the type of housing that can be built in most residential areas to detached single-family homes — covers the majority of residentially zoned land in most major cities. This makes it legally impossible to build the denser, more affordable housing types (apartments, townhomes, accessory dwelling units) that would be commercially viable in high-demand areas without zoning reform. The YIMBY (Yes In My Back Yard) movement has made progress in a number of US states — California, Oregon, Montana, and others have passed statewide zoning reform laws — but progress is uneven and the housing it enables takes years to be built and occupied.
Cause 4 — Inequality, Investor Demand, and the Bank of Mum and Dad
Two structural forces have amplified the affordability crisis by creating a two-tier market: those with access to inherited wealth or family support, and those without.The 'bank of mum and dad' has become a defining feature of first-time buyer markets in both the UK and US. In London, the average deposit required to buy a first home exceeds £100,000. For those without parental wealth to draw on, saving this sum from earned income while paying rent takes 10 to 15 years in many parts of the country. For those with wealthy parents who can contribute or gift a deposit, access to homeownership is preserved. This mechanism recycles existing property wealth into the next generation and increasingly determines who can and cannot access homeownership, independent of income or financial behaviour.
Investor and corporate ownership of residential property has also been a contributing factor, particularly in the most constrained markets. In the UK, second home ownership and buy-to-let landlordism — while subject to increasing tax disincentives including the 3% stamp duty surcharge and the removal of mortgage interest tax relief — has reduced the supply of homes available to owner-occupiers. In some US markets, large-scale institutional investors and iBuyers have purchased significant proportions of available homes, reducing supply to individual buyers and contributing to price pressure in already-constrained markets.
Cause 5 — Rising Costs of Ownership Beyond the Mortgage
In 2026, mortgage payments are not the only affordability challenge for homeowners. The total annual cost of owning a home has risen significantly beyond the mortgage payment itself, and for many potential buyers and existing homeowners, these additional costs have become an increasingly significant barrier.Homeowners insurance premiums have risen approximately 70% in the US over the past five years, driven by climate-related losses from wildfires, flooding, hurricanes, and extreme weather events. In Florida, California, and parts of the Gulf Coast, standard insurers have withdrawn from the market entirely, forcing homeowners onto expensive state-backed plans. As this guide's companion article on foreclosures examined, rising insurance costs are now a leading driver of mortgage delinquencies and foreclosures for households who secured their mortgage when insurance was affordable.
Property taxes have also risen sharply in many US markets as counties catch up with pandemic-era appreciation in assessed valuations. In the UK, while council tax is less volatile, rising energy costs, maintenance inflation, and leasehold reform complexities add to the total burden of ownership. NAHB's Robert Dietz noted that shelter costs in the US were running at a 3.6% annual rate in early 2026, outpacing overall consumer price inflation — meaning housing is still getting more expensive in real terms even as the pace of price growth has slowed.
Is Affordability Actually Improving in 2026?
The honest answer is: marginally, in some places, for some people — but not nearly enough to make homeownership accessible to those currently locked out.Several converging forces are providing modest relief. Mortgage rates have fallen from their 2023 peak of above 7% in the US and above 6% in the UK to the low-to-mid 6% range in early 2026. NAHB expects US mortgage rates to remain slightly above 6% throughout 2026, with a sub-6% rate unlikely until 2027. In the UK, Capital Economics forecasts rates could fall more than previously expected in 2026. The reduction in a £250,000 UK mortgage from 6% to 3.8% has already reduced monthly payments from approximately £1,610 to £1,292 — a meaningful improvement.
Redfin's widely cited 2026 forecast predicted a 'Great Housing Reset' — a prolonged period in which income growth outpaces home price growth for the first time since the Great Recession. With US home prices expected to grow around 1% in 2026 while wages grow approximately 4%, the price-to-income ratio is slowly compressing. Compass Intelligence forecasts the US ratio falling to approximately 4.9 times by the end of 2026, from above 5 times in 2022.
However, Redfin's own economists acknowledge that even under this optimistic scenario, it would take approximately five years for the housing market to return to a 'semblance of normal' for affordability. Bankrate's analysis found that at median US income, households are still priced out of 75% of all homes on the market. The improvement is real but incremental — and for the lowest-income households, those with no family wealth, and those in the most constrained coastal markets, the crisis is not easing at any meaningful pace.
Solutions: What Actually Works
After decades of debate, a clearer picture is emerging from policy research and international comparisons about which housing affordability interventions have genuine impact and which are limited in their effectiveness.Supply-side reform: the highest-impact intervention
The academic and economic consensus is that the primary driver of housing unaffordability is a structural supply shortage, and that the most effective long-term remedy is significantly increasing the supply of housing in areas of high demand. This requires planning and zoning reform that allows denser housing — apartments, townhomes, co-living, accessory dwelling units — in areas currently restricted to single-family detached homes, particularly around major employment centres and public transport corridors.Oxford Economics' modelling for the UK suggests that boosting supply to 310,000 homes per year would bring only a 5% reduction in the baseline forecast for prices — supply alone is not a complete solution, but it is a necessary one. In the US, statewide zoning reform in California, Oregon, and Minnesota has begun to increase the pipeline of new housing, though completed homes will take years to appear at scale.
Policy solutions — what the evidence supports
- Zoning and planning reform (YIMBY policies): Allow denser housing near transport and employment. Statewide zoning reform in California, Oregon and elsewhere is beginning to expand supply pipelines. UK planning reform under the 2024 Labour government aims to restore mandatory housing targets and accelerate development.
- Social and affordable housing investment: The National Housing Federation and Crisis (UK) argue that alongside 300,000 new homes per year, 145,000 must be affordable homes. Direct government investment in social housing — rather than relying on the private market to deliver affordable units — has the strongest track record in meeting the needs of low-income households.
- Build-to-rent and purpose-built rental expansion: Investing in professionally managed, long-term rental housing at scale provides a better alternative to the current private rental market for those who cannot buy, while freeing existing stock for purchase.
- Help to Buy and first-time buyer support schemes: Shared ownership, Help to Buy (UK), and FHA loan programmes (US) improve access for first-time buyers — but evidence shows they primarily work by shifting the price point of eligibility rather than increasing supply, so they are more effective when combined with supply-side measures.
- Land value taxation: A tax more closely linked to land values than building values would incentivise the development of underutilised land and reduce speculative landholding, tackling one of the structural causes of supply restriction.
- Property tax reform (Council Tax UK): The Joseph Rowntree Foundation has proposed replacing the UK's outdated council tax band system (based on 1991 valuations) with an annual property levy more closely linked to current market values, which would improve revenue distribution and reduce the incentive to hold underoccupied high-value property.
- Institutional investor regulation: Policies to limit bulk purchasing of residential properties by institutional investors — being actively debated in the US and several European countries — may protect supply for individual buyers in the most constrained markets, though evidence on effectiveness is still developing.
CONCLUSION
The housing affordability crisis of 2026 is the product of decades of policy choices, structural underinvestment in new supply, and a planning regime in both the UK and US that has consistently prioritised the interests of existing homeowners over those of future ones. UK homes cost 7.7 times median income. US first-time buyers are now 40 years old on average. Only 21% of US home purchases are by first-time buyers. These are not natural disasters — they are the predictable outcomes of decisions made over decades about how much housing to build, where to allow it, and who to help afford it.There are early signs in 2026 that affordability is marginally improving — slowly compressing price-to-income ratios, falling mortgage rates, and the beginnings of genuine planning reform in both countries. But the scale of the problem is such that the improvement will be measured in years and decades, not months. The Redfin Great Housing Reset thesis is credible but requires sustained political will to build at scale, reform planning systems, and invest in genuinely affordable housing for the households that the market will never serve at market rates. Without that commitment, the housing affordability crisis will continue to be one of the defining social and economic challenges of the 2020s and beyond.
Frequently Asked Questions
What is the price-to-income ratio and why does it matter?
The price-to-income ratio divides the median home price by the median annual earnings to show how many years of income it costs to buy a typical home. Historically, a ratio of 3 to 4 was considered broadly affordable and accessible on a standard mortgage. The UK ratio in England was 7.7 in 2024 (ONS); the US national ratio is 5.0 to 7.0, with coastal metros reaching 8 to 12 times income. Higher ratios mean larger deposits are needed, larger mortgages are required, and a greater share of income must be devoted to housing costs — pricing out more households from ownership entirely.Why are first-time buyers so much older now?
The median US first-time buyer age reached a record 40 in 2025, up from 29 in 1981 (NAHB). This reflects the combination of rising home prices relative to incomes, higher deposit requirements, student debt burdens that delay savings accumulation, and the disappearance of affordable starter homes in many markets. In the UK, the average first-time buyer in London spends over a decade saving for a deposit. The structural result is that a growing share of households is spending their 20s and 30s renting rather than building equity — accumulating wealth more slowly and reaching key homebuying milestones much later than previous generations.Is the housing affordability crisis getting better or worse in 2026?
Marginally better in some respects, but not enough to restore broad accessibility to first-time buyers. Mortgage rates have fallen from their 2023 peak; home price growth has slowed significantly; wage growth is expected to outpace home price growth in 2026 for the first time since the Great Recession, according to Redfin. However, Bankrate's analysis finds that median-income US households are still priced out of 75% of all homes on the market. Redfin estimates it will take approximately five years even under optimistic assumptions for the market to approach 'semblance of normal' affordability. The improvement is real but insufficient for the millions of households currently locked out.What is the YIMBY movement and does it actually help?
YIMBY (Yes In My Back Yard) is a movement that advocates for allowing more housing construction in high-demand areas, particularly by reforming zoning and planning laws that restrict denser housing. It is the opposite of NIMBY (Not In My Back Yard) opposition to new development. YIMBY-aligned zoning reforms have been passed in California, Oregon, Montana, and Minnesota, among other US states, allowing duplexes, townhomes, and apartments in areas previously restricted to single-family homes. The evidence suggests these reforms do increase housing supply over time, though the effect on prices takes years to materialise. Most housing economists see supply-side reform as the highest-impact long-term intervention, but acknowledge it is not a quick fix.How does the UK housing crisis differ from the US housing crisis?
Both share the same core cause — insufficient housing supply relative to demand — but differ in important ways. The UK's planning system gives more power to local councils to refuse development, constraining supply in the areas of highest demand. The US's primary constraint is single-family zoning in most residential areas, making denser housing types illegal to build across vast swaths of metropolitan land. The UK's crisis is more geographically concentrated, with a stark divide between London and the South East and more affordable areas in the North and Wales. The US crisis has a more acute racial dimension, with homeownership gaps that have persisted or widened despite decades of legal protections. Both countries are beginning to implement planning and zoning reforms, but neither is building at the scale required to resolve the structural shortage.What should I do if I cannot afford to buy a home?
This is a question for a qualified financial adviser, since individual circumstances vary enormously. Generally speaking, people in this position should: check eligibility for shared ownership, Help to Buy, or other government schemes (in the UK, gov.uk/shared-ownership-scheme); explore areas outside the most expensive cities where ratios are significantly more affordable; maximise LISA (Lifetime ISA) or First Home Savings Account contributions to build a deposit with a government top-up; and consider whether renting indefinitely and investing the deposit equivalent may be a better financial path in extremely high-ratio markets where buying at current prices with current rates is marginal. Housing affordability may improve gradually over the next five years, and not rushing into an overpriced purchase to keep up with social norms is a legitimate strategy.References
ONS — Housing Affordability in England and Wales: 2024 https://www.ons.gov.uk/peoplepopulationandcommunity/housing/bulletins/housingaffordabilityinenglandandwales/2024House of Commons Library — Housing Market: Economic Indicators (updated May 2026) https://commonslibrary.parliament.uk/research-briefings/sn02820/
UK Mortgage Centre — The UK Housing Crisis Explained (2026) https://ukmc.co.uk/the-uk-housing-crisis-explained-2026/
NAHB — Impact of Affordability Challenges and Demographic Shifts on Housing Trends in 2026 (Feb 2026) https://www.nahb.org/news-and-economics/press-releases/2026/02/impact-of-affordability-challenges-and-demographic-shifts-on-housing-trends-in-2026
NAHB — 2026 Housing Outlook: Ongoing Challenges, Cautious Optimism (Feb 2026) https://www.nahb.org/news-and-economics/press-releases/2026/02/2026-housing-outlook-ongoing-challenges-cautious-optimism-and-incremental-gains
Redfin — 2026 Predictions: The Great Housing Reset (Dec 2025) https://www.redfin.com/news/housing-market-predictions-2026/
Fortune — Home Prices Out of Control: The Affordability Crisis (Apr 2026) https://fortune.com/2026/04/22/home-prices-out-of-control-affordibility-crisis/
Bankrate — Priced Out of 75% of the Market: The American Dream as Luxury (Dec 2025) https://www.bankrate.com/mortgages/american-dream-of-homeownership-turning-into-luxury/
Economics Help — UK House Price to Income Ratio and Affordability https://www.economicshelp.org/blog/5568/housing/uk-house-price-affordability/
Wealthvieu — US Homeownership Rate by Demographics 2026 https://wealthvieu.com/homeownership-rate-by-demographics/

0 Comments Comments