

Real Estate
How to Assess Your Family's Housing Affordability
Table of Contents
- Introduction
- The 2024 Housing Affordability Picture: Key Statistics
- The Core Ratios: How Lenders and Planners Actually Measure Affordability
- The 28/36 Rule
- The True Cost of Homeownership (Beyond PITI)
- Rent vs Buy: The Price-to-Rent Ratio
- Decision Matrix: Renting vs Buying vs Refinancing
- Refinancing: The Math That Determines Whether It Makes Sense
- The Break-Even Calculation
- When Refinancing Makes Sense Beyond Rate Reduction
- Building Your Family's Complete Housing Affordability Assessment
- Conclusion
- Frequently Asked Questions (FAQ)
- External References & Further Reading
For most of the past two decades, the dominant housing conversation in personal finance was straightforward: how do I buy a home? Save a down payment, improve your credit score, get pre-approved, find a house, close the deal. That framing made sense in an environment of historically low interest rates and steadily rising incomes relative to home prices.
That conversation has fundamentally changed. With the median US home price at $420,400 and 30-year mortgage rates sitting between 6.8% and 7.2% in 2024, the National Association of Realtors' Housing Affordability Index has fallen to 96.3 — down from 148 in 2021, representing the steepest multi-year affordability decline on record. The question families now face is no longer simply how to buy. It is whether buying, renting, or refinancing an existing mortgage is the financially correct decision given current numbers — and how to run that analysis honestly rather than relying on assumptions inherited from a different interest rate environment.
This guide provides the complete framework for assessing your family's housing affordability in the current market. It covers the standard affordability ratios lenders and financial planners actually use, the price-to-rent ratio that reveals whether your local market favours renting or buying, a full breakdown of the refinancing math for existing homeowners, and a practical decision framework that synthesises all of this into an honest answer for your specific household. The goal is not to tell you what to do — it is to equip you with the actual arithmetic so you can decide with confidence.
The 2024 Housing Affordability Picture: Key Statistics
Understanding the scale of the current affordability challenge provides essential context before running any household-specific calculation: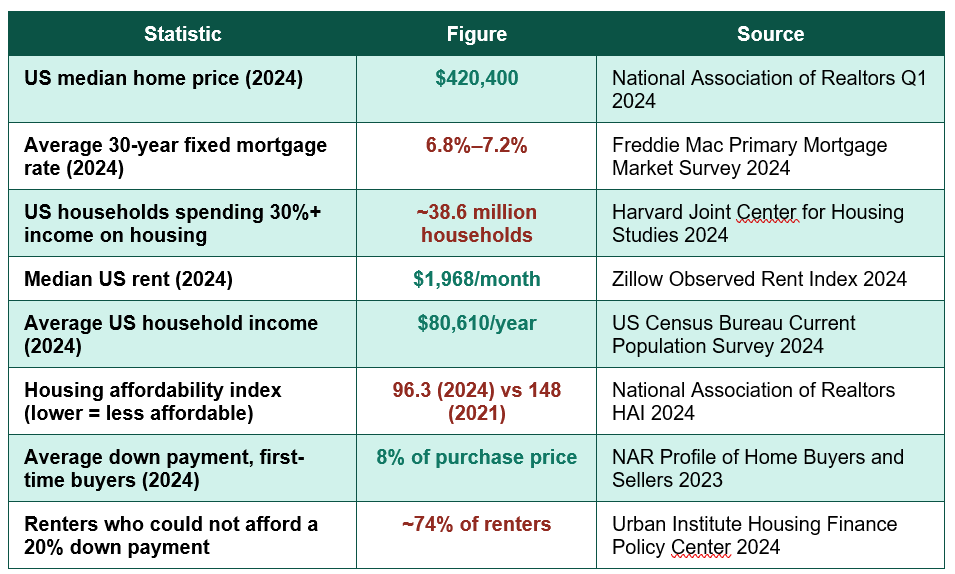
Housing Affordability Index decline: 148 (2021) to 96.3 (2024) — an index reading below 100 means the median-income family cannot qualify for a mortgage on the median-priced home using conventional underwriting standards — the defining affordability shift of this decade (NAR)
- What the Affordability Index actually means: An index value of 100 means a family earning the median income has exactly the income required to qualify for a mortgage on a median-priced home, assuming a 20% down payment. Below 100 indicates the median family falls short of qualifying income. The current reading of 96.3 confirms that affordability has become a genuine, measurable barrier for a majority of prospective buyers — not simply a subjective feeling.
The Core Ratios: How Lenders and Planners Actually Measure Affordability
Before comparing renting, buying, and refinancing, you need an objective measure of what your household can genuinely afford — independent of what a lender is willing to approve, which is not always the same as what is financially prudent for your family.The 28/36 Rule
The most widely used affordability benchmark in conventional mortgage underwriting is the 28/36 rule. It states that your housing costs (mortgage principal, interest, property taxes, and insurance — known as PITI) should not exceed 28% of your gross monthly income, and your total debt obligations (housing costs plus car loans, student loans, credit card minimums, and other debt) should not exceed 36% of gross monthly income.For a household earning $80,610 per year (the current US median) — approximately $6,718 per month gross — the 28% threshold limits housing costs to $1,881 per month, and the 36% threshold limits total debt obligations to $2,418 per month. Many conventional lenders now qualify borrowers up to 43-45% total debt-to-income ratio, which significantly increases the home price a family can technically qualify for, but pushing to these higher limits leaves considerably less margin for savings, emergencies, and the unavoidable additional costs of homeownership.
The True Cost of Homeownership (Beyond PITI)
Conventional debt-to-income calculations capture mortgage principal, interest, taxes, and insurance — but they do not capture the full cost of homeownership. A comprehensive affordability assessment must add:- Maintenance and repairs: Financial planners typically recommend budgeting 1-2% of the home's value annually for maintenance and repairs — $4,200 to $8,400 per year on a $420,400 home.
- HOA fees: For homes in planned communities or condominiums, monthly HOA fees can range from $200 to $800 or more, representing a significant and often underestimated recurring cost.
- Utilities and increased living costs: A larger home typically means higher heating, cooling, and utility costs than a comparable rental, particularly when transitioning from an apartment to a single-family home.
- Private Mortgage Insurance (PMI): Required on conventional loans with less than 20% down payment, PMI typically costs 0.5% to 1.5% of the loan amount annually until sufficient equity is built.
True annual cost of ownership beyond PITI: $8,000–$15,000+ — on a median-priced home, once maintenance, increased utilities, and potential PMI are included — a figure frequently absent from initial affordability calculations
Rent vs Buy: The Price-to-Rent Ratio
The price-to-rent ratio is one of the most useful and underused tools for assessing whether your local market favours renting or buying. It is calculated by dividing the median home price in your area by the annual rent for a comparable property.The formula: Price-to-Rent Ratio = Median Home Price ÷ Annual Rent. Using national figures as an illustration: $420,400 ÷ ($1,968 × 12) = $420,400 ÷ $23,616 = approximately 17.8. As a general guideline widely used by real estate economists: a ratio below 15 strongly favours buying, a ratio between 15 and 20 represents a more balanced market where the decision depends heavily on individual circumstances, and a ratio above 20 favours renting, as home prices have become disconnected from the income-generating potential (rent) that would normally justify them.
Critically, this ratio varies enormously by metropolitan area. Cities including San Francisco, New York, and Los Angeles frequently show price-to-rent ratios above 25-30, strongly favouring renting from a pure financial perspective, despite powerful cultural and lifestyle pressure toward buying. Meanwhile, many Midwest and Southern metro areas show ratios below 15, where buying offers a clear financial advantage over renting given current price levels.
Calculate your own local ratio: Search for the median home price and median rent for comparable properties (similar size, bedrooms, and neighbourhood) in your specific area — not national averages — using sources such as Zillow, Redfin, or your local Realtor association. National figures provide context but can be meaningfully misleading for any specific local market.
Decision Matrix: Renting vs Buying vs Refinancing
The table below synthesises the key factors that should influence whether your family's optimal path is to rent, buy, or — if you already own a home — refinance: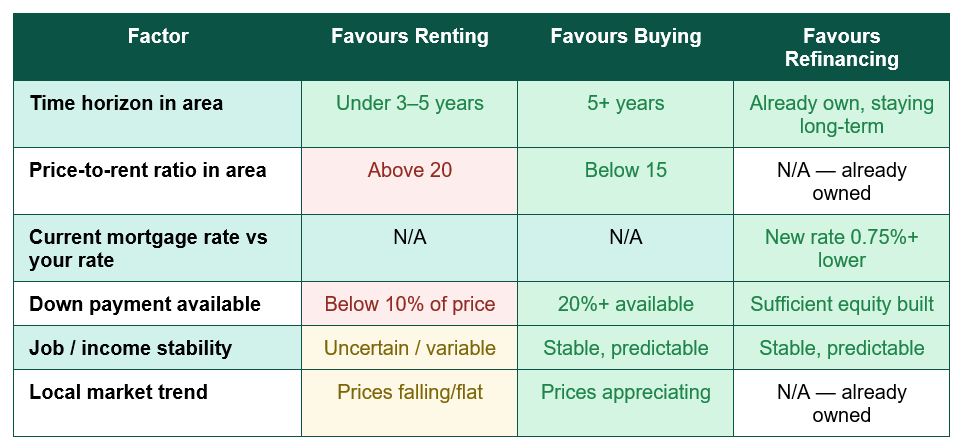
Time horizon deserves particular emphasis. Buying transaction costs — closing costs, real estate agent commissions, moving expenses — typically total 8-10% of the home's value when both buying and eventual selling costs are combined. A family that buys and sells within two to three years rarely recoups these transaction costs through equity appreciation, making renting the financially superior choice for any household with genuine uncertainty about their multi-year location plans.
Refinancing: The Math That Determines Whether It Makes Sense
For families who already own a home, the relevant question has shifted from 'should we buy' to 'does refinancing our existing mortgage make sense given current rates and our financial goals.' The calculation here is more precise than the rent-vs-buy decision because it involves known, comparable numbers.The Break-Even Calculation
The standard refinancing break-even formula divides your total closing costs by your monthly payment savings to determine how many months it takes to recoup the cost of refinancing: Break-Even Months = Total Closing Costs ÷ Monthly Savings.For example, a family with a $350,000 mortgage balance at 7.2% refinancing to 6.4% (a 0.8 percentage point reduction) would see their monthly payment fall from approximately $2,381 to $2,194 — a saving of $187 per month. If closing costs total $6,500, the break-even point is 6,500 ÷ 187 = approximately 35 months, or just under 3 years. If the family plans to remain in the home for at least that long, the refinance is financially justified; if they expect to move sooner, it is not.
When Refinancing Makes Sense Beyond Rate Reduction
- Removing PMI: If your home has appreciated sufficiently that you now have 20% or more equity, refinancing can eliminate private mortgage insurance, producing savings independent of any interest rate change.
- Cash-out refinancing for high-interest debt consolidation: If a family is carrying significant high-interest credit card debt, a cash-out refinance at a mortgage rate of 6-7% can be dramatically cheaper than continuing to carry debt at 20%+ credit card APRs, provided the underlying spending behaviour is addressed.
- Switching from adjustable-rate to fixed-rate: Families with an adjustable-rate mortgage (ARM) approaching a rate reset may benefit from refinancing into a fixed rate to lock in payment certainty, even if the immediate rate is not significantly lower.
- Shortening the loan term: Refinancing from a 30-year to a 15-year mortgage increases monthly payments but dramatically reduces total interest paid and accelerates equity building — appropriate for families with strong, stable income and a desire to be mortgage-free sooner.
2024 refinance rate environment: 6.8%–7.2% (30-yr fixed) — families who locked in rates below 4% between 2020–2022 are unlikely to benefit from refinancing today; those who bought or refinanced above 7.5% in 2023 may find meaningful savings available now (Freddie Mac 2024)
Building Your Family's Complete Housing Affordability Assessment
Bringing all of these tools together, the following sequence provides a complete, honest affordability assessment for your specific household:- Calculate your true gross monthly income: Include all stable, recurring income sources. Exclude bonus or variable income unless it has a multi-year track record of consistency.
- Apply the 28/36 rule conservatively: Calculate both the 28% housing-only and 36% total-debt thresholds, and treat the lower resulting home price as your genuine ceiling — not the higher figure a lender might approve.
- Add the true cost of ownership: Layer in the 1-2% annual maintenance estimate, expected utility increases, HOA fees if applicable, and PMI if your down payment will be below 20%.
- Calculate your local price-to-rent ratio: Use actual comparable local data, not national averages, to determine whether your specific market currently favours renting or buying.
- Assess your time horizon honestly: If there is meaningful uncertainty about remaining in the area for at least 4-5 years, weight your decision toward renting regardless of what the price-to-rent ratio suggests in isolation.
- Run the refinance break-even calculation if applicable: For existing homeowners, compare your break-even period against your realistic expected time remaining in the home before making any refinancing decision.
Conclusion
The housing affordability conversation has genuinely shifted. For much of the past generation, the implicit assumption was that buying was always the financially superior long-term choice, and the only real question was how to get there. The current combination of elevated home prices, mortgage rates near 7%, and a Housing Affordability Index below the qualifying threshold for median-income families has made that assumption unreliable — and in many specific markets, simply incorrect.The families who navigate this environment most successfully are not those who rigidly commit to buying or renting as an ideological position, but those who run the actual numbers for their specific household, their specific local market, and their specific time horizon. The 28/36 rule, the true cost of ownership beyond PITI, the price-to-rent ratio, and the refinance break-even calculation are not abstract financial theory — they are the precise tools that determine whether a given housing decision will strengthen or strain your family's financial position over the years ahead.
Whatever the right answer turns out to be for your household — renting for now, buying within your honestly calculated means, or refinancing an existing mortgage — the path to that answer is the same: replace assumptions with arithmetic. The housing market has changed enough in recent years that yesterday's conventional wisdom about how to assess affordability is no longer reliable. The tools in this guide are designed to give you a current, honest, and personalised answer instead.
Frequently Asked Questions (FAQ)
What is a good debt-to-income ratio for buying a home in 2024?
Most conventional lenders will approve mortgages with a total debt-to-income (DTI) ratio up to 43-45%, and some government-backed loans (FHA) allow even higher ratios with compensating factors. However, financial planners generally recommend staying closer to the traditional 36% threshold — and ideally below 28% for housing costs alone — to maintain adequate financial flexibility for savings, emergencies, and the additional costs of homeownership not captured in the basic mortgage payment.How do I find the price-to-rent ratio for my specific area?
Search for the median sale price and median rent for comparable properties (similar size, bedroom count, and neighbourhood quality) in your specific zip code or metro area using sources such as Zillow's Home Value Index and Observed Rent Index, Redfin's local market data, or your local Realtor association's market reports. Divide the median home price by the annual rent (monthly rent multiplied by 12) to calculate your local ratio, and compare it against the general benchmarks: below 15 favours buying, 15-20 is balanced, above 20 favours renting.Is it worth refinancing if I can only save $100-150 per month?
It depends entirely on your closing costs and how long you plan to remain in the home. Calculate your break-even point (closing costs divided by monthly savings) and compare it to your realistic time horizon. A $100/month saving with $4,000 in closing costs breaks even in 40 months (just over 3 years) — worthwhile if you plan to stay 5+ years, marginal if you might move in 3-4 years, and not worthwhile if you expect to sell or relocate within 2 years.Should I wait for mortgage rates to fall before buying?
This is one of the most debated questions in current housing strategy, and there is no universally correct answer. The conventional planning approach is to 'marry the house, date the rate' — meaning if you find a home that fits your genuine affordability calculation and you plan to stay long-term, buying now and refinancing later if rates fall is often more reliable than waiting indefinitely for a rate environment that may not materialise, particularly since falling rates often coincide with rising home prices as more buyers re-enter the market, potentially offsetting some of the rate benefit.What hidden costs of homeownership do first-time buyers most commonly underestimate?
The most commonly underestimated costs are: ongoing maintenance and repairs (budget 1-2% of home value annually, not just emergency reserves); the increase in utility costs when moving from a smaller rental to a larger home; homeowners insurance premium increases, which have risen sharply in many states due to climate-related claims; property tax reassessments that can increase significantly after purchase in some jurisdictions; and the opportunity cost of the down payment itself, which could otherwise be invested. A comprehensive affordability assessment should explicitly budget for all of these factors rather than relying solely on the mortgage principal and interest payment.
External References
The following authoritative sources were used in researching this article and are recommended for further reading:1. National Association of Realtors — Housing Affordability Index 2024
https://www.nar.realtor/research-and-statistics/housing-statistics/housing-affordability-index
2. Freddie Mac — Primary Mortgage Market Survey (Weekly Rate Data)
https://www.freddiemac.com/pmms
3. Harvard Joint Center for Housing Studies — State of the Nation's Housing 2024
https://www.jchs.harvard.edu/state-nations-housing-2024
4. Zillow Research — Home Value and Rent Index Data
https://www.zillow.com/research/data/
5. Consumer Financial Protection Bureau — How Much House Can You Afford?
https://www.consumerfinance.gov/owning-a-home/affordability/
6. US Census Bureau — Current Population Survey, Household Income 2024
https://www.census.gov/topics/income-poverty/income.html
7. Urban Institute — Housing Finance Policy Center Monthly Chartbook
https://www.urban.org/policy-centers/housing-finance-policy-center
8. Investopedia — Rent vs Buy: How to Make the Right Decision
https://www.investopedia.com/articles/personal-finance/083115/renting-vs-buying-home-which-right-you.asp

0 Comments Comments