

Savings
Savings by Age: How Much by 30, 40, 50 & 60?

Key Statistics: Fidelity benchmark: 1x salary by 30, 3x by 40, 6x by 50, 8x by 60, 10x by 67. T. Rowe Price target: 11x final salary by retirement. Vanguard How America Saves 2026: average 401(k) $167,970, median $44,115. Fidelity Q1 2026 (25.6m participants): overall average 401(k) $141,000. Federal Reserve: median under-35 retirement balance $18,880; median 35-44: $45,000; median 45-54: $115,000. 27% of Americans have $0 saved. 2026 401(k) limit: $23,500 (+$7,500 catch-up over 50). IRA limit: $7,000 (+$1,000 catch-up). T. Rowe Price: 15% savings rate (including employer match) is baseline.
How much should you have saved by the time you are 30, 40, 50, or 60? This is one of the most commonly asked personal finance questions, and it has a surprisingly specific answer: approximately one times your annual salary by 30, three times by 40, six times by 50, and eight times by 60. These benchmarks, developed and popularised by Fidelity Investments and broadly adopted across the financial planning industry, are the most widely cited savings targets in the US.
The problem is that most Americans are not meeting them. By a wide margin. Federal Reserve data shows that the median American under 35 has approximately $18,880 in retirement accounts — against a Fidelity benchmark of one times salary, which on the typical US salary of around $58,000 implies a target of $58,000. The typical 30-year-old is about 67 percent below benchmark. The gap does not close meaningfully by 40 or 50: median 35 to 44 year olds have approximately $45,000, against a 3x benchmark of around $225,000.
This article explains the benchmarks, where they come from, what they actually assume, how Americans actually compare to them using the most current 2026 data from Vanguard, Fidelity, and the Federal Reserve, and what to do about the gap at every decade. The benchmarks are not a verdict. They are a compass.
The benchmarks include all retirement accounts: 401(k), IRA, and pension value. They do not include home equity, taxable brokerage accounts, or emergency savings. T. Rowe Price's April 2026 analysis puts the final target slightly higher than Fidelity's 10x: T. Rowe Price recommends saving 11 times your ending salary by retirement.
Fidelity and T. Rowe Price on the baseline: Both frameworks agree on the 15% savings rate (including employer match) as the appropriate baseline for most workers. T. Rowe Price's April 2026 guidance suggests starting at 6% at age 25 and increasing by 1% per year, which allows for gradual adjustment as income and financial priorities evolve.
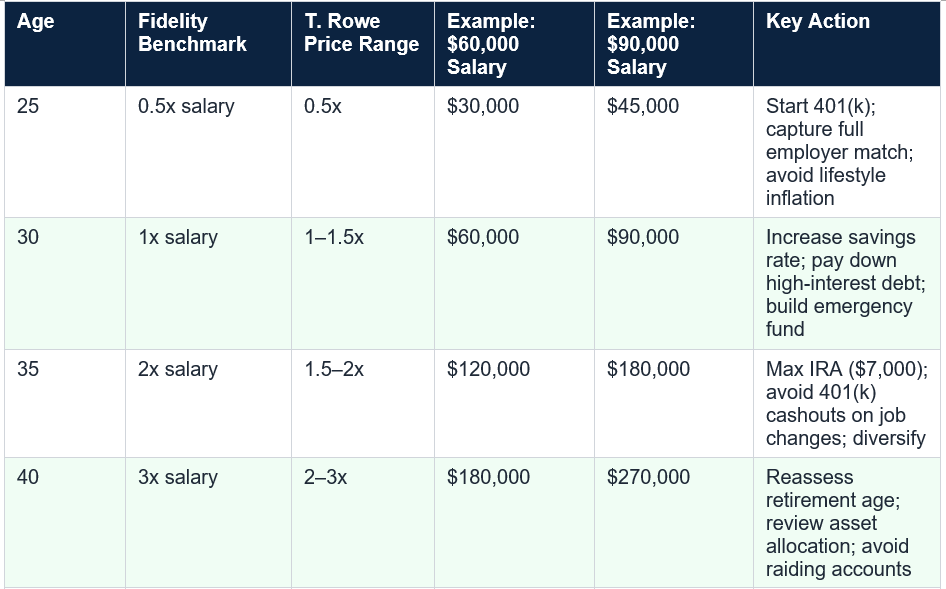
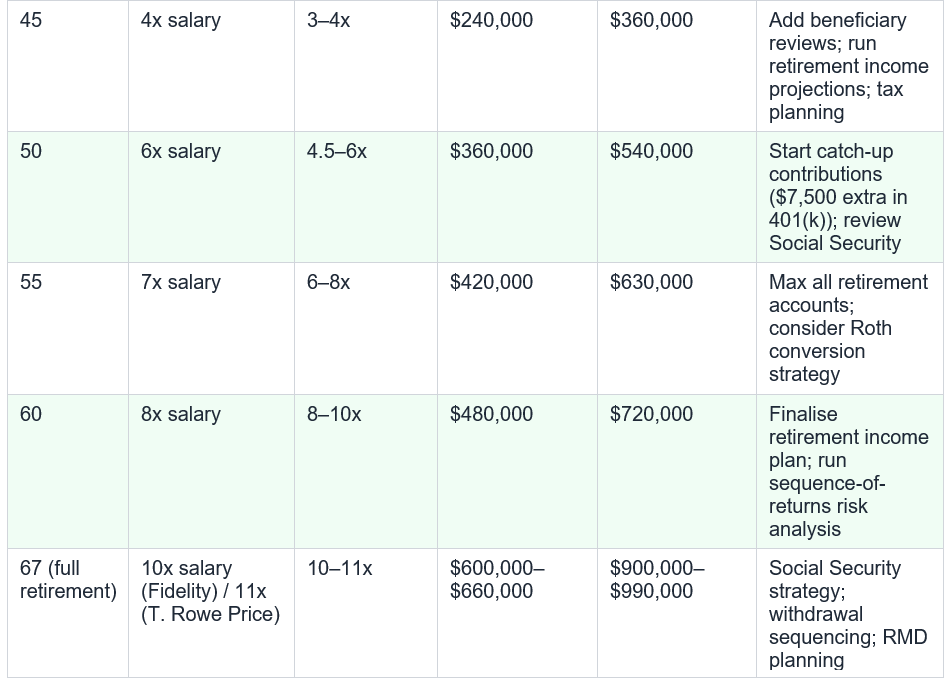
Your 20s are typically the most financially constrained decade. Student loan repayments, entry-level salaries, housing costs, and major life transitions — first apartment, marriage, potentially children — compete with savings. The benchmark acknowledges this: reaching 1x salary by 30 requires starting contributions in your early to mid-20s, even at modest rates.
The most powerful action in your 20s is capturing your employer's full 401(k) match. This match is, functionally, an immediate 50 to 100 percent return on your contribution — the highest guaranteed return available to any investor. Every dollar of employer match you leave uncaptured is compensation you have earned and declined to receive. If the match requires contributing 6 percent of salary, contribute 6 percent minimum before anything else.
Time is the most valuable resource at age 30. A dollar saved at 25 compounds for 42 years to retirement at 67. A dollar saved at 35 compounds for 32 years. The 10-year difference in compounding, at even a modest 6 percent return, means the earlier dollar is worth approximately 1.8 times more at retirement. This is why the urgency to start — even at small amounts — is highest at this age.
Reaching 3x by 40 typically requires having saved consistently through your 30s at or above the 15 percent rate. The 30s bring competing financial pressures: mortgages, childcare costs, education savings, and often the most rapid expansion of lifestyle spending. These years are also typically when income is accelerating, which makes it genuinely possible to increase savings rates meaningfully without reducing living standards.
Two specific mistakes are most common and most damaging in this decade. First, cashing out a 401(k) when changing jobs. According to Retirement Budget Calculator's May 2026 analysis, this single decision can cost tens of thousands in future retirement wealth through the combination of the 10 percent early withdrawal penalty, the ordinary income tax triggered, and the lost compounding on the withdrawn amount. Always roll over a 401(k) to the new employer's plan or to an IRA.
Second, pausing retirement contributions to fund children's college education. College funding has alternatives: scholarships, student loans, working during school. Retirement has no equivalent. As many financial advisers put it: you cannot take out a loan for retirement. Prioritise your own retirement savings before college funding, particularly through your 40s.
T. Rowe Price, April 2026: Having one to one-and-a-half times your income saved for retirement by age 35 is an attainable target for someone who starts saving at age 25. The key variable is starting early and maintaining a consistent rate through the financially complex years of the 30s.
Your 50s are the final major accumulation decade. Retirement is no longer an abstract concept — it is 10 to 17 years away. This is the decade to do three things: accelerate contributions using catch-up provisions, get serious about your specific retirement income number, and develop your Social Security claiming strategy.
The Social Security decision is one of the highest-stakes choices in retirement planning. Claiming at 62 (the earliest possible age) locks in permanently reduced benefits — approximately 25 to 30 percent below the full retirement age amount. Delaying to 70 increases benefits by approximately 8 percent per year beyond full retirement age. The breakeven point for most people — the age at which delayed claiming pays off — is typically in the mid-to-late 70s. For people in good health with longevity in their family history, delay is almost always mathematically superior.
Asset allocation also deserves review in your 50s. Many people become too conservative too early — shifting to bonds and cash at 50 out of fear of market volatility. Wealthvieu's June 2026 analysis notes that at 45, a portfolio that is 70 percent stocks and 30 percent bonds is not aggressive; it is appropriate for a 20-plus-year time horizon. Moving to a CD-heavy portfolio at 50 often causes more long-term damage than a bear market would, because the reduced growth rate compounds over the many remaining years of both accumulation and retirement.
At 60, the conversation begins to shift from savings accumulation to retirement income planning. The key questions change: not how much can I save, but how do I convert what I have saved into sustainable income? This shift involves:
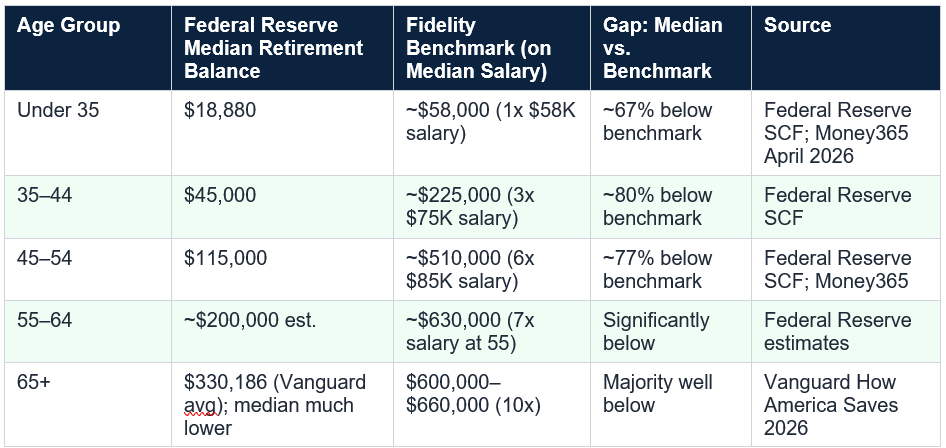
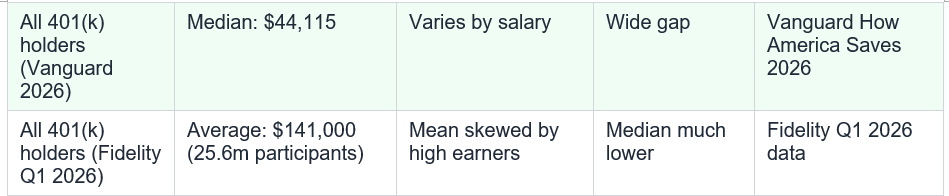
The numbers reveal a consistent and sobering pattern: at every age bracket, the median American's retirement savings falls well short of the Fidelity benchmark. And importantly, the average balance — the number most often cited in headlines — overstates where most people stand, because a small number of very high balances pull the average dramatically upward. The median is the number that reflects where the typical American actually is.
Consider: if nine people have $10,000 each and one person has $1,000,000, the average is $109,000 — far above what any of the nine typical people have. The median is $10,000, accurately reflecting where most people stand. US retirement savings follow exactly this pattern: a small percentage of very high-income savers with very large balances pull the mean up dramatically, while the majority of American workers have balances far below the average.
This matters for how you interpret your own situation. If you are significantly below the average figure you read in a news article, you are probably closer to the median than you think — which is still behind the Fidelity benchmark, but not as far behind as the headline average implies. Wealthvieu's analysis notes that 27 percent of Americans have zero savings entirely, which further compresses how meaningful averages are as a benchmark for the median worker.
The most powerful action is starting or increasing contributions immediately and capturing the full employer match. Even a 1 to 2 percent increase in your contribution rate — starting now rather than next year — has a compounding effect over the remaining 30-plus years to retirement. Automate your savings rate increase annually so that raises partially go to retirement before you adjust your spending to them.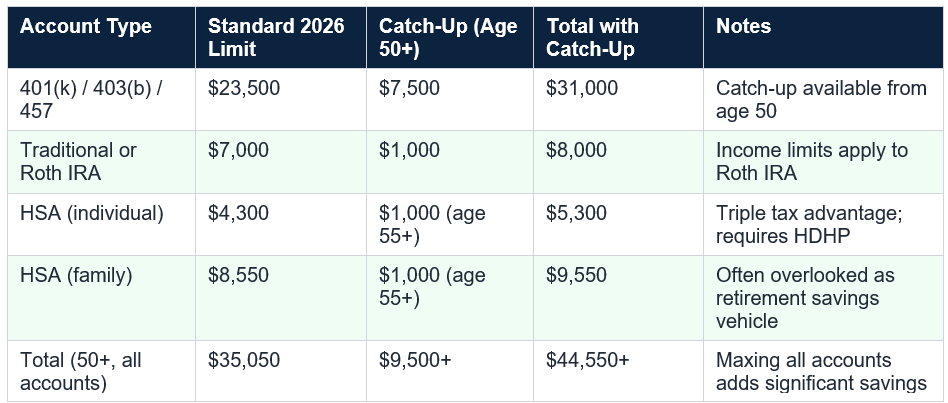
The IRS catch-up provisions for workers 50 and older are one of the most valuable and most underutilised tools in retirement planning. Workers who can max out all available accounts from 50 to 67 can add $44,550 or more per year over 17 years — a total of over $757,000 in contributions alone, before investment growth. Even at the more realistic level of maxing the 401(k) and IRA combined ($39,000 per year), 17 years of maximum contributions generate approximately $663,000 in contributions, which with investment growth could approach or exceed the 10x benchmark for many workers.
The Federal Reserve data is clear that most Americans are significantly behind these benchmarks at every age bracket. But being behind a benchmark is not a reason for despair — it is a reason for action. The 27 percent of Americans with zero savings are not necessarily condemned to a poor retirement: starting at 40 with zero and contributing maximally from that point forward produces a meaningfully better outcome than it might intuitively seem, particularly with Social Security providing a floor of income.
The most important insight from both the Fidelity and T. Rowe Price analyses is that the time to act is always now. The benchmarks describe an outcome. The levers that determine whether you reach them are within your control: your savings rate, your employer match capture, your investment allocation, your avoidance of early withdrawals, and your Social Security claiming decision. On every one of those levers, action today is worth more than the equivalent action next year, because every year's delay removes a year of compounding from your future balance.
The Fidelity benchmark is one times your annual salary saved in retirement accounts by age 30. T. Rowe Price's range is one to one-and-a-half times salary. On a typical US salary of $58,000, this implies $58,000 to $87,000 in retirement accounts. Federal Reserve data shows the median American under 35 has approximately $18,880 in retirement accounts — approximately 67% below the Fidelity 1x benchmark on a typical salary.
How much should you have saved by age 40?
The Fidelity benchmark is three times your annual salary by age 40. T. Rowe Price's range is two to three times salary. On a salary of $75,000, this implies $150,000 to $225,000 in retirement accounts. Federal Reserve data shows the median 35-44 year old has approximately $45,000 — far below the 3x target. The most common mistakes of this decade are cashing out 401(k) accounts during job changes and raiding retirement savings for college tuition.
How much should you have saved by age 50?
The Fidelity benchmark is six times your annual salary by age 50. T. Rowe Price puts the target at 4.5 to 6 times salary. On a salary of $85,000, the 6x benchmark implies $510,000 in retirement accounts. Federal Reserve data shows the median 45-54 year old has approximately $115,000. Workers 50 and older can make catch-up contributions: up to $31,000 annually in a 401(k) and $8,000 in an IRA, for a total of $39,000 or more in tax-advantaged contributions per year.
How much should you have saved by age 60?
The Fidelity benchmark is eight times your annual salary by age 60. T. Rowe Price's range is eight to ten times salary. On a salary of $90,000, this implies $720,000 to $900,000. At 60, the focus should shift from accumulation to income planning: withdrawal sequencing, Social Security strategy, sequence-of-returns risk management, and Required Minimum Distribution planning from age 73.
What are the 2026 retirement contribution limits?
For 2026: 401(k)/403(b) standard limit is $23,500, with a $7,500 catch-up for workers 50 and older (total $31,000). IRA standard limit is $7,000, with a $1,000 catch-up (total $8,000). HSA individual limit is $4,300, with a $1,000 catch-up from age 55. Workers 50 and older who maximise all accounts can contribute $44,550 or more per year in tax-advantaged accounts.
What is the average 401(k) balance in 2026?
According to Vanguard's How America Saves 2026 report, the average 401(k) balance is $167,970, but the median is only $44,115. Fidelity's Q1 2026 data covering 25.6 million participants puts the overall average at $141,000. The large gap between average and median reflects the skewing effect of very high balances held by a small number of participants — the median is more representative of where most American workers actually stand.
What if I have $0 saved at 40?
Starting from zero at 40 is challenging but not hopeless. With 27 years to full retirement age (67), consistent contributions can still build meaningful retirement wealth. At a $75,000 salary, maximising a 401(k) at $23,500 per year from age 40 to 67 generates approximately $634,000 in contributions alone; with a 6% average annual return, this grows to over $1.5 million by 67. Additionally, Social Security provides a meaningful income floor that reduces the amount you need to self-fund entirely from savings.
Should I count my home equity in my savings benchmark?
The Fidelity and T. Rowe Price savings benchmarks specifically exclude home equity. They measure retirement accounts only: 401(k), IRA, and pension value. Home equity can provide retirement income through strategies such as downsizing or reverse mortgages, but it is not as liquid or reliable as retirement account savings. Track retirement account savings separately against the benchmark, and treat home equity as a supplementary resource rather than a primary retirement funding tool.
Table of Contents
- Introduction: The Benchmarks and the Reality Gap
- How the Benchmarks Work: The Fidelity Salary-Multiplier Framework
- The Master Benchmark Table: All Ages at a Glance
- Savings by Age 30: The 1x Benchmark
- Savings by Age 40: The 3x Benchmark
- Savings by Age 50: The 6x Benchmark
- Savings by Age 60: The 8x Benchmark
- Where Americans Actually Stand: The Real Data
- The Mean vs. Median Problem: Why Headlines Mislead
- What to Do If You Are Behind at Every Decade
- The 2026 Contribution Limits: Your Catch-Up Toolkit
- Conclusion: The Benchmarks Are a Compass, Not a Verdict
- Frequently Asked Questions
- External References and Further Reading
The Benchmarks and the Reality Gap
How much should you have saved by the time you are 30, 40, 50, or 60? This is one of the most commonly asked personal finance questions, and it has a surprisingly specific answer: approximately one times your annual salary by 30, three times by 40, six times by 50, and eight times by 60. These benchmarks, developed and popularised by Fidelity Investments and broadly adopted across the financial planning industry, are the most widely cited savings targets in the US.The problem is that most Americans are not meeting them. By a wide margin. Federal Reserve data shows that the median American under 35 has approximately $18,880 in retirement accounts — against a Fidelity benchmark of one times salary, which on the typical US salary of around $58,000 implies a target of $58,000. The typical 30-year-old is about 67 percent below benchmark. The gap does not close meaningfully by 40 or 50: median 35 to 44 year olds have approximately $45,000, against a 3x benchmark of around $225,000.
This article explains the benchmarks, where they come from, what they actually assume, how Americans actually compare to them using the most current 2026 data from Vanguard, Fidelity, and the Federal Reserve, and what to do about the gap at every decade. The benchmarks are not a verdict. They are a compass.
How the Benchmarks Work: The Fidelity Salary-Multiplier Framework
The Fidelity salary-multiplier benchmarks are built on four specific assumptions that are worth understanding before applying the numbers to your own situation:- You save 15 percent of your income each year, including any employer match. T. Rowe Price's April 2026 analysis uses the same baseline and recommends starting at 6 percent at age 25, increasing by 1 percent annually until reaching the appropriate savings rate.
- You retire at 67, the full Social Security retirement age for most people born after 1960.
- You want to maintain roughly 80 percent of your pre-retirement income in retirement.
- Your portfolio earns an average of approximately 5.5 percent per year after fees over the long term.
The benchmarks include all retirement accounts: 401(k), IRA, and pension value. They do not include home equity, taxable brokerage accounts, or emergency savings. T. Rowe Price's April 2026 analysis puts the final target slightly higher than Fidelity's 10x: T. Rowe Price recommends saving 11 times your ending salary by retirement.
Fidelity and T. Rowe Price on the baseline: Both frameworks agree on the 15% savings rate (including employer match) as the appropriate baseline for most workers. T. Rowe Price's April 2026 guidance suggests starting at 6% at age 25 and increasing by 1% per year, which allows for gradual adjustment as income and financial priorities evolve.
The Master Benchmark Table: All Ages at a Glance
Savings by Age 30: The 1x Benchmark
The Fidelity benchmark for age 30 is one times your annual salary saved for retirement. On a salary of $58,000 (approximate US median for workers in their late 20s and early 30s), that implies $58,000 in retirement accounts. T. Rowe Price's analysis puts a slightly wider range of one to one-and-a-half times income as attainable for someone who has been saving since 25.Your 20s are typically the most financially constrained decade. Student loan repayments, entry-level salaries, housing costs, and major life transitions — first apartment, marriage, potentially children — compete with savings. The benchmark acknowledges this: reaching 1x salary by 30 requires starting contributions in your early to mid-20s, even at modest rates.
The most powerful action in your 20s is capturing your employer's full 401(k) match. This match is, functionally, an immediate 50 to 100 percent return on your contribution — the highest guaranteed return available to any investor. Every dollar of employer match you leave uncaptured is compensation you have earned and declined to receive. If the match requires contributing 6 percent of salary, contribute 6 percent minimum before anything else.
Time is the most valuable resource at age 30. A dollar saved at 25 compounds for 42 years to retirement at 67. A dollar saved at 35 compounds for 32 years. The 10-year difference in compounding, at even a modest 6 percent return, means the earlier dollar is worth approximately 1.8 times more at retirement. This is why the urgency to start — even at small amounts — is highest at this age.
Savings by Age 40: The 3x Benchmark
The Fidelity benchmark for age 40 is three times your annual salary. On a salary of $75,000 (a reasonable approximation of median earnings for workers in their late 30s and early 40s), that implies $225,000 in retirement accounts. This is where the gap between benchmark and reality becomes most stark.Reaching 3x by 40 typically requires having saved consistently through your 30s at or above the 15 percent rate. The 30s bring competing financial pressures: mortgages, childcare costs, education savings, and often the most rapid expansion of lifestyle spending. These years are also typically when income is accelerating, which makes it genuinely possible to increase savings rates meaningfully without reducing living standards.
Two specific mistakes are most common and most damaging in this decade. First, cashing out a 401(k) when changing jobs. According to Retirement Budget Calculator's May 2026 analysis, this single decision can cost tens of thousands in future retirement wealth through the combination of the 10 percent early withdrawal penalty, the ordinary income tax triggered, and the lost compounding on the withdrawn amount. Always roll over a 401(k) to the new employer's plan or to an IRA.
Second, pausing retirement contributions to fund children's college education. College funding has alternatives: scholarships, student loans, working during school. Retirement has no equivalent. As many financial advisers put it: you cannot take out a loan for retirement. Prioritise your own retirement savings before college funding, particularly through your 40s.
T. Rowe Price, April 2026: Having one to one-and-a-half times your income saved for retirement by age 35 is an attainable target for someone who starts saving at age 25. The key variable is starting early and maintaining a consistent rate through the financially complex years of the 30s.
Savings by Age 50: The 6x Benchmark
The Fidelity benchmark for age 50 is six times your annual salary. On a salary of $85,000 (a reasonable approximation of median earnings for workers in their late 40s), that implies $510,000. This is also the decade in which the IRS unlocks catch-up contributions — additional allowances that allow workers 50 and older to accelerate savings significantly.Your 50s are the final major accumulation decade. Retirement is no longer an abstract concept — it is 10 to 17 years away. This is the decade to do three things: accelerate contributions using catch-up provisions, get serious about your specific retirement income number, and develop your Social Security claiming strategy.
The Social Security decision is one of the highest-stakes choices in retirement planning. Claiming at 62 (the earliest possible age) locks in permanently reduced benefits — approximately 25 to 30 percent below the full retirement age amount. Delaying to 70 increases benefits by approximately 8 percent per year beyond full retirement age. The breakeven point for most people — the age at which delayed claiming pays off — is typically in the mid-to-late 70s. For people in good health with longevity in their family history, delay is almost always mathematically superior.
Asset allocation also deserves review in your 50s. Many people become too conservative too early — shifting to bonds and cash at 50 out of fear of market volatility. Wealthvieu's June 2026 analysis notes that at 45, a portfolio that is 70 percent stocks and 30 percent bonds is not aggressive; it is appropriate for a 20-plus-year time horizon. Moving to a CD-heavy portfolio at 50 often causes more long-term damage than a bear market would, because the reduced growth rate compounds over the many remaining years of both accumulation and retirement.
Savings by Age 60: The 8x Benchmark
The Fidelity benchmark for age 60 is eight times your annual salary. T. Rowe Price's range puts the appropriate target at 8 to 10 times at this age. On a salary of $90,000, Fidelity's 8x target implies $720,000. If full Social Security is expected at 67, this combined with 8x savings would theoretically maintain roughly 80 percent of pre-retirement income.At 60, the conversation begins to shift from savings accumulation to retirement income planning. The key questions change: not how much can I save, but how do I convert what I have saved into sustainable income? This shift involves:
- Withdrawal sequence planning: in retirement, the order in which you draw down different account types (taxable, tax-deferred, and tax-free Roth accounts) significantly affects both lifetime tax liability and portfolio longevity.
- Sequence-of-returns risk: the risk that a significant market decline in the first few years of retirement, when the portfolio is at its largest and withdrawals have begun, disproportionately damages long-term sustainability. A 20 percent market decline at age 70 is more damaging to retirement sustainability than the same decline at age 50, because there are fewer years of recovery before the portfolio is exhausted.
- Required Minimum Distributions (RMDs): from age 73, the IRS requires minimum withdrawals from most tax-deferred retirement accounts each year. Planning for RMDs in advance avoids being forced into higher tax brackets unexpectedly.
Where Americans Actually Stand: The Real Data
The numbers reveal a consistent and sobering pattern: at every age bracket, the median American's retirement savings falls well short of the Fidelity benchmark. And importantly, the average balance — the number most often cited in headlines — overstates where most people stand, because a small number of very high balances pull the average dramatically upward. The median is the number that reflects where the typical American actually is.
The Mean vs. Median Problem: Why Headlines Mislead
When media reports state that the average American has $167,970 in their 401(k) (Vanguard's How America Saves 2026 figure), this creates a misleading impression of typical retirement preparedness. The median 401(k) balance in the same report is $44,115. The gap between $167,970 and $44,115 is not a reporting error. It is the mathematical consequence of a highly skewed distribution.Consider: if nine people have $10,000 each and one person has $1,000,000, the average is $109,000 — far above what any of the nine typical people have. The median is $10,000, accurately reflecting where most people stand. US retirement savings follow exactly this pattern: a small percentage of very high-income savers with very large balances pull the mean up dramatically, while the majority of American workers have balances far below the average.
This matters for how you interpret your own situation. If you are significantly below the average figure you read in a news article, you are probably closer to the median than you think — which is still behind the Fidelity benchmark, but not as far behind as the headline average implies. Wealthvieu's analysis notes that 27 percent of Americans have zero savings entirely, which further compresses how meaningful averages are as a benchmark for the median worker.
What to Do If You Are Behind at Every Decade
If You Are Behind at 30The most powerful action is starting or increasing contributions immediately and capturing the full employer match. Even a 1 to 2 percent increase in your contribution rate — starting now rather than next year — has a compounding effect over the remaining 30-plus years to retirement. Automate your savings rate increase annually so that raises partially go to retirement before you adjust your spending to them.
If You Are Behind at 40
Review your asset allocation: many 40-year-olds are too conservatively invested, holding too much in bonds and cash because of anxiety about market volatility. With 25-plus years to retirement, a 70 to 80 percent equity allocation is appropriate and historically produces significantly better outcomes than a conservative allocation at this age. Eliminate high-interest consumer debt (credit cards, personal loans) aggressively, as 20-percent-APR debt compounds faster than most investment portfolios can grow.If You Are Behind at 50
Start catch-up contributions immediately. The additional $7,500 allowed in the 401(k) and $1,000 in the IRA for workers 50 and older can add $39,000 or more per year in contributions when combined with the standard limits. Develop a concrete Social Security strategy with a financial planner: the difference between claiming at 62 and delaying to 70 is often $100,000 to $300,000 in lifetime benefits.If You Are Behind at 60
You have approximately 7 years to full retirement age and roughly 25 to 30 years of retirement ahead. Maximise all retirement accounts. Run a formal retirement income projection that accounts for Social Security, any pension, expected spending, and healthcare costs. Consider working two to three years longer if feasible: each additional working year means one more year of contributions, one fewer year of withdrawals, higher Social Security benefits if delayed, and higher Medicare crediting.The 2026 Contribution Limits: Your Catch-Up Toolkit
The IRS catch-up provisions for workers 50 and older are one of the most valuable and most underutilised tools in retirement planning. Workers who can max out all available accounts from 50 to 67 can add $44,550 or more per year over 17 years — a total of over $757,000 in contributions alone, before investment growth. Even at the more realistic level of maxing the 401(k) and IRA combined ($39,000 per year), 17 years of maximum contributions generate approximately $663,000 in contributions, which with investment growth could approach or exceed the 10x benchmark for many workers.
Conclusion
The savings benchmarks — 1x salary by 30, 3x by 40, 6x by 50, 8x by 60 — tell you where you should be if you started saving at 25, maintained a 15 percent savings rate, and plan to retire at 67 on approximately 80 percent of your pre-retirement income. They are not a description of where most Americans are. They are a target.The Federal Reserve data is clear that most Americans are significantly behind these benchmarks at every age bracket. But being behind a benchmark is not a reason for despair — it is a reason for action. The 27 percent of Americans with zero savings are not necessarily condemned to a poor retirement: starting at 40 with zero and contributing maximally from that point forward produces a meaningfully better outcome than it might intuitively seem, particularly with Social Security providing a floor of income.
The most important insight from both the Fidelity and T. Rowe Price analyses is that the time to act is always now. The benchmarks describe an outcome. The levers that determine whether you reach them are within your control: your savings rate, your employer match capture, your investment allocation, your avoidance of early withdrawals, and your Social Security claiming decision. On every one of those levers, action today is worth more than the equivalent action next year, because every year's delay removes a year of compounding from your future balance.
Frequently Asked Questions
How much should you have saved by age 30?The Fidelity benchmark is one times your annual salary saved in retirement accounts by age 30. T. Rowe Price's range is one to one-and-a-half times salary. On a typical US salary of $58,000, this implies $58,000 to $87,000 in retirement accounts. Federal Reserve data shows the median American under 35 has approximately $18,880 in retirement accounts — approximately 67% below the Fidelity 1x benchmark on a typical salary.
How much should you have saved by age 40?
The Fidelity benchmark is three times your annual salary by age 40. T. Rowe Price's range is two to three times salary. On a salary of $75,000, this implies $150,000 to $225,000 in retirement accounts. Federal Reserve data shows the median 35-44 year old has approximately $45,000 — far below the 3x target. The most common mistakes of this decade are cashing out 401(k) accounts during job changes and raiding retirement savings for college tuition.
How much should you have saved by age 50?
The Fidelity benchmark is six times your annual salary by age 50. T. Rowe Price puts the target at 4.5 to 6 times salary. On a salary of $85,000, the 6x benchmark implies $510,000 in retirement accounts. Federal Reserve data shows the median 45-54 year old has approximately $115,000. Workers 50 and older can make catch-up contributions: up to $31,000 annually in a 401(k) and $8,000 in an IRA, for a total of $39,000 or more in tax-advantaged contributions per year.
How much should you have saved by age 60?
The Fidelity benchmark is eight times your annual salary by age 60. T. Rowe Price's range is eight to ten times salary. On a salary of $90,000, this implies $720,000 to $900,000. At 60, the focus should shift from accumulation to income planning: withdrawal sequencing, Social Security strategy, sequence-of-returns risk management, and Required Minimum Distribution planning from age 73.
What are the 2026 retirement contribution limits?
For 2026: 401(k)/403(b) standard limit is $23,500, with a $7,500 catch-up for workers 50 and older (total $31,000). IRA standard limit is $7,000, with a $1,000 catch-up (total $8,000). HSA individual limit is $4,300, with a $1,000 catch-up from age 55. Workers 50 and older who maximise all accounts can contribute $44,550 or more per year in tax-advantaged accounts.
What is the average 401(k) balance in 2026?
According to Vanguard's How America Saves 2026 report, the average 401(k) balance is $167,970, but the median is only $44,115. Fidelity's Q1 2026 data covering 25.6 million participants puts the overall average at $141,000. The large gap between average and median reflects the skewing effect of very high balances held by a small number of participants — the median is more representative of where most American workers actually stand.
What if I have $0 saved at 40?
Starting from zero at 40 is challenging but not hopeless. With 27 years to full retirement age (67), consistent contributions can still build meaningful retirement wealth. At a $75,000 salary, maximising a 401(k) at $23,500 per year from age 40 to 67 generates approximately $634,000 in contributions alone; with a 6% average annual return, this grows to over $1.5 million by 67. Additionally, Social Security provides a meaningful income floor that reduces the amount you need to self-fund entirely from savings.
Should I count my home equity in my savings benchmark?
The Fidelity and T. Rowe Price savings benchmarks specifically exclude home equity. They measure retirement accounts only: 401(k), IRA, and pension value. Home equity can provide retirement income through strategies such as downsizing or reverse mortgages, but it is not as liquid or reliable as retirement account savings. Track retirement account savings separately against the benchmark, and treat home equity as a supplementary resource rather than a primary retirement funding tool.
0 Comments
Be the first to share your thoughts on this article.