
Savings
US Saving Rate Studies 2026: The Complete Data
Table of Contents
- What the Personal Saving Rate Actually Measures
- Six Decades of Decline: The Historical Picture
- The 2026 Decline: Three Consecutive Months Down
- How Saving Behaviour Varies by Income: The Polarisation Story
- The Financial Stress Connection
- What the Research Suggests Households Can Do
- Conclusion
- Frequently Asked Questions (FAQ)
- External References
Americans saved just 3.6% of their disposable income in March 2026, according to the US Bureau of Economic Analysis - down from 4.5% in January and 4.0% in February, three consecutive monthly declines even as personal income continued to grow. Set against the 66-year historical average of 8.4%, this means the country is currently saving at less than half its long-run norm, a gap that has become one of the most closely studied and debated indicators in American household finance.
The personal saving rate, formally defined by the BEA as personal saving expressed as a percentage of disposable personal income, is far more than an abstract statistic. It is the most direct available measure of the cushion American households are building, or failing to build, against job loss, medical emergencies, and the ordinary financial shocks of daily life. When that cushion shrinks while measured income simultaneously rises, as the current data shows, something specific is consuming the difference - and recent studies from the BEA, the Federal Reserve, the Yale Budget Lab, and the National Endowment for Financial Education together paint an unusually clear picture of exactly what that something is.
This guide draws together the most current and historically grounded research on the US personal saving rate: where the rate sits today, how it compares to six decades of historical data, the specific forces driving its 2026 decline, how saving behaviour varies sharply by income level, and what the research suggests households can realistically do in response. The picture that emerges is neither a story of simple irresponsibility nor of an entirely unavoidable structural inevitability, but a measurable, well-documented squeeze between flat-to-declining real purchasing power and a set of rising, largely unavoidable costs.
What the Personal Saving Rate Actually Measures
The personal saving rate is calculated and published monthly by the Bureau of Economic Analysis as part of its Personal Income and Outlays release, and is also tracked continuously through the Federal Reserve Bank of St. Louis's FRED database under the series code PSAVERT. The calculation is straightforward in concept: total personal saving (disposable personal income minus personal outlays, which include consumption, interest payments, and transfers) expressed as a percentage of total disposable personal income, seasonally adjusted and reported at an annual rate.Because the measure is calculated at the aggregate, national level, it captures the saving behaviour of the population as a whole rather than any single household, and it is sensitive to a wide range of factors beyond individual willpower or financial discipline: aggregate wage growth, inflation in essential spending categories, interest rates on both savings and debt, and one-off events such as tax rebates or emergency stimulus payments, all of which move the headline figure independent of any change in how individual households are actually behaving.
Why the pandemic spike matters for interpreting the data: The personal saving rate reached an all-time record high of 31.8% in April 2020, driven by a combination of stimulus payments, sharply reduced discretionary spending opportunities during lockdowns, and acute economic uncertainty prompting precautionary saving. This extraordinary, temporary spike is the primary reason the 2020s decade average (8.7%) appears healthier than the underlying current trend - excluding 2020-2021, the more recent monthly readings sit considerably below even the already-declining 2010s average of 6.5%.
Six Decades of Decline: The Historical Picture
Long-run BEA and Trading Economics data reveals a clear, multi-decade secular decline in the US personal saving rate, periodically interrupted but never reversed for long. The table below presents the decade-by-decade picture: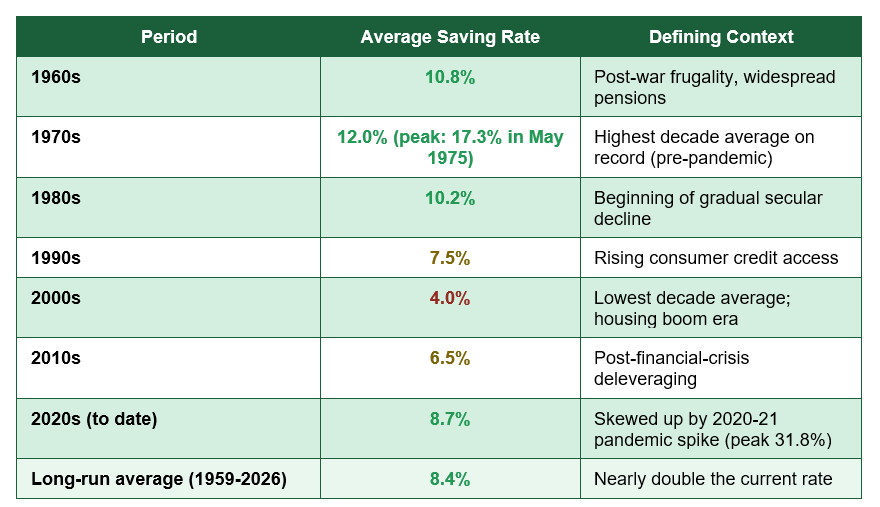
Long-run average vs current rate: 8.4% average vs 3.6% in March 2026 — the current reading sits at less than half the 66-year historical norm, and below every full decade average except the 2000s, which itself ended in the 2008 financial crisis (BEA / FRED PSAVERT, 1959-2026).
This decline has not been linear or uniform. The saving rate peaked at an extraordinary 17.3% in May 1975, reflecting a combination of post-war frugality, near-universal defined-benefit pension coverage that reduced the need for personal retirement saving, and comparatively limited access to consumer credit. By contrast, the 2000s - the decade culminating in the 2008 financial crisis - recorded the lowest full-decade average on record at just 4.0%, a period widely associated with the rise of home equity borrowing as a substitute for traditional saving and increasingly widespread consumer credit access.
The 2026 Decline: Three Consecutive Months Down
The most current BEA data shows a specific, recent downward trend worth examining in detail: the personal saving rate fell from 4.5% in January 2026 to 4.0% in February and 3.6% in March - three consecutive monthly declines occurring, notably, during a period in which personal income continued to grow in nominal terms. This divergence between rising income and falling savings is, according to multiple studies analysing the period, the single most important detail for understanding what is actually happening to American household finances in 2026.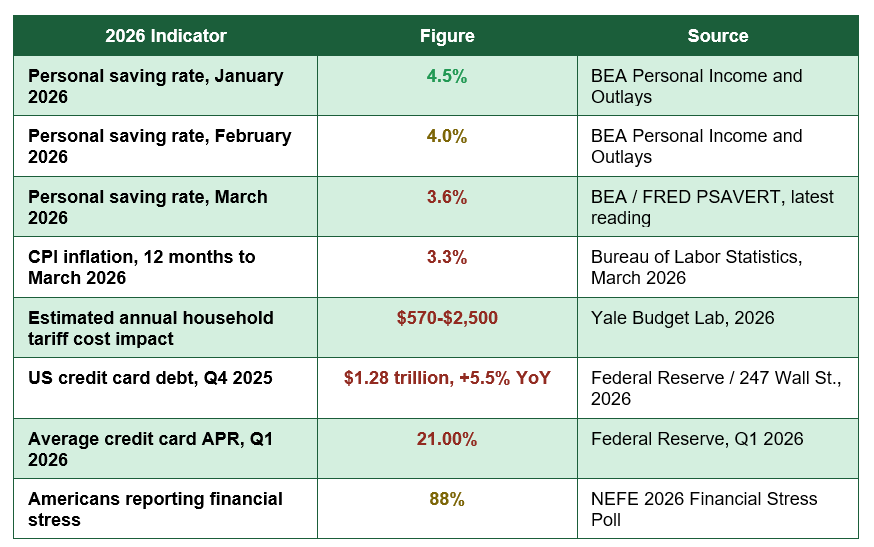
Research compiled from BEA, BLS, and Yale Budget Lab data identifies three specific, compounding forces behind this divergence. First, inflation in essential, largely unavoidable spending categories has remained persistent: the Consumer Price Index rose 3.3% over the twelve months to March 2026, with housing, utilities, and food categories rising even faster than the headline figure in many cases - costs that cannot easily be deferred or reduced regardless of a household's saving intentions.
Second, the Yale University Budget Lab estimates that 2026 tariff policy is adding between $570 and $2,500 to the average household's annual costs, with the Federal Reserve's own analysis attributing roughly one percentage point of overall inflation directly to tariff effects - a cost increase that, unlike many inflationary pressures, can be traced to a specific and relatively recent policy change rather than broader macroeconomic conditions.
Third, and perhaps most significant for the saving rate specifically, rising reliance on credit card debt is functioning as a direct substitute for saving among a meaningful share of households. US credit card debt reached $1.28 trillion in the fourth quarter of 2025, a 5.5% annual increase, with the average cardholder carrying a balance now owing $7,886. At the prevailing average APR of 21.00% in Q1 2026, that balance generates approximately $1,655 in interest charges annually - money that, as one analysis bluntly put it, 'could be going into savings. Instead, it's going to a credit card company.'
How Saving Behaviour Varies by Income: The Polarisation Story
National aggregate saving rate figures, while useful for tracking overall trends, can obscure significant variation in saving behaviour across the income distribution. Research jointly conducted by the Bureau of Labor Statistics and BEA using Consumer Expenditure Survey data has specifically examined this polarisation, finding that the aggregate saving rate increasingly reflects a small share of higher-income households saving substantially, while a much larger share of middle- and lower-income households save little or nothing, and in many cases run persistent deficits financed through credit.This pattern has significant implications for how the headline saving rate should be interpreted: a national figure of 3.6% does not mean most American households are saving roughly 3.6% of their income. It is more consistent with a distribution in which a meaningful share of households, particularly those with limited discretionary income after covering housing, food, and debt service costs, are saving close to zero or actively drawing down what limited savings they have, while the aggregate figure is partially supported by stronger saving rates among higher-income households with greater capacity to absorb rising costs without reducing their saving contributions.
The emergency fund gap this produces: This polarisation in saving behaviour is consistent with persistently weak emergency fund coverage reported in Bankrate's annual surveys, which have repeatedly found that a majority of Americans cannot comfortably cover an unexpected expense of $1,000 using savings alone, even during periods when the aggregate national saving rate has been reported as positive and, on the surface, broadly stable.
The Financial Stress Connection
The National Endowment for Financial Education's 2026 Financial Stress Poll provides a useful complement to the purely numerical saving rate data, finding that 88% of Americans report experiencing some form of financial stress - a figure consistent with, and arguably explained by, the combination of a declining saving rate, rising essential costs, and growing reliance on high-interest credit documented across the other research reviewed in this guide.This connection between the quantitative saving rate data and self-reported financial stress is methodologically important: it confirms that the declining saving rate is not simply a statistical artefact of how the BEA calculates disposable income, but corresponds to a genuine, widely felt deterioration in household financial security that respondents are independently reporting through entirely separate survey methodology. When multiple, methodologically distinct studies - a national accounts calculation from the BEA, a credit bureau-based debt tracking series from the Federal Reserve, and a direct consumer stress survey from NEFE - all point toward the same underlying conclusion, the overall picture becomes considerably more credible than any single data source in isolation.
What the Research Suggests Households Can Do
While the structural drivers behind the declining national saving rate - inflation, tariff effects, and aggregate wage stagnation relative to costs - are largely beyond any individual household's control, the research reviewed in this guide points toward several specific, evidence-based actions with a meaningful effect at the household level:- Address high-interest credit card debt as a saving rate priority, not a separate problem: With the average cardholder paying approximately $1,655 annually in interest at a 21.00% APR, eliminating or substantially reducing revolving credit card debt functions as a direct, guaranteed improvement to household saving capacity - every dollar redirected from interest payments to either debt principal or savings has an immediate, calculable effect.
- Treat saving as a fixed, automated cost rather than a discretionary afterthought: Given that the data shows saving capacity being squeezed primarily by rising fixed and semi-fixed costs (housing, utilities, debt service), automating even a modest savings transfer on payday - before discretionary spending occurs - helps protect a saving habit against the same budget pressures eroding the national aggregate figure.
- Build awareness of where your own household sits relative to the income-based polarisation pattern: Understanding that the national saving rate figure masks significant variation by income can help households accurately benchmark their own situation; a middle-income household saving little or nothing is statistically typical of the current environment, not necessarily a sign of unusual financial mismanagement.
- Prioritise an emergency fund specifically, given the persistent coverage gap documented in Bankrate's research: Even a modest emergency fund, built incrementally, directly addresses the specific vulnerability - inability to cover an unexpected $1,000 expense without borrowing - most consistently identified across multiple independent studies as the most acute manifestation of the declining saving rate at the household level.
- Track essential cost categories specifically, rather than overall spending in aggregate: Since the documented drivers of reduced saving capacity are concentrated in largely unavoidable categories (housing, utilities, food, tariff-affected goods), identifying which of these specific categories has grown fastest in your own budget provides a more actionable diagnostic than a general sense that 'everything costs more.'
Conclusion
The body of US saving rate research available in 2026 tells a consistent, multi-source-confirmed story: the personal saving rate has fallen to 3.6% as of March 2026, less than half the 66-year historical average of 8.4%, driven by a specific and well-documented combination of persistent inflation in essential spending categories, measurable tariff-related cost increases, and a growing reliance on high-interest credit card debt that is functioning, for a meaningful share of households, as a direct substitute for saving rather than a complement to it.Critically, this is not simply a story about individual financial discipline. The research on income-based polarisation in saving behaviour, the BEA's own national accounts data showing income rising while the saving rate simultaneously falls, and NEFE's independent finding that 88% of Americans report financial stress all point toward a structural squeeze between costs and incomes that no reasonable degree of individual budgeting discipline alone can fully offset for a large share of the population. At the same time, the data also identifies specific, addressable levers - particularly high-interest credit card debt, which alone is costing the average balance-carrying household over $1,600 a year in interest - where individual household action can produce a measurable, immediate improvement.
For anyone examining their own saving rate against this backdrop, the most useful conclusion from this body of research is not simply 'save more,' but a more specific and actionable framework: understand which of the documented structural pressures are affecting your own household most directly, address the highest-cost, most controllable factor (typically high-interest debt) first, and benchmark your own saving behaviour against the realistic, income-adjusted picture the research reveals rather than against the headline national average alone, which, as this body of studies makes clear, conceals as much as it reveals about how American households are actually faring.
Frequently Asked Questions (FAQ)
What is the current US personal saving rate?
According to the Bureau of Economic Analysis, the US personal saving rate was 3.6% in March 2026, the most recent reading available at the time of writing, having fallen from 4.5% in January and 4.0% in February of the same year. This compares to a 66-year historical average of 8.4% calculated from BEA data spanning 1959 through 2026.Why is the US personal saving rate falling even though incomes are rising?
Research from the BEA, BLS, and Yale Budget Lab identifies three primary, compounding factors: persistent inflation in essential spending categories (CPI rose 3.3% over the twelve months to March 2026, with housing and utilities often rising faster than the headline figure), an estimated $570 to $2,500 in additional annual household costs attributed to 2026 tariff policy, and rapidly growing credit card debt, which reached $1.28 trillion in Q4 2025 and is increasingly functioning as a substitute for saving among households unable to keep pace with rising costs through income alone.How does the current saving rate compare to historical levels?
The current rate of 3.6% sits well below every full-decade average on record except the 2000s (4.0%), and dramatically below the historical peaks of the 1960s and 1970s, when decade averages reached 10.8% and 12.0% respectively, supported by widespread defined-benefit pension coverage and limited consumer credit access. The all-time record high was 31.8% in April 2020, an extraordinary, temporary spike driven by pandemic-era stimulus payments and restricted spending opportunities, not representative of underlying long-term trends.Does the national saving rate apply equally to all American households?
No. Joint BLS/BEA research using Consumer Expenditure Survey data has documented significant polarisation in saving behaviour across the income distribution, finding that a relatively small share of higher-income households account for a disproportionate share of aggregate saving, while many middle- and lower-income households save little or nothing, and in some cases run persistent deficits financed through credit. The national aggregate figure should therefore be understood as a population-wide average rather than representative of any typical individual household's saving behaviour.What is the single most impactful action a household can take in response to this data?
Based on the research reviewed, addressing high-interest credit card debt offers the most directly measurable improvement to household saving capacity for those carrying a balance. With the average cardholder owing $7,886 at a 21.00% average APR, this generates approximately $1,655 in annual interest charges - a guaranteed, calculable cost that, once eliminated or reduced, converts directly into either debt-free spending capacity or genuine savings, unlike many of the broader inflationary and policy-driven cost pressures documented in this guide, which are largely outside any individual household's direct control.
External References
The following authoritative sources were used in researching this article and are recommended for further reading:1. U.S. Bureau of Economic Analysis - Personal Saving Rate
https://www.bea.gov/data/income-saving/personal-saving-rate
2. Federal Reserve Bank of St. Louis (FRED) - Personal Saving Rate (PSAVERT)
https://fred.stlouisfed.org/series/PSAVERT
3. U.S. Bureau of Labor Statistics - Consumer Price Index
https://www.bls.gov/cpi/
4. Yale University Budget Lab - Tariff Cost Analysis 2026
https://budgetlab.yale.edu/
5. National Endowment for Financial Education (NEFE) - 2026 Financial Stress Poll
https://www.nefe.org/research/polls/default.aspx
6. Bankrate - Annual Emergency Savings Report 2026
https://www.bankrate.com/banking/savings/emergency-savings-report/
7. Investment Company Institute (ICI) - US Retirement Assets Data
https://www.ici.org/research/stats/retirement
8. Trading Economics - United States Personal Saving Rate Historical Data
https://tradingeconomics.com/united-states/personal-saving-rate-percent-m-saar-fed-data.html

0 Comments Comments