

Retirement
Europe’s Richest Retirees: Where Does the UK Rank?
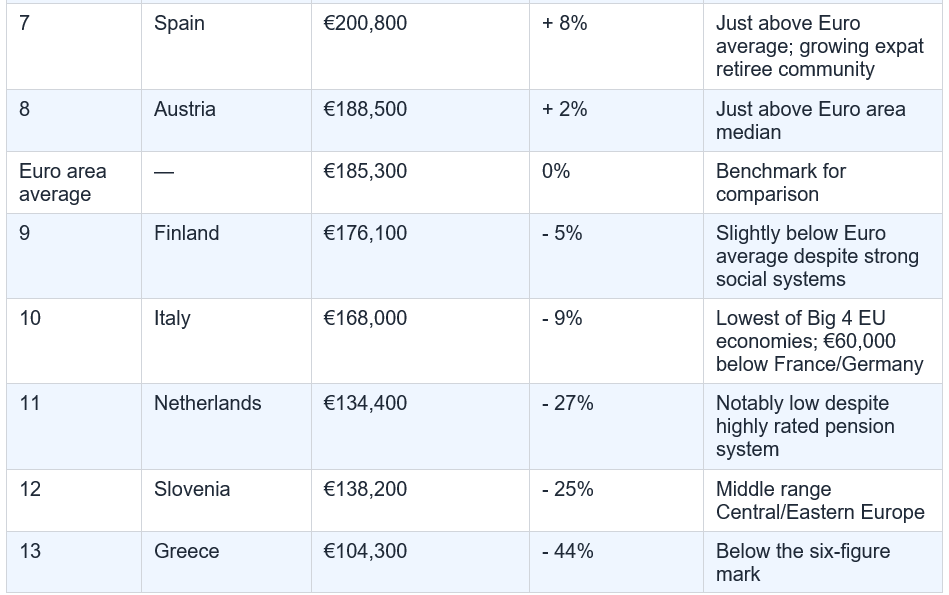
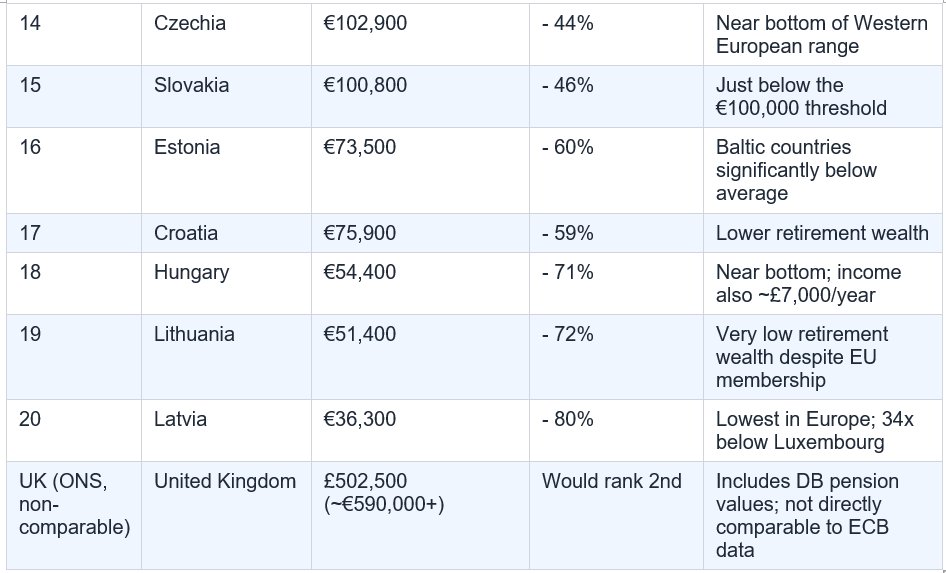
Key Statistics: UK median household wealth (aged 65–74): £502,500 (ONS) — which would place the UK second only to Luxembourg in European rankings (Fidelity analysis, 3 August 2026). Euro area median net wealth (aged 65–74): €185,300 (ECB Household Finance and Consumption Survey, 2023 wave). Luxembourg: €1,219,500 (clear outlier). Malta: €310,000. Belgium: €307,700. Ireland: €296,700. France: €232,800. Germany: €232,100. Spain: €200,800. Austria: €188,500. Italy (lowest of Big 4): €168,000. Netherlands: €134,400. Latvia (lowest): €36,300. 34x wealth gap between Luxembourg (€1.2m) and Latvia (€36,300). UK disposable retirement income: just under £30,000/year (ONS); estimated gross ~£34,000–35,000 would rank UK relatively well vs European peers. Luxembourg pre-tax income (over-65s): £80,000+. Hungary/Lithuania: ~£7,000/year. Norway: Global Retirement Index #1 (Natixis 2025, reclaimed from Switzerland). UK retirees’ income as % of national average: ~91% (around the middle of European pack). Countries where retirees earn above national average: Italy, Luxembourg, Spain, Portugal. 200,000 British pensioners reside permanently in Spain. UK State Pension 2026/27: £221.20/week (£11,502/year). NHS: provides healthcare free at point of use — a major uncounted advantage in wealth comparisons. One in four German retirees seriously considers relocating.
The answer, according to Fidelity’s August 2026 analysis published on 3 August, is that UK retirees come out relatively well — but the picture is significantly more nuanced than any single headline figure can capture. Fidelity’s analysis, combining new ONS data on UK household wealth with the European Central Bank’s comprehensive Household Finance and Consumption Survey of 22 European countries, provides the most detailed cross-continental retirement wealth comparison available for 2026.
The headline finding: UK households headed by someone aged 65 to 74 typically have total wealth of £502,500, according to the ONS. This figure, when placed alongside the ECB’s European data, would rank the UK second in Europe for retirement wealth — behind only Luxembourg, which is an extreme outlier with median retirement household wealth of €1,219,500. The UK figure comfortably exceeds the euro area median of €185,300 and sits well above France (€232,800), Germany (€232,100), and Spain (€200,800).
But wealth is only part of the story. Income, the cost of living, the value of state healthcare, and the broader quality of retirement differ enormously across Europe in ways that a simple wealth ranking does not capture. This article works through the full picture.
The UK data comes from the Office for National Statistics’ Wealth and Assets Survey, which measures total wealth including financial wealth, property wealth, pension wealth, and physical assets. This figure is presented in sterling and requires a currency conversion for direct comparison with the European data.
Fidelity’s August 2026 analysis is explicit about the comparison’s limitations: although the UK and European surveys measure broadly similar things, they are not identical, which is why the UK data is not included in the European ranking table but is presented alongside it for context. Specifically, the UK ONS measure includes benefits accrued in workplace final salary (defined benefit) pension schemes, whereas the ECB’s European survey does not generally include occupational pension entitlements in the wealth calculation. This difference in methodology means the UK wealth figure is likely inflated relative to the European comparators.
Key Insight: The UK’s £502,500 median retirement household wealth figure likely appears higher than equivalent European figures partly because it includes the estimated value of defined benefit pension entitlements. If UK pensions were measured on the same basis as most European surveys, the comparison would be less dramatic. But even adjusted for this, UK retirees appear genuinely wealthy by European standards.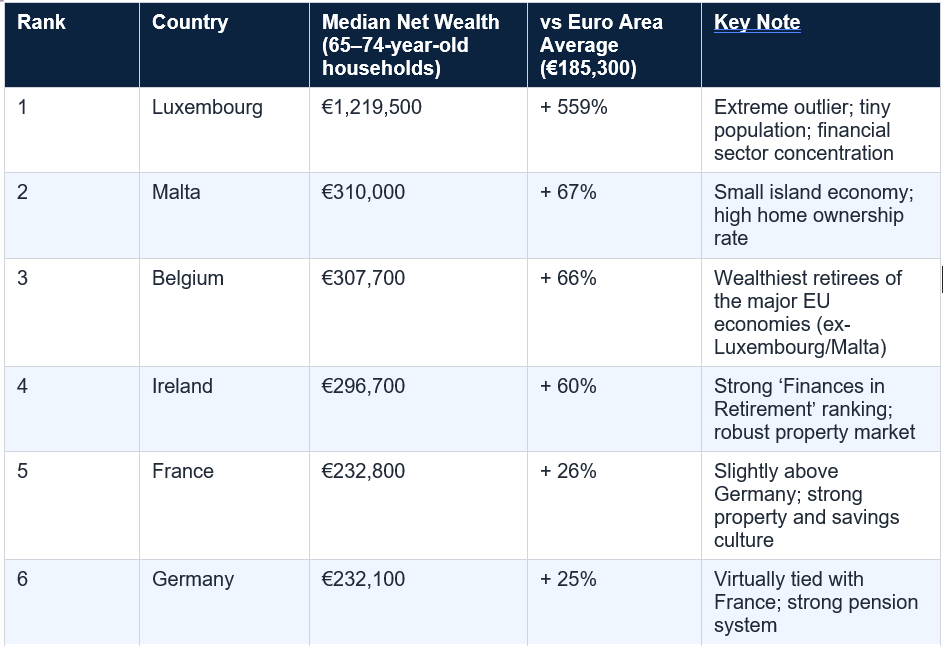
The Fidelity analysis is careful to note the methodological caveat: the surveys are not identical, and the UK figure is therefore presented separately rather than being included in a direct comparison table. But even with this caveat acknowledged, the broad conclusion holds: UK retirees are, by the standard of European peers, wealthy. Significantly wealthier than the euro area average. Wealthier than retirees in France, Germany, Spain, Italy, and the Netherlands.
Fidelity UK, 3 August 2026 (Marianna Hunt): The gap between how much wealth people retire with across Europe is striking. Although the data doesn’t cover the UK, we have similar numbers from the Office for National Statistics. These show that UK households headed by someone aged 65–74 typically have total wealth of £502,500 — which would place the UK second only to Luxembourg.
The 34-fold gap between Luxembourg (€1.2 million) and Latvia (€36,300) at the extremes of the European table is the most dramatic illustration of how divergent retirement outcomes are across the continent. European retirement wealth is not evenly distributed by geography, by pension system generosity, or by historical economic performance. It is driven by a combination of property wealth, private savings, pension system structure, and decades of national economic trajectory.
The income picture across Europe is as divergent as the wealth picture:
Key Insight: Wealth and income measure different things. A UK homeowner with £400,000 of property equity and no cash pension may appear wealthy in a survey but struggles to convert that wealth into monthly income without selling their home. A Dutch retiree with a smaller property but a generous occupational pension may feel far more financially comfortable day to day.
Fidelity’s analysis examined this by looking at the disposable incomes of people aged 66 to 75 relative to the average income of the population in each country. The findings are illuminating:
The Fidelity analysis notes this explicitly: in countries where healthcare requires significant private spending or insurance, a larger portion of retirement wealth must be preserved as a buffer rather than used for lifestyle spending. UK retirees who can rely on the NHS for hospital treatment, GP care, and specialist referrals have effectively pre-funded a large insurance policy that their European peers must budget for separately.
Quantifying this advantage is difficult, but Fidelity US research suggests that healthcare is the single largest financial risk in retirement for American retirees. UK retirees, by comparison, face a structurally lower healthcare cost burden that frees retirement wealth and income for other purposes.
But the Fidelity analysis’s most important insight is that wealth is only part of the picture. The Netherlands has modest measured wealth but excellent pension income. Italy has a generous state pension replacement rate but limited private wealth. The UK has substantial property and pension wealth but a state pension that is modest by European standards and significant inequality beneath the median figure.
The 34-fold wealth gap between Luxembourg and Latvia is a reminder that Europe is not a single retirement experience. It is 22 (or more) distinct retirement experiences shaped by history, policy, property markets, pension design, and cultural attitudes toward saving and spending. The UK sits near the top of that distribution by the wealth measure. Whether UK retirees feel near the top depends on where they live, what their pension income is, whether they own their home, and whether they are comparing themselves to Latvia or Luxembourg.
The most useful conclusion from the European comparison is not a ranking. It is a reminder that building financial security in retirement is a long-term project that benefits from starting early, maximising employer contributions, protecting State Pension entitlement, and planning for income — not just accumulated wealth. The UK’s second-place European ranking is a snapshot of where careful saving over decades has delivered. It is not a guarantee for those currently in their 30s, 40s, or 50s who have not yet built that foundation.
According to Fidelity’s August 2026 analysis, UK households headed by someone aged 65–74 typically have total wealth of £502,500 (ONS data). When compared against the ECB’s Household Finance and Consumption Survey of 22 European countries, this figure would place the UK second only to Luxembourg (€1,219,500). The euro area median for the same age group is €185,300. Belgium (€307,700) and Ireland (€296,700) are the wealthiest major European retiree populations within the ECB data.
Which European country has the wealthiest retirees?
Luxembourg has the highest median retirement household wealth in Europe by a wide margin: €1,219,500 for households aged 65 to 74, according to the ECB’s HFCS 2023 wave. This is more than six times the euro area average of €185,300 and 34 times higher than Latvia (€36,300), the lowest country in the survey. Luxembourg’s extreme position reflects its role as a financial centre, its high average wages, and its small population. Excluding Luxembourg, the wealthiest major retiree populations are in Belgium, Ireland, France, and Germany.
Why does the Netherlands have low retirement wealth despite a good pension system?
The Netherlands is consistently rated as having one of the world’s best pension systems, yet Dutch retirees have median household wealth of just €134,400 — significantly below the euro area average. This is because the Dutch system delivers retirement income through generous, mandatory occupational pensions rather than through private wealth accumulation. Dutch retirees do not need large pools of personal savings because their pension income is reliable and generous. They are income-rich by European standards but asset-modest by the ECB’s wealth measure.
How does UK retirement income compare to Europe?
The UK does not have directly comparable pre-tax income data for older households. The ONS measures disposable income for retired households at just under £30,000 per year. Fidelity’s August 2026 analysis estimates this implies a gross pre-tax income of approximately £34,000–£35,000, which would rank the UK relatively well against most European peers. Luxembourg has the highest older household income at over £80,000 per year; Hungary and Lithuania have the lowest at around £7,000 per year.
Do UK retirees feel wealthy compared to the rest of the UK population?
On this measure, the UK sits around the middle of the European pack. UK retirees enjoy disposable incomes worth approximately 91% of the national average — meaning retirees are slightly less well-off than the working population on average, but not dramatically so. In contrast, in Italy, Luxembourg, Spain, and Portugal, retirees actually have higher disposable incomes than the national average, meaning they feel particularly comfortable relative to younger generations.
What does the UK State Pension pay in 2026/27?
The full new UK State Pension pays £221.20 per week (£11,502 per year) in 2026/27. To receive the full amount, you need 35 qualifying years of National Insurance contributions. The UK State Pension represents a smaller proportion of pre-retirement earnings than many European state pensions, which is why UK private pension saving is more important than in countries with more generous state provision. Checking your NI record and paying to fill gaps where it is cost-effective is one of the highest-return financial decisions available to those approaching retirement.
What is the best country in Europe to retire to?
According to the Natixis Global Retirement Index 2025 (which evaluates 44 countries on 18 indicators including finances, material wellbeing, health, and quality of life), Norway reclaimed the top global ranking in 2025, having consistently ranked in the top three for a decade. Denmark climbed to 5th. Within the EU, Ireland ranks strongly on finances in retirement. Portugal and Spain are popular with British retirees for climate, cost of living, and lifestyle, with an estimated 200,000 British pensioners living permanently in Spain.
Table of Contents
- The Question Every UK Saver Asks
- The Data: How Was This Measured?
- The Wealth Rankings: Where Does Every Country Stand?
- The UK’s Position: Second in Europe?
- Why UK Wealth Looks Higher Than European Counterparts
- Beyond Wealth: How Does UK Retirement Income Compare?
- How Rich Do Retirees Feel Relative to Their Own Country?
- The Countries That Outperform Their Wealth Ranking
- The Countries That Disappoint Despite High Pensions
- The Four Lessons From the Data
- What the Headline Numbers Miss
- The NHS: The Hidden Advantage the Wealth Tables Cannot Capture
- How UK Retirees Can Build Greater Financial Security
- Conclusion: Second in Wealth, But How Well-Off Do UK Retirees Feel?
- Frequently Asked Questions
The Question Every UK Saver Asks
If you have spent decades paying into a pension, building equity in your home, and accumulating savings, you might occasionally wonder: how does your retirement actually compare to people elsewhere in Europe? Is the UK a good place to be a retiree relative to France, Germany, Spain, or the Netherlands? Are British pensioners better or worse off than their continental counterparts?The answer, according to Fidelity’s August 2026 analysis published on 3 August, is that UK retirees come out relatively well — but the picture is significantly more nuanced than any single headline figure can capture. Fidelity’s analysis, combining new ONS data on UK household wealth with the European Central Bank’s comprehensive Household Finance and Consumption Survey of 22 European countries, provides the most detailed cross-continental retirement wealth comparison available for 2026.
The headline finding: UK households headed by someone aged 65 to 74 typically have total wealth of £502,500, according to the ONS. This figure, when placed alongside the ECB’s European data, would rank the UK second in Europe for retirement wealth — behind only Luxembourg, which is an extreme outlier with median retirement household wealth of €1,219,500. The UK figure comfortably exceeds the euro area median of €185,300 and sits well above France (€232,800), Germany (€232,100), and Spain (€200,800).
But wealth is only part of the story. Income, the cost of living, the value of state healthcare, and the broader quality of retirement differ enormously across Europe in ways that a simple wealth ranking does not capture. This article works through the full picture.
The Data: How Was This Measured?
The primary European source is the Household Finance and Consumption Survey (HFCS), conducted by the European Central Bank and published in its 2023 wave. It provides data on the median net wealth of households aged 65 to 74 across 22 European countries. The HFCS measures total household wealth including property, savings, investments, and private pensions, presented in euros for consistency across the eurozone and non-eurozone members.The UK data comes from the Office for National Statistics’ Wealth and Assets Survey, which measures total wealth including financial wealth, property wealth, pension wealth, and physical assets. This figure is presented in sterling and requires a currency conversion for direct comparison with the European data.
Fidelity’s August 2026 analysis is explicit about the comparison’s limitations: although the UK and European surveys measure broadly similar things, they are not identical, which is why the UK data is not included in the European ranking table but is presented alongside it for context. Specifically, the UK ONS measure includes benefits accrued in workplace final salary (defined benefit) pension schemes, whereas the ECB’s European survey does not generally include occupational pension entitlements in the wealth calculation. This difference in methodology means the UK wealth figure is likely inflated relative to the European comparators.
Key Insight: The UK’s £502,500 median retirement household wealth figure likely appears higher than equivalent European figures partly because it includes the estimated value of defined benefit pension entitlements. If UK pensions were measured on the same basis as most European surveys, the comparison would be less dramatic. But even adjusted for this, UK retirees appear genuinely wealthy by European standards.
The Wealth Rankings: Where Does Every Country Stand?
The UK’s Position: Second in Europe?
The headline from Fidelity’s August 2026 analysis is striking: UK households headed by someone aged 65 to 74 typically have total wealth of £502,500, according to the ONS. If this figure is converted to euros at current exchange rates, it comfortably exceeds every country in the ECB’s survey except Luxembourg. Belgium’s €307,700 and Ireland’s €296,700 — the wealthiest major European retiree populations in the ECB data — are both significantly below the UK’s implied position.The Fidelity analysis is careful to note the methodological caveat: the surveys are not identical, and the UK figure is therefore presented separately rather than being included in a direct comparison table. But even with this caveat acknowledged, the broad conclusion holds: UK retirees are, by the standard of European peers, wealthy. Significantly wealthier than the euro area average. Wealthier than retirees in France, Germany, Spain, Italy, and the Netherlands.
Fidelity UK, 3 August 2026 (Marianna Hunt): The gap between how much wealth people retire with across Europe is striking. Although the data doesn’t cover the UK, we have similar numbers from the Office for National Statistics. These show that UK households headed by someone aged 65–74 typically have total wealth of £502,500 — which would place the UK second only to Luxembourg.
The 34-fold gap between Luxembourg (€1.2 million) and Latvia (€36,300) at the extremes of the European table is the most dramatic illustration of how divergent retirement outcomes are across the continent. European retirement wealth is not evenly distributed by geography, by pension system generosity, or by historical economic performance. It is driven by a combination of property wealth, private savings, pension system structure, and decades of national economic trajectory.
Why UK Wealth Looks Higher Than European Counterparts
The UK’s elevated position in the European retirement wealth comparison is driven by several structural factors that distinguish British retirement saving from continental models:Defined Benefit Pension Inclusion
The ONS Wealth and Assets Survey includes the estimated capital value of defined benefit (final salary) pension entitlements. These are the pensions that pay a guaranteed income for life based on salary and years of service — common in UK public sector employment and in legacy private sector schemes. The capital value of a pension paying, for example, £15,000 per year for life can be estimated at £300,000 or more. The ECB’s HFCS does not generally include this form of pension wealth in European countries’ totals. This methodological difference inflates the UK’s apparent wealth relative to European counterparts.Property Wealth
The UK has among the highest home ownership rates in Europe for older households, combined with house price growth that has been exceptional over the past three decades. A homeowner who bought a property in London or the South East in the 1980s or 1990s and has paid off their mortgage is sitting on property wealth that places them well above any European average. For most UK households, the home is their single largest asset.Property Transaction Costs as a Barrier
Fidelity’s analysis notes an important caveat about property wealth: it is not easily accessible. Expensive property transaction taxes, including stamp duty, make it difficult for UK retirees to convert property wealth into spendable cash without downsizing significantly or borrowing against the property. A UK retiree with £400,000 of property equity and £100,000 of pension savings has £502,500 on paper but may feel much less wealthy in practice.Beyond Wealth: How Does UK Retirement Income Compare?
Wealth and income are related but distinct measures of retirement wellbeing. The ECB’s data includes pre-tax income data for older European households as well as wealth. The UK does not have a directly comparable measure but ONS data on disposable income for retired households provides a useful proxy.The income picture across Europe is as divergent as the wealth picture:
- Luxembourg: the highest-income retirees in Europe by a significant margin, with typical older household pre-tax income exceeding £80,000 per year.
- Hungary and Lithuania: at the lower end, the median annual income for older households is around £7,000 per year — sufficient only with very low living costs and comprehensive state support.
- UK: ONS data on average disposable income among retired households is just under £30,000 per year. Fidelity’s analysis estimates this implies a pre-tax gross income of approximately £34,000 to £35,000 — which would rank the UK relatively well against European peers, though not at the very top of the table.
Key Insight: Wealth and income measure different things. A UK homeowner with £400,000 of property equity and no cash pension may appear wealthy in a survey but struggles to convert that wealth into monthly income without selling their home. A Dutch retiree with a smaller property but a generous occupational pension may feel far more financially comfortable day to day.
How Rich Do Retirees Feel Relative to Their Own Country?
A third dimension of the retirement wealth picture is relative income: how do older people’s incomes compare to the working-age population in the same country? This measure captures whether retirees feel wealthy or comfortable by the standards of their own society rather than by an international comparison.Fidelity’s analysis examined this by looking at the disposable incomes of people aged 66 to 75 relative to the average income of the population in each country. The findings are illuminating:
- The UK sits around the middle of the European pack on this measure, with older people enjoying incomes worth approximately 91 percent of the national average. UK retirees do not feel noticeably richer or poorer than the general UK population.
- In Italy, Luxembourg, Spain, and Portugal, retirees actually have higher average disposable incomes than the population as a whole. Older people in these countries likely feel particularly comfortable relative to younger generations — a reflection of generous defined benefit pension entitlements, property ownership at high rates, and in some cases lower living costs.
- In countries where younger workers have benefited disproportionately from economic growth — particularly in the technology and services sectors — older people may feel relatively less well off despite having substantial absolute wealth by historical standards.
The Countries That Outperform Their Wealth Ranking
Several countries in the ECB survey are notable for delivering better retirement outcomes than their headline wealth figures suggest:The Netherlands — Modest Wealth, Excellent Income
The Netherlands is the most counterintuitive finding in the European data. Despite having one of Europe’s most highly regarded pension systems — consistently rated among the world’s best by the Mercer Global Pension Index — Dutch retirees have median household wealth of just €134,400, well below the euro area average. The explanation is structural: the Dutch system delivers retirement income through generous state and occupational pensions rather than through private wealth accumulation. Dutch retirees do not need large pools of private savings because their pension income is reliable, generous, and inflation-linked. They are income-rich but asset-modest by survey measures.Norway and Denmark — Beyond the ECB Data
Norway and Denmark are not included in the ECB’s HFCS survey but are consistently ranked among the world’s best retirement destinations. Norway reclaimed the top spot in the Natixis Global Retirement Index in 2025, having ranked in the top three for a decade. The Natixis index evaluates 44 countries on 18 indicators including financial security, material wellbeing, health, and quality of life. Denmark climbed from 12th to 5th over the same decade. Both countries offer exceptional public services — including universal healthcare and comprehensive social programmes — that make a strong pension system feel even more robust. Both are expensive countries to live in, but real disposable income after social provision is very high.The Countries That Disappoint Despite High Pensions
Several European countries have pension systems that appear generous in terms of the replacement rate they offer (the percentage of working income they replace) but deliver less retirement comfort than the numbers suggest:Italy
Italy provides one of the higher pension replacement rates in Europe — meaning Italian retirees receive a higher percentage of their pre-retirement salary as pension income than many Northern European counterparts. Yet Italian retirees have median wealth of just €168,000 — the lowest of the four largest EU economies. Italy’s pension system is generous but the economy has grown slowly for decades, limiting the wealth-building capacity of pre-retirement savings. The pension income provides comfort, but accumulated private wealth is more modest.Greece and Eastern Europe
Greece and the Eastern European countries at the bottom of the wealth table — Latvia, Lithuania, Hungary, Estonia — demonstrate that decades of economic difficulty translate directly into retirement insecurity. Their retirees are not simply income-poor; they are wealth-poor too. Latvia’s €36,300 median retirement wealth is not a policy failure in isolation; it reflects 50 years of Soviet-era economics, a transition crisis, and a smaller property wealth effect than in Western Europe.The Four Lessons From the Data
Fidelity’s August 2026 analysis draws four specific lessons from the European retirement wealth comparison:1. Retirement wealth and income are not the same thing
The Netherlands proves this with its low wealth but high income. The UK’s property-heavy wealth may feel impressive on paper but generates limited monthly cash flow. Income — regular, sustainable, and predictable — is what determines day-to-day retirement comfort. Wealth is what provides security against unexpected costs.2. Your home is likely your biggest asset — and your least liquid one
For most European and UK retirees, their property is their largest single asset. Countries with higher home ownership and stronger house price growth have wealthier older households. But property wealth is locked unless you downsize or borrow against it — and transaction costs (stamp duty in the UK, transfer taxes elsewhere) make realising property wealth expensive and disruptive.3. International comparisons tell only part of the story
A retiree with £500,000 of wealth might feel comfortable in rural Scotland but inadequate in central London. The same principle applies across Europe: €200,000 provides very different standards of living in Lisbon compared to Paris. Cost of living, tax rates, healthcare costs, and local property prices all shape how wealth translates into quality of life.4. State support is invisible in the wealth tables
The ECB’s wealth measure does not capture the value of free healthcare, subsidised transport, social care provision, or other state benefits. The UK’s NHS, which provides healthcare free at the point of use, represents a significant and uncounted financial advantage for UK retirees relative to countries where private health insurance is required throughout retirement.What the Headline Numbers Miss
The £502,500 figure for UK median retirement household wealth is meaningful but incomplete as a description of UK retirement security. Several important dimensions are absent:- Distribution within the UK: the median describes the middle of the distribution. UK retirement wealth is highly unequal. A significant proportion of UK retirees have very little private wealth beyond a small state pension. The median is pulled up by those with substantial property equity and defined benefit pensions. The experience of the bottom quartile of UK retirees looks nothing like the median.
- Regional variation: property wealth in London and the South East is dramatically higher than in the North of England, Wales, or Northern Ireland. A 65-year-old London homeowner and a 65-year-old renter in the North West may both be included in the £502,500 median but have profoundly different financial situations.
- State Pension adequacy: the UK State Pension at £221.20 per week (£11,502 per year) is among the lower state pension replacement rates in Europe as a proportion of average earnings. The UK system relies on private pension saving to supplement the State Pension in a way that several European countries do not require.
The NHS: The Hidden Advantage the Wealth Tables Cannot Capture
The most significant advantage that UK retirees have over many European counterparts — and one that does not appear in any wealth or income table — is access to the National Health Service. The NHS provides healthcare free at the point of use for all UK residents, including retirees. This eliminates the largest single category of potentially catastrophic unexpected expenditure in later life that retirees in many other countries must either insure against or self-fund.The Fidelity analysis notes this explicitly: in countries where healthcare requires significant private spending or insurance, a larger portion of retirement wealth must be preserved as a buffer rather than used for lifestyle spending. UK retirees who can rely on the NHS for hospital treatment, GP care, and specialist referrals have effectively pre-funded a large insurance policy that their European peers must budget for separately.
Quantifying this advantage is difficult, but Fidelity US research suggests that healthcare is the single largest financial risk in retirement for American retirees. UK retirees, by comparison, face a structurally lower healthcare cost burden that frees retirement wealth and income for other purposes.
How UK Retirees Can Build Greater Financial Security
Fidelity’s August 2026 analysis closes with six actionable steps for UK retirees and those approaching retirement. These are not specific to the European comparison, but they are informed by the lessons the comparison teaches:- Start saving as early as possible: even modest pension contributions accumulated over decades can grow to significant sums. The power of compound growth over 30 to 40 years is the single most powerful tool available to any pension saver.
- Maximise employer pension contributions: if your employer offers matching contributions, ensuring you receive the full match is among the most financially valuable decisions available. The immediate return on employer-matched pension contributions is unmatched by any other investment.
- Review investments regularly: retirement savings should continue to reflect goals, time horizon, and risk tolerance throughout working life — not be set once and forgotten.
- Check State Pension eligibility: even with the UK State Pension forming a smaller proportion of retirement income than in many European countries, it remains the backbone of most people’s retirement income. Checking NI records and paying to fill gaps where cost-effective can be among the highest-returning financial decisions available to those approaching retirement. Each additional qualifying year currently costs approximately £824 and adds approximately £300 per year to the State Pension.
- Consider housing decisions carefully: the home is likely to be the largest single asset. Decisions about buying, maintaining, downsizing, or releasing equity from the property have a major impact on retirement finances and should be considered explicitly as part of retirement planning.
- Plan for income, not just wealth: the European data demonstrates clearly that retirement income — regular, sustainable, and inflation-linked — is what determines daily retirement quality of life. Understanding how the State Pension, workplace pensions, and investment income work together to generate a sustainable monthly income stream is the most important retirement planning task.
Conclusion
The UK’s position as Europe’s second-wealthiest retiree population, by the headline measure, is a genuinely positive finding for British pension savers. A typical UK household approaching retirement has substantially more wealth than the European average and significantly more than the four largest EU economies’ retirees combined suggest.But the Fidelity analysis’s most important insight is that wealth is only part of the picture. The Netherlands has modest measured wealth but excellent pension income. Italy has a generous state pension replacement rate but limited private wealth. The UK has substantial property and pension wealth but a state pension that is modest by European standards and significant inequality beneath the median figure.
The 34-fold wealth gap between Luxembourg and Latvia is a reminder that Europe is not a single retirement experience. It is 22 (or more) distinct retirement experiences shaped by history, policy, property markets, pension design, and cultural attitudes toward saving and spending. The UK sits near the top of that distribution by the wealth measure. Whether UK retirees feel near the top depends on where they live, what their pension income is, whether they own their home, and whether they are comparing themselves to Latvia or Luxembourg.
The most useful conclusion from the European comparison is not a ranking. It is a reminder that building financial security in retirement is a long-term project that benefits from starting early, maximising employer contributions, protecting State Pension entitlement, and planning for income — not just accumulated wealth. The UK’s second-place European ranking is a snapshot of where careful saving over decades has delivered. It is not a guarantee for those currently in their 30s, 40s, or 50s who have not yet built that foundation.
Frequently Asked Questions
Where does the UK rank in European retirement wealth?According to Fidelity’s August 2026 analysis, UK households headed by someone aged 65–74 typically have total wealth of £502,500 (ONS data). When compared against the ECB’s Household Finance and Consumption Survey of 22 European countries, this figure would place the UK second only to Luxembourg (€1,219,500). The euro area median for the same age group is €185,300. Belgium (€307,700) and Ireland (€296,700) are the wealthiest major European retiree populations within the ECB data.
Which European country has the wealthiest retirees?
Luxembourg has the highest median retirement household wealth in Europe by a wide margin: €1,219,500 for households aged 65 to 74, according to the ECB’s HFCS 2023 wave. This is more than six times the euro area average of €185,300 and 34 times higher than Latvia (€36,300), the lowest country in the survey. Luxembourg’s extreme position reflects its role as a financial centre, its high average wages, and its small population. Excluding Luxembourg, the wealthiest major retiree populations are in Belgium, Ireland, France, and Germany.
Why does the Netherlands have low retirement wealth despite a good pension system?
The Netherlands is consistently rated as having one of the world’s best pension systems, yet Dutch retirees have median household wealth of just €134,400 — significantly below the euro area average. This is because the Dutch system delivers retirement income through generous, mandatory occupational pensions rather than through private wealth accumulation. Dutch retirees do not need large pools of personal savings because their pension income is reliable and generous. They are income-rich by European standards but asset-modest by the ECB’s wealth measure.
How does UK retirement income compare to Europe?
The UK does not have directly comparable pre-tax income data for older households. The ONS measures disposable income for retired households at just under £30,000 per year. Fidelity’s August 2026 analysis estimates this implies a gross pre-tax income of approximately £34,000–£35,000, which would rank the UK relatively well against most European peers. Luxembourg has the highest older household income at over £80,000 per year; Hungary and Lithuania have the lowest at around £7,000 per year.
Do UK retirees feel wealthy compared to the rest of the UK population?
On this measure, the UK sits around the middle of the European pack. UK retirees enjoy disposable incomes worth approximately 91% of the national average — meaning retirees are slightly less well-off than the working population on average, but not dramatically so. In contrast, in Italy, Luxembourg, Spain, and Portugal, retirees actually have higher disposable incomes than the national average, meaning they feel particularly comfortable relative to younger generations.
What does the UK State Pension pay in 2026/27?
The full new UK State Pension pays £221.20 per week (£11,502 per year) in 2026/27. To receive the full amount, you need 35 qualifying years of National Insurance contributions. The UK State Pension represents a smaller proportion of pre-retirement earnings than many European state pensions, which is why UK private pension saving is more important than in countries with more generous state provision. Checking your NI record and paying to fill gaps where it is cost-effective is one of the highest-return financial decisions available to those approaching retirement.
What is the best country in Europe to retire to?
According to the Natixis Global Retirement Index 2025 (which evaluates 44 countries on 18 indicators including finances, material wellbeing, health, and quality of life), Norway reclaimed the top global ranking in 2025, having consistently ranked in the top three for a decade. Denmark climbed to 5th. Within the EU, Ireland ranks strongly on finances in retirement. Portugal and Spain are popular with British retirees for climate, cost of living, and lifestyle, with an estimated 200,000 British pensioners living permanently in Spain.

0 Comments Comments