

Investing
Is Now a Good Time to Buy Stocks? Here Is What the Data Says

S&P 500 closed at 7,811.54 on October 9, 2026 (up 0.6% that day, capping a record-setting week, per one market brief) and is up roughly 12% this year. Forward P/E about 19–20 (down from about 23 a year ago); CAPE about 41.6; top 10 stocks about 39% of the index. 10-year Treasury yield about 5.24% (October 12), touching 5.34%, the highest since 2002. Fed funds 3.75%–4.00% after a September hike; 52-week T-bill 4.46%; inflation 3.70%. After all-time highs, the S&P 500 averaged 13.5% over the next year vs 11.9% after any other day (since 1989, RBC); 12.7% vs 12.6% (since 1950, Fidelity). Missing the best days: the five best days since 1988 cost 38% of long-term gains; missing the 10 best over 30 years halves returns; the 30 best cut them by 84% (RBC). Vanguard: lump sum beat dollar-cost averaging 68% of the time (1976–2022), by 2.2% a year on average for all-stock portfolios.
The short answer is that a good time to buy stocks depends far more on your situation than on the calendar. If you have a long horizon, an emergency fund and a plan, the best day to start has usually been the one you actually started. But this is not a risk-free moment. Valuations are high, Treasury yields are near five percent and the Fed has begun raising rates. So let us look at both sides honestly.
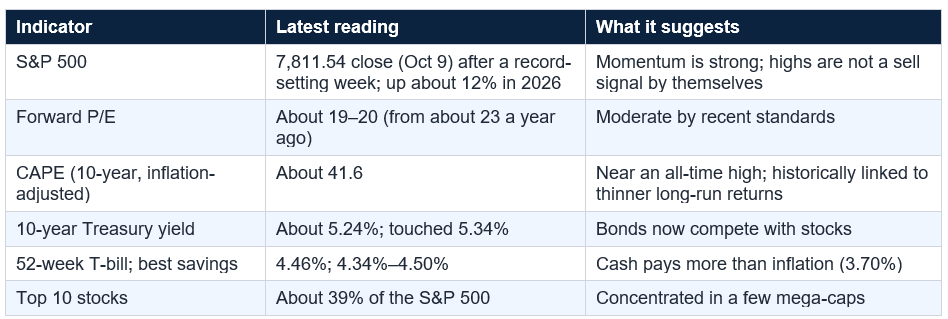
That mix, strong earnings and a record index alongside expensive long-run valuations and high bond yields, is why the question feels hard. It is genuinely a market with arguments on both sides.
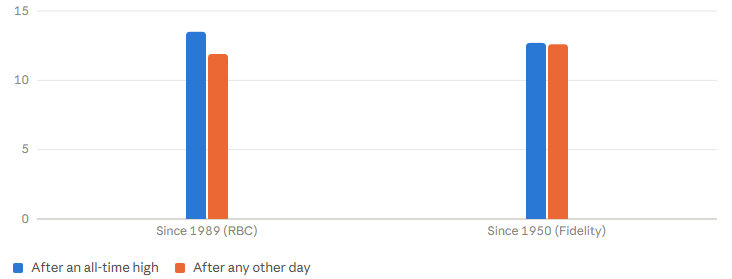
Then consider the record itself. All-time highs feel scary, but they are common. Since 1952, the S&P 500 has spent about 44% of trading days within 5% of a record. RBC found that since 1989 the index averaged 13.5% in the year after an all-time high, versus 11.9% after any other day. Fidelity’s data since 1950 shows 12.7% versus 12.6%, essentially a tie. Highs have tended to come in bunches rather than mark the top.
Finally, cash is not free. Money waiting on the sidelines earns 4.46% in a 52-week T-bill, which beats inflation but trails the long-run stock average of about 10.26% a year. Staying in cash for a long time has an opportunity cost, even when the yield looks attractive.
Concentration adds another layer. The top 10 stocks make up about 39% of the S&P 500, so index funds depend heavily on a few giant companies. And the rate outlook is not friendly: futures were pricing two more quarter-point hikes in 2027, and inflation was 3.70% in September. None of this means a decline is coming. It means the margin for error is thinner than it was a few years ago.
Keep in mind: High valuations do not tell you when a downturn will happen, only that returns from a given starting point have tended to be lower. Valuation is a poor timing tool and a useful expectation-setting tool.
The catch is that the best days tend to arrive right next to the worst. Investors who sell during a panic often miss the rebound that follows. DALBAR research, cited by MyETFJourney, found that the average equity investor earned about 6.8% a year over 30 years versus 10.2% for the S&P 500. That 3.4-point gap is largely the price of mistimed decisions.
To be fair, buying is not always painless. Fidelity found that across 11 recessions between 1980 and 2024, the S&P 500 averaged only 1% a year during those periods, versus 15% in expansions. And the worst calendar year in the index’s history was a 43.84% loss. Timing is hard in both directions, but the evidence shows the cost of staying out is usually larger than the cost of staying in.
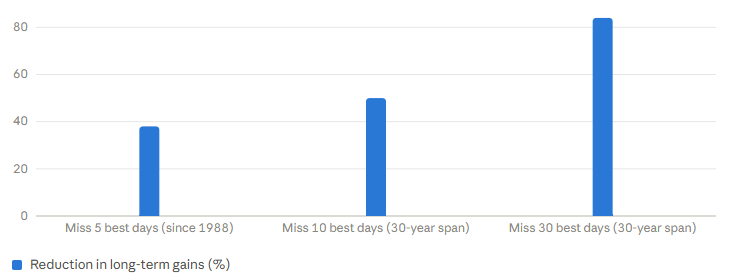
After all-time highs: 13.5% average one-year return vs 11.9% on any other day (since 1989, RBC). Missing the 5 best days since 1988: −38% of gains; 10 best over 30 years: −50%; 30 best: −84% (RBC).
But the study also points to the trade-off. Dollar-cost averaging reduces the chance of investing everything right before a downturn, and the regret that follows. Vanguard’s original paper put it bluntly: dollar-cost averaging just means taking risk later. If the sum is most of your savings and a sharp loss would be hard to bear, spreading it over six to twelve months is a defensible choice, as long as you stick to the schedule.
Whichever you choose, favor broad, low-cost funds rather than a handful of hot stocks. Spreading across the market reduces the risk of picking wrong. If concentration worries you, consider adding exposure beyond the biggest U.S. companies. And do not forget the alternatives: with T-bills at 4.46% and the 10-year near 5.24%, a portion in safer assets is no longer a sacrifice.
What you can control is the plan. Match your stock holdings to your timeline, keep an emergency fund, invest on a schedule and decide in advance how you will handle a fall. Vanguard’s research and the cost of missing the best days both argue against waiting for certainty, and the possibility of a downturn argues for entering in a way you can live with. Pick the approach you will actually stick to. This is general education, not personalized advice, and a qualified adviser can help you apply it.
Historically, no. Record highs often cluster, and returns after them have been about the same as or better than after other days. RBC found a 13.5% average one-year return after highs since 1989, versus 11.9% on any other day. That is history, not a promise, and today’s valuations are high.
Should I wait for a market drop before investing?
Waiting carries its own risk. Missing the market’s 10 best days over any 30-year stretch would roughly halve returns, and the best and worst days tend to occur close together. Many investors who wait for a drop end up waiting through a rise. A schedule of regular purchases removes the need to guess.
Is lump sum or dollar-cost averaging better?
Vanguard found lump sum investing beat dollar-cost averaging 68% of the time from 1976 to 2022. Dollar-cost averaging, however, can reduce regret if the market falls right after you invest. If a large sum is most of your savings, spreading it out is a reasonable choice.
With Treasury yields near 5%, should I buy bonds instead?
It is a real choice this year. The 10-year Treasury yield was about 5.24% on October 12, and the 52-week T-bill yield was 4.46%. Stocks offer higher expected growth over long periods but with larger swings. The right mix depends on your timeline and risk tolerance.
How much of my money should go into stocks?
That depends on when you need it and how you would react to a large loss. Money needed within a few years generally belongs in safer holdings. A qualified financial adviser can help you choose a mix. This article is general education, not personal advice.
S&P 500 average one-year return: after record highs vs. other days (%)
Average one-year return (%) by Study period and source
What missing the market's best days costs (RBC, % of long-term gains lost)
% of gains lost by Days missed
Table of Contents
- The Question Behind the Question
- Where the Market Stands Today
- The Case for Buying Now
- The Case for Caution
- What History Says About Timing
- Lump Sum or Spread It Out?
- Four Questions That Matter More Than the Date
- Three Practical Ways to Put Money In
- Make a Plan for the Drop
- Common Timing Mistakes
- Conclusion
- Frequently Asked Questions
The Question Behind the Question
Almost everyone who asks whether now is a good time to buy stocks is really asking something else: will the market go up from here, or down? That is the one thing no one knows. Not the strategists on television, not the algorithm, not me. What the evidence can tell you is how often waiting has paid off, what today’s numbers look like and which decisions are within your control.The short answer is that a good time to buy stocks depends far more on your situation than on the calendar. If you have a long horizon, an emergency fund and a plan, the best day to start has usually been the one you actually started. But this is not a risk-free moment. Valuations are high, Treasury yields are near five percent and the Fed has begun raising rates. So let us look at both sides honestly.
Where the Market Stands Today
The S&P 500 closed at 7,811.54 on Friday, October 9, up 0.6% on the day and capping a record-setting week, according to one market brief, and is up roughly 12% this year, driven more by earnings than by rising valuations. At the same time, the 10-year Treasury yield sat near 5.24% on October 12, after touching 5.34%, its highest level since 2002. The Federal Reserve raised its target range to 3.75%–4.00% in September, and its median projection points to about 4.1% by the end of 2026.That mix, strong earnings and a record index alongside expensive long-run valuations and high bond yields, is why the question feels hard. It is genuinely a market with arguments on both sides.
The Case for Buying Now
Start with earnings. FactSet estimates cited by Coinpaper put 2026 S&P 500 earnings growth near 30%, with the third and fourth quarters forecast at 27.4% and 25.2%. Estimates vary by source and date, so treat the exact figure with caution, but the direction is strong. Leverage Shares notes that the forward price-to-earnings ratio has fallen from roughly 23 to around 19 over the past year, which means earnings have grown faster than prices. The index is not obviously stretched on that measure.Then consider the record itself. All-time highs feel scary, but they are common. Since 1952, the S&P 500 has spent about 44% of trading days within 5% of a record. RBC found that since 1989 the index averaged 13.5% in the year after an all-time high, versus 11.9% after any other day. Fidelity’s data since 1950 shows 12.7% versus 12.6%, essentially a tie. Highs have tended to come in bunches rather than mark the top.
Finally, cash is not free. Money waiting on the sidelines earns 4.46% in a 52-week T-bill, which beats inflation but trails the long-run stock average of about 10.26% a year. Staying in cash for a long time has an opportunity cost, even when the yield looks attractive.
The Case for Caution
The warnings are real too. CAPE, which smooths earnings over ten years, is near 41.6, close to its all-time high and a level that has historically preceded thinner long-run returns. With a forward P/E near 20, the earnings yield is about 5%, no better than the 10-year Treasury, so stocks are not offering a clear premium for their extra risk. Leverage Shares warns that if yields stay above 5%, companies will need strong earnings growth to justify current prices, and that the greater risk is earnings, yields and oil all deteriorating together.Concentration adds another layer. The top 10 stocks make up about 39% of the S&P 500, so index funds depend heavily on a few giant companies. And the rate outlook is not friendly: futures were pricing two more quarter-point hikes in 2027, and inflation was 3.70% in September. None of this means a decline is coming. It means the margin for error is thinner than it was a few years ago.
Keep in mind: High valuations do not tell you when a downturn will happen, only that returns from a given starting point have tended to be lower. Valuation is a poor timing tool and a useful expectation-setting tool.
What History Says About Timing
The best evidence against timing is the cost of missing the good days. According to RBC, an investor who missed just the five best days in the S&P 500 since 1988 cut long-term gains by 38%. Over any 30-year stretch, missing the 10 best days would cut returns in half, and missing the 30 best would cut them by 84%. Fidelity found a similar result, with the five best days worth up to 37% of a portfolio’s value.The catch is that the best days tend to arrive right next to the worst. Investors who sell during a panic often miss the rebound that follows. DALBAR research, cited by MyETFJourney, found that the average equity investor earned about 6.8% a year over 30 years versus 10.2% for the S&P 500. That 3.4-point gap is largely the price of mistimed decisions.
To be fair, buying is not always painless. Fidelity found that across 11 recessions between 1980 and 2024, the S&P 500 averaged only 1% a year during those periods, versus 15% in expansions. And the worst calendar year in the index’s history was a 43.84% loss. Timing is hard in both directions, but the evidence shows the cost of staying out is usually larger than the cost of staying in.
After all-time highs: 13.5% average one-year return vs 11.9% on any other day (since 1989, RBC). Missing the 5 best days since 1988: −38% of gains; 10 best over 30 years: −50%; 30 best: −84% (RBC).
Lump Sum or Spread It Out?
If you have a large amount to invest right now, there are two main routes: put it all in at once, or spread it across several months. Vanguard studied this and found that lump sum investing beat dollar-cost averaging 68% of the time between 1976 and 2022. For all-stock portfolios, lump sum produced about 2.2% more wealth per year on average. The reason is simple: markets rise more often than they fall, so money invested sooner has more time to grow.But the study also points to the trade-off. Dollar-cost averaging reduces the chance of investing everything right before a downturn, and the regret that follows. Vanguard’s original paper put it bluntly: dollar-cost averaging just means taking risk later. If the sum is most of your savings and a sharp loss would be hard to bear, spreading it over six to twelve months is a defensible choice, as long as you stick to the schedule.
Four Questions That Matter More Than the Date
Rather than asking about the market, ask about yourself. First, when will you need this money? Money needed within a few years should not depend on stock prices. Second, do you have an emergency fund, so a surprise bill never forces a sale? Third, do you have a plan, with a target mix and a regular schedule? Fourth, and most honestly, how would you behave if your portfolio dropped 30%? If you would sell in a panic, you should hold fewer stocks than the textbooks suggest, because the plan you can follow beats the plan that looks best on paper.Three Practical Ways to Put Money In
Option one is automation: invest a fixed amount every payday or month, whatever the headlines say. This is how most 401(k) investors already operate, and it removes the timing question entirely. Option two is a staged entry: if you have a lump sum, split it into equal parts over, say, six to twelve months, and commit to the schedule in advance. Option three is lump sum: invest it all now if your horizon is long, your emergency fund is in place and you can stomach a large decline.Whichever you choose, favor broad, low-cost funds rather than a handful of hot stocks. Spreading across the market reduces the risk of picking wrong. If concentration worries you, consider adding exposure beyond the biggest U.S. companies. And do not forget the alternatives: with T-bills at 4.46% and the 10-year near 5.24%, a portion in safer assets is no longer a sacrifice.
Make a Plan for the Drop
Decide today what you will do when stocks fall, because at some point they will. Write it down. For long-term money, the plan is often to keep investing on schedule and not sell. You might also decide in advance to add a little more if the market drops 20%, which turns fear into a rule. The point is to make the decision when you are calm. People who write their plan before a decline are far more likely to follow it during one.Common Timing Mistakes
The most common mistake is waiting for a perfect entry that never arrives, then buying after a rally anyway. The second is investing a lump sum you cannot afford to see fall. The third is selling after a drop and sitting in cash through the rebound. The fourth is treating a high valuation as a signal to leave, rather than a reason to expect more modest returns. And the fifth is letting headlines about oil, rates or elections change a plan that was built for decades, not weeks.Conclusion
So, is now a good time to buy stocks? The honest answer is that it is as good a time as most, and not a risk-free one. The index is at a record, earnings are strong, and history says records have not been reliable sell signals. At the same time, valuations on long-run measures are near the top of their range, Treasury yields are near 5%, the Fed is raising rates and a few giant companies carry the index. Both stories are true.What you can control is the plan. Match your stock holdings to your timeline, keep an emergency fund, invest on a schedule and decide in advance how you will handle a fall. Vanguard’s research and the cost of missing the best days both argue against waiting for certainty, and the possibility of a downturn argues for entering in a way you can live with. Pick the approach you will actually stick to. This is general education, not personalized advice, and a qualified adviser can help you apply it.
Frequently Asked Questions
Is it a bad idea to buy stocks at an all-time high?Historically, no. Record highs often cluster, and returns after them have been about the same as or better than after other days. RBC found a 13.5% average one-year return after highs since 1989, versus 11.9% on any other day. That is history, not a promise, and today’s valuations are high.
Should I wait for a market drop before investing?
Waiting carries its own risk. Missing the market’s 10 best days over any 30-year stretch would roughly halve returns, and the best and worst days tend to occur close together. Many investors who wait for a drop end up waiting through a rise. A schedule of regular purchases removes the need to guess.
Is lump sum or dollar-cost averaging better?
Vanguard found lump sum investing beat dollar-cost averaging 68% of the time from 1976 to 2022. Dollar-cost averaging, however, can reduce regret if the market falls right after you invest. If a large sum is most of your savings, spreading it out is a reasonable choice.
With Treasury yields near 5%, should I buy bonds instead?
It is a real choice this year. The 10-year Treasury yield was about 5.24% on October 12, and the 52-week T-bill yield was 4.46%. Stocks offer higher expected growth over long periods but with larger swings. The right mix depends on your timeline and risk tolerance.
How much of my money should go into stocks?
That depends on when you need it and how you would react to a large loss. Money needed within a few years generally belongs in safer holdings. A qualified financial adviser can help you choose a mix. This article is general education, not personal advice.
0 Comments
Be the first to share your thoughts on this article.