

Finance
It’s Official: Americans Are Running Out of Money

Total US household debt: $18.8 trillion. Credit card debt: $1.26 trillion, nearing an all-time record. Auto loan debt: $1.71 trillion, a new all-time record. Delinquency rates at their highest since 2017. 24% of Americans have zero emergency savings. 67% say they will never feel financially secure. Consumer prices are 26% higher than they were in 2019. And the personal savings rate in May 2026 was just 3.0%. The numbers have crossed from concerning to definitive: for a significant and growing share of American households, the financial safety net has either run out or never existed. This article assembles the most current data from the Federal Reserve Bank of New York, Bankrate, Credible, and the Bureau of Labor Statistics to show exactly where the American consumer stands — and what it means for the economy.
This article is for general informational and educational purposes only. It does not constitute financial, investment, tax, or professional advice.
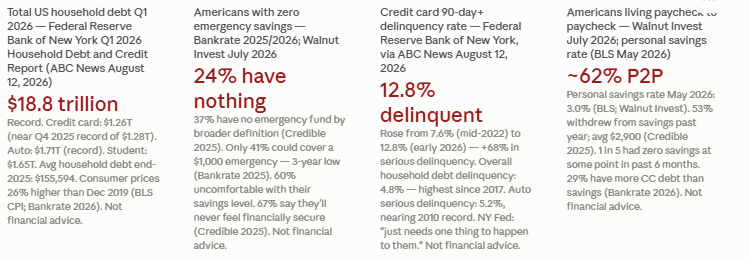
Against those debt numbers, the savings picture is stark. 24% of Americans have no emergency savings at all (Bankrate; Walnut Invest July 2026). 37% have no emergency fund by a broader definition (Credible 2025). Only 41% could cover a $1,000 emergency expense using savings — a three-year low (Bankrate 2025). 67% of Americans say they will never feel financially secure (Credible 2025 American Savings Report). And 62% of adults report living paycheck to paycheck (Walnut Invest July 2026).
The phrase ‘running out of money’ is not hyperbole when applied to this dataset. It is the empirical description of a household sector in which record debt, declining savings buffers, and rising delinquency rates are simultaneously moving in the wrong direction. This article examines each component in turn. Not financial advice.
Key 2026 headline numbers: Total household debt: $18.8T (NY Fed Q1 2026; ABC News August 2026). Credit card debt Q2 2026: $1.26T (NY Fed via ABC News August 12, 2026; Q4 2025 record: $1.28T). Auto loan debt: $1.71T (record; NY Fed Q2 2026). Personal savings rate May 2026: 3.0% (BLS; Walnut Invest July 2026). No emergency savings: 24% of Americans (Bankrate; Walnut Invest). Cannot cover $1,000 emergency: 59% (41% CAN cover it; Bankrate 2025; three-year low). Living paycheck to paycheck: ~62% (Walnut Invest July 2026). Prices 26% higher than December 2019 (BLS CPI; Bankrate 2026).
The Credible 2025 American Savings Report found an overlapping but slightly different figure: 37% of Americans don’t have an emergency fund by the standard definition (three to six months of expenses). Credible also found that 53% of Americans withdrew money from their savings in the past year, with the average withdrawal totalling $2,900. One in five Americans had no funds in their savings account at some point in the past six months. Fifty-five percent say the three-to-six-month emergency fund target is ‘unrealistic.’
The high-level average — $18,500 among those who do have emergency funds — is misleading due to the skewing effect of high-wealth households. The median tells a very different story. The US News 2026 Financial Wellness Survey found that the median ‘ideal’ emergency fund amount that Americans cite is $10,000. The gap between that aspiration and the 24% with nothing is the measure of how far American households have fallen from their own stated goals. Not financial advice.
Savings floor data: 24% of Americans have zero emergency savings (Bankrate; Walnut Invest July 2026). 37% have no emergency fund at all (Credible 2025 American Savings Report). 53% withdrew from savings in the past year; average withdrawal $2,900 (Credible 2025). 1 in 5 Americans had no savings account funds at some point in the past 6 months (Credible 2025; PaymentsNext July 2025). 60% uncomfortable with their emergency savings level (Bankrate). 27% of those who DO have emergency funds have used them for non-essentials (Credible 2025). 55% say the 3-6 month rule is unrealistic (Credible 2025). 67% say they will never feel financially secure (Credible 2025). Sources: Credible 2025 American Savings Report; Bankrate; Walnut Invest July 2026.
A $1,000 emergency is not an exotic scenario. It is the average cost of a car repair, a dental procedure, a single ER visit, or a home appliance replacement. It is the first level of financial fragility — the most basic test of whether a household has any buffer. Failing this test at a three-year low, in the sixth year following the COVID emergency savings surge, tells a specific story: the emergency savings built up during pandemic stimulus payments have been depleted. The floor has dropped.
Bankrate’s 2026 Annual Emergency Savings Report (data polled December 2025) found that 29% of Americans now have more credit card debt than emergency savings — meaning for nearly one in three households, the emergency fund has already been functionally consumed by debt. An additional 19% have neither credit card debt nor savings — a financial ground zero. Only 27% of Americans have six months of expenses saved, the standard recommendation (Bankrate 2025). Not financial advice.
The composition of the $18.8 trillion at Q1 2026 (ABC News August 12, 2026; NY Fed Q2 2026 data): credit card debt $1.26 trillion; auto debt $1.71 trillion (record); student debt $1.65 trillion; mortgage debt makes up the majority of the remaining balance. The data shows auto and credit card debt increasing in Q2 2026 while student and mortgage debt decreased slightly (ABC News August 12, 2026).
Consumer prices being 26% higher than December 2019 (BLS CPI data, cited Bankrate 2026) provides the structural context. Households that have not seen real wage growth matching that 26% cumulative inflation — which is most households, based on the savings and debt data — have been financing their cost of living through debt rather than savings. The $18.8 trillion is partly the accumulated record of five years of inflation-gap financing. Not financial advice.
The $18.8 trillion in context: US GDP approximately $29-30 trillion. Household debt = approximately 60-65% of GDP. Breakdown (Q1-Q2 2026 NY Fed): mortgage (majority), auto $1.71T (record), student $1.65T, credit card $1.26T. Average household debt end of 2025: $155,594 (NY Fed via TNND). Context: consumer prices 26% higher than Dec 2019 (BLS CPI; Bankrate 2026). Real wages for many households have not kept up, meaning debt has filled the gap. Personal savings rate May 2026: 3.0% (BLS; Walnut Invest July 2026). Sources: NY Fed Q1/Q2 2026 Household Debt & Credit; ABC News August 12, 2026; BLS; Bankrate 2026. Not financial advice.
The WalletHub survey (2025–26) found that 53% of households say they struggle most with credit card debt — more than mortgages (20%) or student loans (11%). Nearly half said their household cannot manage more debt. More than a third expect to have higher balances by end of 2026. Credible’s 2025 survey found 25% of Americans went into debt to avoid draining their savings altogether, even among full-time workers — suggesting the debt is not primarily recreational spending but necessity financing.
At a 20% average interest rate, $1.26 trillion in credit card balances generates approximately $252 billion in annual interest charges across American households. That is $252 billion that cannot be saved, cannot be invested, and cannot be spent on goods and services. It is transferred to financial institutions. The interest burden of credit card debt is itself a driver of the savings crisis: carrying a $5,000 balance at 20% APR costs $1,000 per year in interest alone. Not financial advice.
Credit card crisis data: Q2 2026 credit card balance: $1.26T (+$21B from Q1; NY Fed via ABC News August 12, 2026). Q4 2025 all-time record: $1.28T. Average interest rate: ~20%. Annual interest burden on $1.26T: ~$252B. 53% of households say credit card debt is their primary financial struggle (WalletHub). Nearly half can't manage more debt (WalletHub). >1/3 expect higher balances by end of 2026 (WalletHub). 25% went INTO debt to avoid draining savings — including full-time workers (Credible 2025; PaymentsNext July 2025). Sources: NY Fed Q2 2026; ABC News August 12, 2026; WalletHub 2025-26; Credible 2025. Not financial advice.
Auto Loans and Student Debt: More Records, More Stress
Auto loan debt reached $1.71 trillion in Q2 2026, a new all-time record (Federal Reserve Bank of New York, via ABC News August 12, 2026). This matters for household financial resilience because auto loans are secured debt — missing payments leads to repossession, which in turn eliminates the transportation a household needs to maintain employment. Auto loan delinquency in serious status reached 5.2% — nearing the record set in 2010 during the aftermath of the financial crisis (TNND/KMPH News, citing NY Fed data).
Student loan debt stands at $1.65 trillion (NY Fed Q1/Q2 2026 data, via ABC News August 12, 2026). Student debt decreased slightly in Q2 2026, possibly reflecting some repayment activity or forgiveness programme effects. But the balance remains the second-largest consumer debt category after mortgages, and for the 45 million Americans carrying student loans, repayment obligations compete directly with emergency savings and retirement contributions.
The combination of high credit card rates, elevated auto loan balances approaching delinquency record levels, and persistent student debt creates a debt stack that crowds out savings capacity for a large share of American households. For households carrying all three simultaneously — credit card at 20%, auto loan at 7–8%, student loan at 6–7% — the monthly debt service obligation can easily exceed what is available for savings. Not financial advice.
Overall delinquency rates on all outstanding household debt climbed to 4.8% in Q4 — the highest rate since 2017 (NY Fed, cited TNND/KMPH News). Auto loans in serious delinquency hit 5.2%, nearing the record set in 2010 during the financial crisis aftermath. These figures represent households that have already passed the point of cash flow strain and have fallen into formal arrears.
The NY Fed’s own researchers placed the delinquency picture in human terms on a press call, reported by ABC News (August 12, 2026): ‘There are a lot of households who live paycheck to paycheck, and it just needs one thing to happen to them that could lead to a delinquency.’ The researchers also noted that some of the higher delinquency rates are attributable to old outstanding debts rather than new defaults, which slightly moderates the interpretation — but does not change the direction of the trend. Not financial advice.
Federal Reserve Bank of New York researchers (cited ABC News August 12, 2026): 'There are a lot of households who live paycheck to paycheck, and it just needs one thing to happen to them that could lead to a delinquency.' Credit card 90-day+ delinquency rate: rose from 7.6% (mid-2022) to 12.8% (early 2026). Researchers noted higher rates partly reflect old outstanding debts, not only new defaults. Overall household debt delinquency: 4.8% in Q4 — highest since 2017.
Credible’s 2025 American Savings Report found that 25% of Americans went into debt to avoid draining their savings — including full-time workers. This is the rational response of a household under sustained cash flow pressure: preserve the emergency fund by taking on new debt rather than depleting it. But at 20% credit card rates, the debt solution rapidly compounds into a larger problem than the original shortfall.
The PaymentsNext July 2025 analysis describes the structural dynamic: ‘Three things are driving the consumer struggle for security: inability to save, inflation pressures and debt as a way to manage finances.’ These are not independent problems. Inflation reduces real purchasing power, which forces more spending relative to income, which reduces savings capacity, which forces recourse to debt, which increases the debt service burden, which further reduces savings capacity. It is a feedback loop, and for millions of households, it has been running for five consecutive years. Not financial advice.
The personal savings rate in May 2026 was 3.0% (BLS data, cited Walnut Invest July 2026). For context: the US personal savings rate averaged approximately 7–8% in the decade before the pandemic. It spiked to over 30% in April 2020 on stimulus payments, then collapsed as those one-time transfers ended and inflation arrived. By 2022–2024, the savings rate was already suppressed. At 3.0% in May 2026, it is at its lowest sustainable level and one shock away from going negative.
The structural math is unforgiving. At a 3.0% savings rate, a household earning $60,000 gross (approximately $4,500 net/month) is saving approximately $1,800 per year. Building a three-month emergency fund of $12,000 at that rate takes 6.7 years — assuming no withdrawals. For the 53% who withdrew an average of $2,900 from savings in the past year, the net savings accumulation is negative. Not financial advice.
The gender gap in emergency savings is significant. The US News 2026 Financial Wellness Survey (cited 401K Specialist Magazine 2026) found that nearly 48% of women say they don’t have an emergency fund, compared with about one-third of men. This gap reflects the persistent gender pay gap, the higher share of women in part-time and gig economy work, and the disproportionate childcare costs borne by female-headed households. Financial fragility is not evenly distributed, and the data shows it concentrates in women and younger adults.
The holiday spending finding is also generationally specific: 23% of Americans admitted to tapping emergency savings for holiday purchases, with younger adults disproportionately represented (US News 2026 Financial Wellness Survey). This reflects both the social pressure of holiday spending and the reality that emergency savings, when they exist, are often the only accessible pool of liquid money for households with thin credit availability. Not financial advice.
Bankrate chief financial analyst Greg McBride, CFA, offered a concrete piece of guidance: ‘Households starting out 2026 with a goal of increasing their emergency savings will be more likely to succeed by finding ways to increase their income rather than searching for more expenses to cut.’ This reframes the standard financial advice around the income side of the equation rather than the cost side — acknowledging that for many households, there are no more expenses to cut.
The Credible 2025 report found that 52% of Americans are focused on building savings while 48% are prioritising debt repayment. The near-even split reflects the genuine mathematical tension: paying down 20% credit card debt is the equivalent of a guaranteed 20% return on investment, which mathematically beats building a savings account earning 4–5%. But without any savings buffer, the household remains one $1,000 shock away from adding more debt at 20%. The financially optimal answer is to do both: small emergency fund first, then aggressive debt repayment, then rebuild the full emergency fund. Not financial advice.
The PaymentsNext July 2025 analysis notes: ‘As consumer fragility intensifies, failures in digital payments, overdrafts, or embedded credit might trigger scrutiny.’ The rising delinquency rates in credit cards (7.6% to 12.8% serious delinquency over four years) and auto loans (5.2% serious delinquency, near the 2010 record) are early indicators of systemic consumer credit stress that flows into bank earnings, credit availability, and lending standards.
The NY Fed researchers were explicit in their August 2026 commentary: the paycheck-to-paycheck dynamic means that a single adverse event — a layoff, a medical emergency, a natural disaster — can trigger delinquency for a large share of households who are currently current on their payments but have no buffer. This is the structural fragility that the $18.8 trillion debt figure and the 24% with zero savings represent at a systemic level. Not financial advice.
The phrase ‘running out of money’ does not describe every American household. It describes a specific and growing subset: the 24% with no savings, the 62% living paycheck to paycheck, the 29% with more credit card debt than savings, the 12.8% with credit card balances 90+ days delinquent. These are not hypothetical future risks. They are the current, documented financial condition of tens of millions of American households in October 2026.
What happens next is not written. The same data that shows the crisis also shows the response: 52% of Americans are trying to build savings. 29% say increasing savings is their top financial priority. Younger Americans are building emergency funds at higher rates than their peers (US News 2026). The aggregate data is a snapshot, not a destiny. The households that take the $1,000 emergency fund step this month, redirect $100 more per month toward credit card debt, and find one additional income source will look different in two years. The data documents the problem. The action is individual. Not financial advice.
Total US household debt reached $18.8 trillion in Q1 2026, according to the Federal Reserve Bank of New York's Q1 2026 Household Debt and Credit Report (cited ABC News August 12, 2026; Walnut Invest July 2026). The breakdown by category (Q1-Q2 2026, NY Fed): credit card debt $1.26 trillion (Q2 2026, near the $1.28 trillion Q4 2025 record); auto loan debt $1.71 trillion (new record); student debt $1.65 trillion; mortgages make up the majority of remaining debt. The average household owed $155,594 at the end of 2025, approximately $12,000 below the all-time high (TNND/KMPH News citing NY Fed). Consumer prices are 26% higher than December 2019 (BLS CPI, Bankrate 2026), providing context for why debt has grown: many households have been financing their cost of living through debt as real wages have not kept pace with cumulative inflation.
What percentage of Americans have no emergency savings?
24% of Americans have no emergency savings at all, according to Bankrate (cited Walnut Invest July 2026). Credible's 2025 American Savings Report found the broader figure of 37% of Americans lacking an emergency fund by the standard definition. Only 41% of Americans could cover a $1,000 emergency expense using savings — a three-year low (Bankrate 2025 Emergency Savings Report). 60% are uncomfortable with their emergency savings level (Bankrate). 67% say they will never feel financially secure (Credible 2025). Gender breakdown: nearly 48% of women say they don't have an emergency fund, compared with about one-third of men (US News 2026 Financial Wellness Survey). Gen Z: 34% have no emergency savings at all (Bankrate 2025).
What is the credit card delinquency rate in 2026?
The percentage of credit card balances more than 90 days delinquent rose from 7.6% in mid-2022 to 12.8% in early 2026 — a 68% increase in serious credit card delinquency over four years (Federal Reserve Bank of New York, via ABC News August 12, 2026). Overall delinquency rates on all outstanding household debt climbed to 4.8% in Q4 (year not specified, likely 2025 Q4) — the highest rate since 2017 (NY Fed, cited TNND/KMPH News). Auto loans in serious delinquency hit 5.2%, nearing the record set in 2010 during the financial crisis aftermath. NY Fed researchers noted (August 2026): 'There are a lot of households who live paycheck to paycheck, and it just needs one thing to happen to them that could lead to a delinquency.' Researchers also noted the higher rates partly reflect old outstanding debts rather than only new defaults. Source: ABC News August 12, 2026 (NY Fed Q2 2026 data).
What percentage of Americans live paycheck to paycheck in 2026?
Approximately 62% of American adults report living paycheck to paycheck, according to Walnut Invest's July 2026 personal finance statistics compilation (citing multiple underlying data sources). This means that after meeting monthly fixed obligations — rent or mortgage, utilities, food, transportation, and debt service — there is little or nothing left to save or buffer against unexpected expenses. Credible's 2025 American Savings Report supports this picture: 53% of Americans withdrew money from savings in the past year (average $2,900 withdrawal), and 1 in 5 had no funds in their savings account at some point in the past 6 months. The figure has increased from pre-pandemic levels as cumulative inflation of 26% since December 2019 (BLS CPI, Bankrate 2026) has squeezed household purchasing power.
What should I do if I have no emergency savings?
If you have no emergency savings, the first priority is building a $1,000 emergency buffer before addressing other financial goals (with the exception of capturing any employer 401(k) match, which is a guaranteed return). The $1,000 target is specific because the Bankrate data shows this is the threshold at which most unexpected expenses — a car repair, a dental bill, an ER visit — can be handled without going into high-interest debt. At $100 per month saved, it takes 10 months; at $200 per month, 5 months. Automate the transfer on payday so it happens before discretionary spending. After the $1,000 emergency fund: address high-interest credit card debt (the avalanche method — highest rate first). Then build toward the full 3-6 month emergency fund. If credit card debt is unmanageable, non-profit credit counselling is available through NFCC (National Foundation for Credit Counseling) at 1-800-388-2227. Not financial advice. Consult a qualified CFP for personalised guidance.
This article is for general informational and educational purposes only. It does not constitute financial, investment, tax, or professional advice.
Table of Contents
- The Headline Numbers: What the Data Actually Shows
- The Savings Crisis: 24% of Americans Have Nothing
- The $1,000 Test: America’s Emergency Fund Failure
- The Debt Explosion: $18.8 Trillion and Climbing
- Credit Card Debt: $1.26 Trillion and Near a Record
- Auto Loans and Student Debt: More Records, More Stress
- Delinquency Rising: The Cracks Are Widening
- The Paycheck-to-Paycheck Nation
- Why It Happened: 26% Inflation Since 2019 and a 3% Savings Rate
- Who Is Hit Hardest: The Generational and Gender Breakdown
- The Priority Paradox: Saving vs Paying Down Debt
- What the Data Means for the Broader Economy
- What You Can Do: Personal Finance Steps From the Data
- Conclusion: The Numbers Are Official. What Happens Next Is Not.
- Frequently Asked Questions
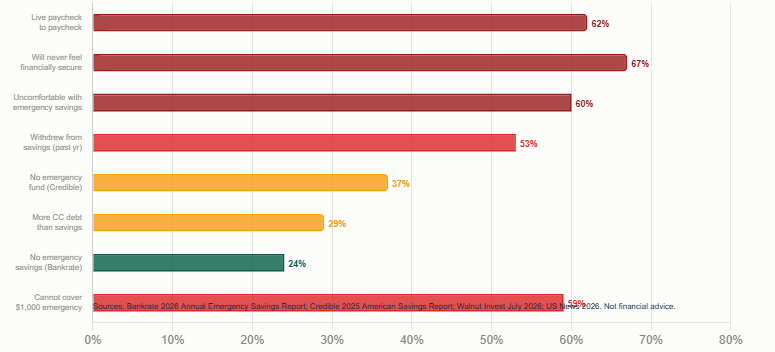
The savings crisis — who has what and who has nothing
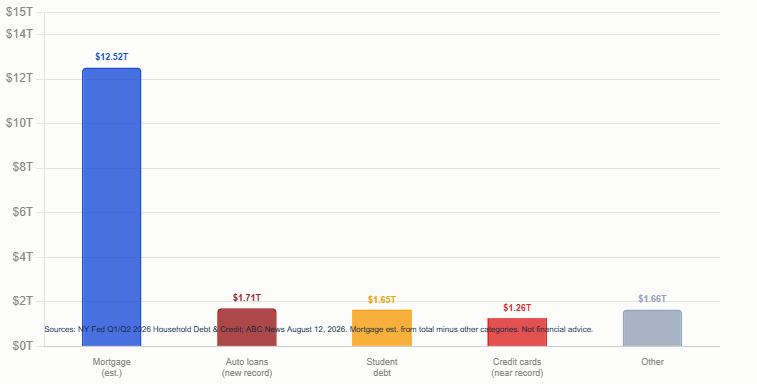
The debt record — $18.8 trillion by category
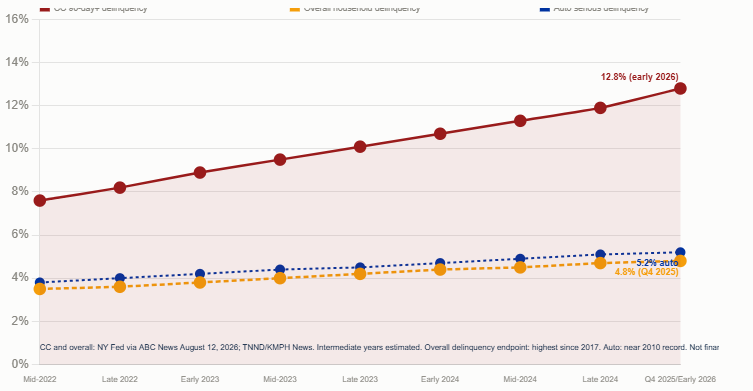
Delinquency rising — the cracks widening
The Headline Numbers: What the Data Actually Shows
These are not projections or estimates. They are documented, sourced, contemporaneous figures from the Federal Reserve Bank of New York, the Bureau of Labor Statistics, Bankrate, and major national survey organisations, current as of mid-to-late 2026. Total US household debt hit $18.8 trillion in Q1 2026 — a record. Credit card debt reached $1.26 trillion in Q2 2026, just shy of the $1.28 trillion all-time record set in Q4 2025. Auto loan debt hit $1.71 trillion — a new all-time record. And the personal savings rate in May 2026 was 3.0%.Against those debt numbers, the savings picture is stark. 24% of Americans have no emergency savings at all (Bankrate; Walnut Invest July 2026). 37% have no emergency fund by a broader definition (Credible 2025). Only 41% could cover a $1,000 emergency expense using savings — a three-year low (Bankrate 2025). 67% of Americans say they will never feel financially secure (Credible 2025 American Savings Report). And 62% of adults report living paycheck to paycheck (Walnut Invest July 2026).
The phrase ‘running out of money’ is not hyperbole when applied to this dataset. It is the empirical description of a household sector in which record debt, declining savings buffers, and rising delinquency rates are simultaneously moving in the wrong direction. This article examines each component in turn. Not financial advice.
Key 2026 headline numbers: Total household debt: $18.8T (NY Fed Q1 2026; ABC News August 2026). Credit card debt Q2 2026: $1.26T (NY Fed via ABC News August 12, 2026; Q4 2025 record: $1.28T). Auto loan debt: $1.71T (record; NY Fed Q2 2026). Personal savings rate May 2026: 3.0% (BLS; Walnut Invest July 2026). No emergency savings: 24% of Americans (Bankrate; Walnut Invest). Cannot cover $1,000 emergency: 59% (41% CAN cover it; Bankrate 2025; three-year low). Living paycheck to paycheck: ~62% (Walnut Invest July 2026). Prices 26% higher than December 2019 (BLS CPI; Bankrate 2026).
The Savings Crisis: 24% of Americans Have Nothing
The most alarming single statistic in the 2025–2026 financial data is the one that measures the absolute floor: 24% of Americans have no emergency savings whatsoever (Bankrate; Walnut Invest July 2026). Not inadequate savings — zero. No buffer between their current income and a crisis. For context, the US population is approximately 335 million people. 24% is approximately 80 million adults with nothing to fall back on in the event of a medical bill, a job loss, a car repair, or any unexpected expense.The Credible 2025 American Savings Report found an overlapping but slightly different figure: 37% of Americans don’t have an emergency fund by the standard definition (three to six months of expenses). Credible also found that 53% of Americans withdrew money from their savings in the past year, with the average withdrawal totalling $2,900. One in five Americans had no funds in their savings account at some point in the past six months. Fifty-five percent say the three-to-six-month emergency fund target is ‘unrealistic.’
The high-level average — $18,500 among those who do have emergency funds — is misleading due to the skewing effect of high-wealth households. The median tells a very different story. The US News 2026 Financial Wellness Survey found that the median ‘ideal’ emergency fund amount that Americans cite is $10,000. The gap between that aspiration and the 24% with nothing is the measure of how far American households have fallen from their own stated goals. Not financial advice.
Savings floor data: 24% of Americans have zero emergency savings (Bankrate; Walnut Invest July 2026). 37% have no emergency fund at all (Credible 2025 American Savings Report). 53% withdrew from savings in the past year; average withdrawal $2,900 (Credible 2025). 1 in 5 Americans had no savings account funds at some point in the past 6 months (Credible 2025; PaymentsNext July 2025). 60% uncomfortable with their emergency savings level (Bankrate). 27% of those who DO have emergency funds have used them for non-essentials (Credible 2025). 55% say the 3-6 month rule is unrealistic (Credible 2025). 67% say they will never feel financially secure (Credible 2025). Sources: Credible 2025 American Savings Report; Bankrate; Walnut Invest July 2026.
The $1,000 Test: America’s Emergency Fund Failure
The $1,000 emergency expense test is the bluntest measure of financial resilience, and the 2025 figure is the lowest in three years: only 41% of Americans say they could cover a surprise $1,000 expense from savings (Bankrate 2025 Emergency Savings Report, cited AccountsRecovery July 2025; Walnut Invest July 2026). That means 59% — more than half of Americans — would have to borrow, use a credit card, ask family, or go without to handle a $1,000 shock.A $1,000 emergency is not an exotic scenario. It is the average cost of a car repair, a dental procedure, a single ER visit, or a home appliance replacement. It is the first level of financial fragility — the most basic test of whether a household has any buffer. Failing this test at a three-year low, in the sixth year following the COVID emergency savings surge, tells a specific story: the emergency savings built up during pandemic stimulus payments have been depleted. The floor has dropped.
Bankrate’s 2026 Annual Emergency Savings Report (data polled December 2025) found that 29% of Americans now have more credit card debt than emergency savings — meaning for nearly one in three households, the emergency fund has already been functionally consumed by debt. An additional 19% have neither credit card debt nor savings — a financial ground zero. Only 27% of Americans have six months of expenses saved, the standard recommendation (Bankrate 2025). Not financial advice.
The Debt Explosion: $18.8 Trillion and Climbing
Total US household debt reached $18.8 trillion in Q1 2026, according to the Federal Reserve Bank of New York’s Q1 2026 Household Debt and Credit Report (cited ABC News August 12, 2026; Walnut Invest July 2026). This is a record. The average household owed $155,594 at the end of 2025, approximately $12,000 below the all-time high (TNND/KMPH News, citing NY Fed data). The distribution of this debt matters: delinquency rates are highest among lower-income households and among auto loan borrowers, suggesting the stress is concentrated rather than uniformly distributed.The composition of the $18.8 trillion at Q1 2026 (ABC News August 12, 2026; NY Fed Q2 2026 data): credit card debt $1.26 trillion; auto debt $1.71 trillion (record); student debt $1.65 trillion; mortgage debt makes up the majority of the remaining balance. The data shows auto and credit card debt increasing in Q2 2026 while student and mortgage debt decreased slightly (ABC News August 12, 2026).
Consumer prices being 26% higher than December 2019 (BLS CPI data, cited Bankrate 2026) provides the structural context. Households that have not seen real wage growth matching that 26% cumulative inflation — which is most households, based on the savings and debt data — have been financing their cost of living through debt rather than savings. The $18.8 trillion is partly the accumulated record of five years of inflation-gap financing. Not financial advice.
The $18.8 trillion in context: US GDP approximately $29-30 trillion. Household debt = approximately 60-65% of GDP. Breakdown (Q1-Q2 2026 NY Fed): mortgage (majority), auto $1.71T (record), student $1.65T, credit card $1.26T. Average household debt end of 2025: $155,594 (NY Fed via TNND). Context: consumer prices 26% higher than Dec 2019 (BLS CPI; Bankrate 2026). Real wages for many households have not kept up, meaning debt has filled the gap. Personal savings rate May 2026: 3.0% (BLS; Walnut Invest July 2026). Sources: NY Fed Q1/Q2 2026 Household Debt & Credit; ABC News August 12, 2026; BLS; Bankrate 2026. Not financial advice.
Credit Card Debt: $1.26 Trillion and Near a Record
Credit card debt in Q2 2026 reached $1.26 trillion, an increase of $21 billion from Q1 2026, according to the Federal Reserve Bank of New York (via ABC News August 12, 2026). This figure is just below the $1.28 trillion all-time record set in Q4 2025. Credit card debt has risen relentlessly since 2021, when pandemic-era savings and stimulus funds temporarily pushed balances lower. The recovery of credit card debt to near-record levels, combined with average interest rates of approximately 20% (TNND/KMPH News), represents one of the most significant personal finance stress factors in the American economy.The WalletHub survey (2025–26) found that 53% of households say they struggle most with credit card debt — more than mortgages (20%) or student loans (11%). Nearly half said their household cannot manage more debt. More than a third expect to have higher balances by end of 2026. Credible’s 2025 survey found 25% of Americans went into debt to avoid draining their savings altogether, even among full-time workers — suggesting the debt is not primarily recreational spending but necessity financing.
At a 20% average interest rate, $1.26 trillion in credit card balances generates approximately $252 billion in annual interest charges across American households. That is $252 billion that cannot be saved, cannot be invested, and cannot be spent on goods and services. It is transferred to financial institutions. The interest burden of credit card debt is itself a driver of the savings crisis: carrying a $5,000 balance at 20% APR costs $1,000 per year in interest alone. Not financial advice.
Credit card crisis data: Q2 2026 credit card balance: $1.26T (+$21B from Q1; NY Fed via ABC News August 12, 2026). Q4 2025 all-time record: $1.28T. Average interest rate: ~20%. Annual interest burden on $1.26T: ~$252B. 53% of households say credit card debt is their primary financial struggle (WalletHub). Nearly half can't manage more debt (WalletHub). >1/3 expect higher balances by end of 2026 (WalletHub). 25% went INTO debt to avoid draining savings — including full-time workers (Credible 2025; PaymentsNext July 2025). Sources: NY Fed Q2 2026; ABC News August 12, 2026; WalletHub 2025-26; Credible 2025. Not financial advice.
Auto Loans and Student Debt: More Records, More Stress
Auto loan debt reached $1.71 trillion in Q2 2026, a new all-time record (Federal Reserve Bank of New York, via ABC News August 12, 2026). This matters for household financial resilience because auto loans are secured debt — missing payments leads to repossession, which in turn eliminates the transportation a household needs to maintain employment. Auto loan delinquency in serious status reached 5.2% — nearing the record set in 2010 during the aftermath of the financial crisis (TNND/KMPH News, citing NY Fed data).
Student loan debt stands at $1.65 trillion (NY Fed Q1/Q2 2026 data, via ABC News August 12, 2026). Student debt decreased slightly in Q2 2026, possibly reflecting some repayment activity or forgiveness programme effects. But the balance remains the second-largest consumer debt category after mortgages, and for the 45 million Americans carrying student loans, repayment obligations compete directly with emergency savings and retirement contributions.
The combination of high credit card rates, elevated auto loan balances approaching delinquency record levels, and persistent student debt creates a debt stack that crowds out savings capacity for a large share of American households. For households carrying all three simultaneously — credit card at 20%, auto loan at 7–8%, student loan at 6–7% — the monthly debt service obligation can easily exceed what is available for savings. Not financial advice.
Delinquency Rising: The Cracks Are Widening
The most forward-looking indicator in the household finance dataset is delinquency rates, and they are moving in the wrong direction. The percentage of credit card balances more than 90 days delinquent rose from 7.6% in mid-2022 to 12.8% by early 2026 (Federal Reserve Bank of New York, via ABC News August 12, 2026). That is a 68% increase in serious credit card delinquency over four years.Overall delinquency rates on all outstanding household debt climbed to 4.8% in Q4 — the highest rate since 2017 (NY Fed, cited TNND/KMPH News). Auto loans in serious delinquency hit 5.2%, nearing the record set in 2010 during the financial crisis aftermath. These figures represent households that have already passed the point of cash flow strain and have fallen into formal arrears.
The NY Fed’s own researchers placed the delinquency picture in human terms on a press call, reported by ABC News (August 12, 2026): ‘There are a lot of households who live paycheck to paycheck, and it just needs one thing to happen to them that could lead to a delinquency.’ The researchers also noted that some of the higher delinquency rates are attributable to old outstanding debts rather than new defaults, which slightly moderates the interpretation — but does not change the direction of the trend. Not financial advice.
Federal Reserve Bank of New York researchers (cited ABC News August 12, 2026): 'There are a lot of households who live paycheck to paycheck, and it just needs one thing to happen to them that could lead to a delinquency.' Credit card 90-day+ delinquency rate: rose from 7.6% (mid-2022) to 12.8% (early 2026). Researchers noted higher rates partly reflect old outstanding debts, not only new defaults. Overall household debt delinquency: 4.8% in Q4 — highest since 2017.
The Paycheck-to-Paycheck Nation
Approximately 62% of American adults report living paycheck to paycheck, according to aggregate data compiled by Walnut Invest (July 2026). The paycheck-to-paycheck characterisation means that after meeting monthly fixed obligations — rent or mortgage, utilities, food, transportation, debt service — there is little or nothing left to save, invest, or buffer against an unexpected expense. It is the structural condition that makes the $1,000 emergency test so devastating: for a paycheck-to-paycheck household, $1,000 in unexpected costs can trigger a cascade of missed payments, late fees, and credit damage.Credible’s 2025 American Savings Report found that 25% of Americans went into debt to avoid draining their savings — including full-time workers. This is the rational response of a household under sustained cash flow pressure: preserve the emergency fund by taking on new debt rather than depleting it. But at 20% credit card rates, the debt solution rapidly compounds into a larger problem than the original shortfall.
The PaymentsNext July 2025 analysis describes the structural dynamic: ‘Three things are driving the consumer struggle for security: inability to save, inflation pressures and debt as a way to manage finances.’ These are not independent problems. Inflation reduces real purchasing power, which forces more spending relative to income, which reduces savings capacity, which forces recourse to debt, which increases the debt service burden, which further reduces savings capacity. It is a feedback loop, and for millions of households, it has been running for five consecutive years. Not financial advice.
Why It Happened: 26% Inflation Since 2019 and a 3% Savings Rate
The proximate cause of the American savings crisis is documented in one number from the Bureau of Labor Statistics: consumer prices are 26% higher than they were in December 2019 (BLS CPI data, cited Bankrate 2026 Annual Emergency Savings Report). A household spending $4,000 per month in 2019 now needs $5,040 to maintain the same living standard — if their income has not grown by 26%, the deficit is financed either through reduced savings or increased debt. The data shows both have happened.The personal savings rate in May 2026 was 3.0% (BLS data, cited Walnut Invest July 2026). For context: the US personal savings rate averaged approximately 7–8% in the decade before the pandemic. It spiked to over 30% in April 2020 on stimulus payments, then collapsed as those one-time transfers ended and inflation arrived. By 2022–2024, the savings rate was already suppressed. At 3.0% in May 2026, it is at its lowest sustainable level and one shock away from going negative.
The structural math is unforgiving. At a 3.0% savings rate, a household earning $60,000 gross (approximately $4,500 net/month) is saving approximately $1,800 per year. Building a three-month emergency fund of $12,000 at that rate takes 6.7 years — assuming no withdrawals. For the 53% who withdrew an average of $2,900 from savings in the past year, the net savings accumulation is negative. Not financial advice.
Who Is Hit Hardest: The Generational and Gender Breakdown
The financial stress documented in the aggregate data does not fall equally across the population. The generational breakdown from Bankrate’s 2025 Emergency Savings Report (cited AccountsRecovery July 2025) is striking: among Gen Z, 34% have no emergency savings, and only 10% have six months saved. This is consistent with the life-stage expectation — Gen Z workers are earlier in their careers, earning less, and often carrying student debt. But the 34% with nothing is a structural vulnerability that becomes a societal risk as this cohort ages.The gender gap in emergency savings is significant. The US News 2026 Financial Wellness Survey (cited 401K Specialist Magazine 2026) found that nearly 48% of women say they don’t have an emergency fund, compared with about one-third of men. This gap reflects the persistent gender pay gap, the higher share of women in part-time and gig economy work, and the disproportionate childcare costs borne by female-headed households. Financial fragility is not evenly distributed, and the data shows it concentrates in women and younger adults.
The holiday spending finding is also generationally specific: 23% of Americans admitted to tapping emergency savings for holiday purchases, with younger adults disproportionately represented (US News 2026 Financial Wellness Survey). This reflects both the social pressure of holiday spending and the reality that emergency savings, when they exist, are often the only accessible pool of liquid money for households with thin credit availability. Not financial advice.
The Priority Paradox: Saving vs Paying Down Debt
Bankrate’s 2026 Annual Emergency Savings Report (polled December 2025) captures a genuine dilemma facing American households: what to prioritise when both emergency savings and credit card debt demand immediate attention. The findings: 31% say building savings and reducing debt are equally important. 29% say increasing savings is the higher priority. 21% say paying down debt is more important.Bankrate chief financial analyst Greg McBride, CFA, offered a concrete piece of guidance: ‘Households starting out 2026 with a goal of increasing their emergency savings will be more likely to succeed by finding ways to increase their income rather than searching for more expenses to cut.’ This reframes the standard financial advice around the income side of the equation rather than the cost side — acknowledging that for many households, there are no more expenses to cut.
The Credible 2025 report found that 52% of Americans are focused on building savings while 48% are prioritising debt repayment. The near-even split reflects the genuine mathematical tension: paying down 20% credit card debt is the equivalent of a guaranteed 20% return on investment, which mathematically beats building a savings account earning 4–5%. But without any savings buffer, the household remains one $1,000 shock away from adding more debt at 20%. The financially optimal answer is to do both: small emergency fund first, then aggressive debt repayment, then rebuild the full emergency fund. Not financial advice.
What the Data Means for the Broader Economy
The consumer financial stress data has macroeconomic implications that extend beyond individual households. Consumer spending represents approximately 70% of US GDP. A household sector that is simultaneously depleting savings, accumulating debt, and facing rising delinquency rates is a fragile engine for economic growth. When the 62% living paycheck to paycheck face a job loss or income reduction, they immediately reduce spending, which creates a multiplier effect through the retail, restaurant, travel, and entertainment sectors.The PaymentsNext July 2025 analysis notes: ‘As consumer fragility intensifies, failures in digital payments, overdrafts, or embedded credit might trigger scrutiny.’ The rising delinquency rates in credit cards (7.6% to 12.8% serious delinquency over four years) and auto loans (5.2% serious delinquency, near the 2010 record) are early indicators of systemic consumer credit stress that flows into bank earnings, credit availability, and lending standards.
The NY Fed researchers were explicit in their August 2026 commentary: the paycheck-to-paycheck dynamic means that a single adverse event — a layoff, a medical emergency, a natural disaster — can trigger delinquency for a large share of households who are currently current on their payments but have no buffer. This is the structural fragility that the $18.8 trillion debt figure and the 24% with zero savings represent at a systemic level. Not financial advice.
What You Can Do: Personal Finance Steps From the Data
The aggregate data is alarming. The personal response does not need to match the aggregate scale. The Bankrate and Credible data, combined with McBride’s income-first guidance, suggests specific, practical steps. Not financial advice. Consult a qualified financial adviser or non-profit credit counsellor for personalised guidance (NFCC: 1-800-388-2227).- Start with a $1,000 emergency fund before anything else. The data shows 59% of Americans cannot cover a $1,000 shock. Getting to $1,000 in savings is the single highest-priority financial action for anyone currently at zero. At $100 per month, it takes 10 months. At $200 per month, 5 months. Automate the transfer on payday.
- Target income growth over expense cutting. McBride’s specific advice (Bankrate 2026): households will more likely succeed building emergency savings by finding ways to increase income. A second income stream, overtime, or a higher-paying job has more leverage than a budget cut at this stage of the savings crisis.
- Address credit card debt at 20% as the priority after the initial buffer. Mathematically, paying down 20% debt is the equivalent of a 20% guaranteed return. After the $1,000 emergency fund, direct surplus cash toward the highest-rate credit card balance using the avalanche method.
- Do not tap emergency savings for discretionary spending. 27% of those with emergency funds have used them for non-essentials (Credible 2025). 23% tapped savings for holiday purchases (US News 2026). The emergency fund loses its value as a resilience tool the moment it becomes a convenience fund.
- Check the NFCC directory for non-profit credit counselling. If credit card debt is unmanageable, a non-profit credit counsellor (not a for-profit debt settlement company) can help negotiate lower rates through a debt management plan. NFCC helpline: 1-800-388-2227. Free and low-cost options exist.
- If you have an employer 401(k) match, capture it even while paying debt. The employer match is a guaranteed 50–100% return on the matched portion, which beats even the 20% credit card rate on the matched dollars. Contribute enough to get the full match, then direct remaining surplus to credit card paydown.
Conclusion
The data published in 2025 and 2026 from the Federal Reserve Bank of New York, Bankrate, Credible, the Bureau of Labor Statistics, and multiple national survey organisations tells a coherent and worrying story. Total household debt at a record $18.8 trillion. Credit card debt at $1.26 trillion, near its own record. Auto loans at a record $1.71 trillion. Delinquency rates at their highest since 2017. 24% of Americans with zero emergency savings. 67% who believe they will never feel financially secure. A personal savings rate of 3.0%. Consumer prices 26% higher than 2019.The phrase ‘running out of money’ does not describe every American household. It describes a specific and growing subset: the 24% with no savings, the 62% living paycheck to paycheck, the 29% with more credit card debt than savings, the 12.8% with credit card balances 90+ days delinquent. These are not hypothetical future risks. They are the current, documented financial condition of tens of millions of American households in October 2026.
What happens next is not written. The same data that shows the crisis also shows the response: 52% of Americans are trying to build savings. 29% say increasing savings is their top financial priority. Younger Americans are building emergency funds at higher rates than their peers (US News 2026). The aggregate data is a snapshot, not a destiny. The households that take the $1,000 emergency fund step this month, redirect $100 more per month toward credit card debt, and find one additional income source will look different in two years. The data documents the problem. The action is individual. Not financial advice.
Frequently Asked Questions
How much household debt do Americans have in 2026?Total US household debt reached $18.8 trillion in Q1 2026, according to the Federal Reserve Bank of New York's Q1 2026 Household Debt and Credit Report (cited ABC News August 12, 2026; Walnut Invest July 2026). The breakdown by category (Q1-Q2 2026, NY Fed): credit card debt $1.26 trillion (Q2 2026, near the $1.28 trillion Q4 2025 record); auto loan debt $1.71 trillion (new record); student debt $1.65 trillion; mortgages make up the majority of remaining debt. The average household owed $155,594 at the end of 2025, approximately $12,000 below the all-time high (TNND/KMPH News citing NY Fed). Consumer prices are 26% higher than December 2019 (BLS CPI, Bankrate 2026), providing context for why debt has grown: many households have been financing their cost of living through debt as real wages have not kept pace with cumulative inflation.
What percentage of Americans have no emergency savings?
24% of Americans have no emergency savings at all, according to Bankrate (cited Walnut Invest July 2026). Credible's 2025 American Savings Report found the broader figure of 37% of Americans lacking an emergency fund by the standard definition. Only 41% of Americans could cover a $1,000 emergency expense using savings — a three-year low (Bankrate 2025 Emergency Savings Report). 60% are uncomfortable with their emergency savings level (Bankrate). 67% say they will never feel financially secure (Credible 2025). Gender breakdown: nearly 48% of women say they don't have an emergency fund, compared with about one-third of men (US News 2026 Financial Wellness Survey). Gen Z: 34% have no emergency savings at all (Bankrate 2025).
What is the credit card delinquency rate in 2026?
The percentage of credit card balances more than 90 days delinquent rose from 7.6% in mid-2022 to 12.8% in early 2026 — a 68% increase in serious credit card delinquency over four years (Federal Reserve Bank of New York, via ABC News August 12, 2026). Overall delinquency rates on all outstanding household debt climbed to 4.8% in Q4 (year not specified, likely 2025 Q4) — the highest rate since 2017 (NY Fed, cited TNND/KMPH News). Auto loans in serious delinquency hit 5.2%, nearing the record set in 2010 during the financial crisis aftermath. NY Fed researchers noted (August 2026): 'There are a lot of households who live paycheck to paycheck, and it just needs one thing to happen to them that could lead to a delinquency.' Researchers also noted the higher rates partly reflect old outstanding debts rather than only new defaults. Source: ABC News August 12, 2026 (NY Fed Q2 2026 data).
What percentage of Americans live paycheck to paycheck in 2026?
Approximately 62% of American adults report living paycheck to paycheck, according to Walnut Invest's July 2026 personal finance statistics compilation (citing multiple underlying data sources). This means that after meeting monthly fixed obligations — rent or mortgage, utilities, food, transportation, and debt service — there is little or nothing left to save or buffer against unexpected expenses. Credible's 2025 American Savings Report supports this picture: 53% of Americans withdrew money from savings in the past year (average $2,900 withdrawal), and 1 in 5 had no funds in their savings account at some point in the past 6 months. The figure has increased from pre-pandemic levels as cumulative inflation of 26% since December 2019 (BLS CPI, Bankrate 2026) has squeezed household purchasing power.
What should I do if I have no emergency savings?
If you have no emergency savings, the first priority is building a $1,000 emergency buffer before addressing other financial goals (with the exception of capturing any employer 401(k) match, which is a guaranteed return). The $1,000 target is specific because the Bankrate data shows this is the threshold at which most unexpected expenses — a car repair, a dental bill, an ER visit — can be handled without going into high-interest debt. At $100 per month saved, it takes 10 months; at $200 per month, 5 months. Automate the transfer on payday so it happens before discretionary spending. After the $1,000 emergency fund: address high-interest credit card debt (the avalanche method — highest rate first). Then build toward the full 3-6 month emergency fund. If credit card debt is unmanageable, non-profit credit counselling is available through NFCC (National Foundation for Credit Counseling) at 1-800-388-2227. Not financial advice. Consult a qualified CFP for personalised guidance.
0 Comments
Be the first to share your thoughts on this article.