

Investing
The Bond Market Is Warning Stocks: What History Says Is Next

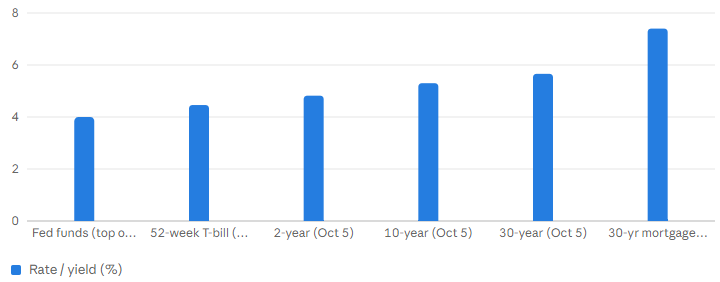
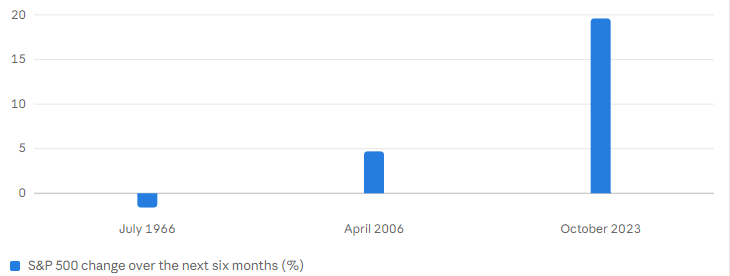
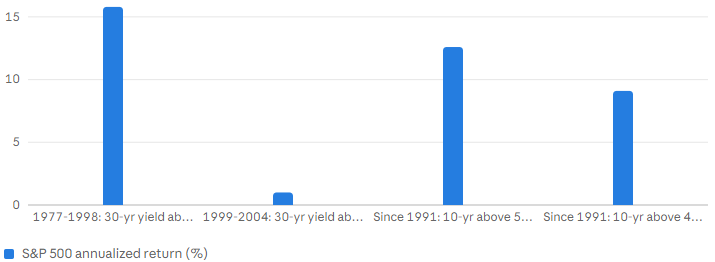
30-year yield 5.66% (highest daily close in over 24 years), 10-year about 5.30%, 2-year about 4.82%; the 10-year touched 5.00% on Sept 14 (first time since 2023, second since 2007); 5.19% on Oct 14. S&P 500: forward P/E about 20 (earnings yield about 5.0%) vs a 10-year yield of about 5.24%: an equity risk premium near −0.2 points (author’s arithmetic). CAPE about 41.6. History: after 5% breakouts, S&P 500 six-month change: 1966 −1.6%; 2006 +4.7%; 2023 +19.6%. UBS: stocks roughly flat on average over three months after eight sharp yield spikes since 1985. 2007: stocks rose about four months to an October 9 record, then fell. Regimes: S&P 500 about 15.8% a year while the 30-year yield was above 5% from 1977 to 1998, but about 1% a year from 1999 to 2004; Hartford: about 12.6% a year since 1991 when the 10-year was above 5%. Backdrop: Fed funds 3.75%–4.00% after a September hike; inflation 3.7%; 30-year mortgage 7.40%; 52-week T-bill 4.46%.
When the two screens disagree, investors ask which one is right. Headlines say the bond market is warning stocks. Maybe. But if you ask what history says is coming next, the honest answer is more interesting than a yes or a no: the last few times the 10-year crossed 5%, stocks went three different ways. This post walks through them and explains what separated the outcomes.
A steepening curve is not the same as an inverted one, which has often preceded recessions. It says investors want more compensation for lending to the government for a long time. That extra compensation is the term premium, and it can rise on inflation worries, government borrowing or uncertainty. Inflation was 3.7% in September, and Bank of America’s Michael Hartnett has argued that a rising term premium may threaten stocks more than another Fed hike, and that a hike could even help stabilize long-term yields. That is one analyst’s view, but it shows the debate. October 5, 2026: 2-year about 4.82%; 10-year about 5.30%; 30-year 5.66% (highest daily close in over 24 years). 10-year touched 5.00% on September 14 and was 5.19% on October 14. Fed funds 3.75%–4.00%; 52-week T-bill about 4.46%.
There is a simple way to see the first effect. The S&P 500’s forward price-to-earnings ratio was about 20 in mid-October, which implies an earnings yield of about 5.0% (one divided by 20). The 10-year Treasury yielded about 5.24% on October 12. By my arithmetic, the gap, often called the equity risk premium, is about negative 0.2 points. In 2023, Bloomberg noted that it had fallen near zero, its lowest in over two decades. It is a rough yardstick, since earnings estimates can be wrong and stocks can grow earnings while a bond cannot, but it explains the unease.
The second is 2007, the scary one. Yields climbed above 5% in the spring and peaked in June, but stocks did not fall right away. The S&P 500 kept rising for roughly four months, reaching an all-time closing high on October 9, 2007, according to CNBC reporting. Then the housing and credit crisis arrived, and the index lost more than half its value by March 2009, roughly 57%. Stocks can keep rising after the bond market sends a warning, and the warning can still be right.
The third is the quiet case. After the 10-year crossed 5% in July 1966, the S&P 500 was essentially flat over the next six months, down 1.6%. After April 2006, it rose 4.7% over six months. And when UBS looked at eight sharp 10-year yield spikes since 1985, it found that the S&P 500 was on average relatively flat over the following three months. None of these was a crash, and none was a boom. Most of the time, the immediate result was ordinary.
Six months after 10-year yield breakouts above 5%: 1966 −1.6%; April 2006 +4.7%; October 2023 +19.6%. UBS: stocks about flat on average three months after eight sharp yield spikes since 1985. In 2007, stocks rose about four months, then fell roughly 57% peak to trough.
Hartford Funds found something similar: since 1991 the S&P 500 returned about 12.6% a year when the 10-year yield was above 5%, versus about 9.1% when it was above 4.5%, as reported by the Motley Fool. Yields that rise on strong growth can coexist with strong stock returns. Yields that rise on inflation fear or a swelling term premium are harder on valuations without improving earnings. So the questions are: how expensive are stocks, how fast are earnings growing and why are yields rising?
So 2026 has features of each analog. Strong earnings and a reversal in yields would look like 2023. Expensive valuations and an overextended long end would look uncomfortably like 2007. A sideways grind would look like 1966. I cannot tell you which it will be, and neither can the strategists on television. What the pattern says is that outcomes depend on things that can change, which is a good reason to prepare for several of them.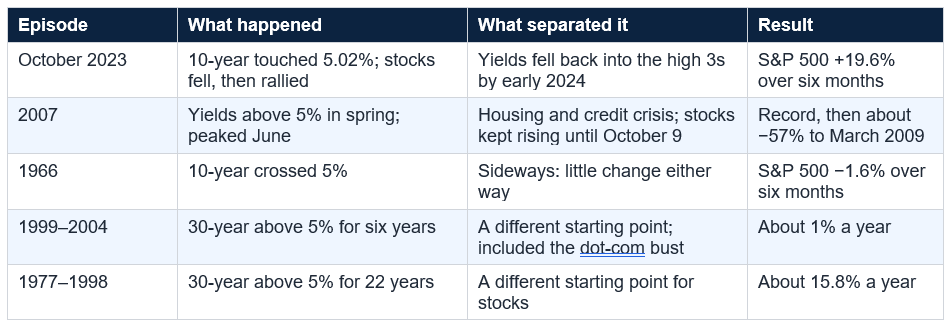
For savers, the news is good. A 52-week T-bill paid about 4.46% and top savings accounts 4.34% to 4.50%, roughly matching inflation. For bond investors, rising yields are a double-edged sword: existing bond prices fall by roughly the bond’s duration times the change in yield, so a 10-year Treasury with a duration near 8 loses roughly 8% for each one-point rise, but new money earns more. For borrowers and would-be buyers, it is a reminder that rates, not just prices, drive affordability.
Keep in mind: Historical episodes are small samples. Every one involved different economic conditions, and none is guaranteed to repeat. Use them to prepare for a range of outcomes, not to forecast a single one.
What decided those outcomes was valuation, earnings growth and why yields were rising, and today’s picture contains elements of each. So respond the way history rewards: stay diversified, keep your timeline in view, hold money you need soon in safer assets that now pay well, rebalance rather than react and watch the signals that matter. A qualified adviser can help you apply this to your situation.
Higher yields raise the return investors can earn with little risk, which makes stocks less attractive by comparison and lowers the present value of future earnings. They also raise borrowing costs for companies and households. In October 2026 the 10-year yield was around 5.2% and a 52-week Treasury bill paid about 4.46%.
Did stocks crash after the 10-year yield last hit 5%?
It depends on which time. In October 2023 the S&P 500 fell about 4% more after the breakout, bottomed on October 27, then rose 19.6% over the next six months. In 2007 stocks kept rising for about four months, reached a record on October 9, then entered a deep bear market. The two cases ended very differently.
Is an inverted yield curve the warning sign here?
Not right now. The curve has been steepening rather than inverting: on October 5 the 2-year yield was about 4.82%, the 10-year 5.30% and the 30-year 5.66%. The warning is about the long end rising, which reflects inflation, government borrowing and the term premium, not a classic inversion.
Should I sell stocks because yields are above 5%?
History does not support selling on that signal alone. Selling requires two correct decisions, when to get out and when to get back in. Investors who need money soon, or who hold more stocks than they can stomach, may want to adjust. Everyone else is usually better served by a plan and regular rebalancing. This is general information, not advice.
What should bond investors do when yields rise?
Higher yields hurt existing bond prices, roughly by the bond’s duration times the change in yield, but they also raise future income. Short-term Treasury bills and CDs now pay 4.4% to 5%, and reinvesting at higher rates helps over time. Match bond maturities to when you need the money.
Table of Contents
- The Calm Before, or After, the Warning
- The Short Answer
- What the Bond Market Is Actually Saying
- Why Stocks Should Care
- What History Says: Three Moments at 5%
- What Separated the Outcomes
- Applying It to 2026
- The Analogs at a Glance
- What It Means for You
- Signals Worth Watching
- Mistakes to Avoid
- Conclusion
- Frequently Asked Questions
The long end is leading: US rates by maturity, October 2026 (%)
Yield / rate (%) by Saxo (Oct 5), MyMoneyBlog (Oct 9), Freddie Mac (Oct 15)
S&P 500 six months after the 10-year yield broke above 5% (%)
Six-month change (%) by Source: Odaily analysis of historical episodes; 2007 omitted (see text)
Same high yields, very different stock returns (S&P 500, % per year)
Annualized return (%) by Valuation at the start, not the yield alone, separated the outcomes
The Calm Before, or After, the Warning
There is a strange split-screen in markets right now. On one screen, stocks are near records and the VIX, Wall Street’s fear gauge, sat around 15.5 on October 5, a calm reading. On the other, the bond market is shouting. That same day the 30-year Treasury yield closed at 5.66%, its highest daily close in more than 24 years, while the 10-year yield, which touched 5.00% on September 14 for the first time since 2023, was near 5.30%.When the two screens disagree, investors ask which one is right. Headlines say the bond market is warning stocks. Maybe. But if you ask what history says is coming next, the honest answer is more interesting than a yes or a no: the last few times the 10-year crossed 5%, stocks went three different ways. This post walks through them and explains what separated the outcomes.
The Short Answer
History does not give one answer. After 10-year yields reached 5% in 2023, stocks fell a bit more and then rallied 19.6% in six months. In 2007, they kept rising for about four months and then suffered one of the worst bear markets on record. In 1966, they went sideways. What separated these outcomes was not the yield itself but the valuation stocks started from, the earnings growth behind them and the reason yields were rising. A 5% yield is a reason to pay attention, not a reason to panic.What the Bond Market Is Actually Saying
Start with the shape of the curve. The Federal Reserve raised its target range to 3.75%–4.00% in September. A 52-week Treasury bill paid about 4.46% in early October. On October 5, the 2-year yield was around 4.82%, the 10-year about 5.30% and the 30-year 5.66%, according to Saxo. The long end rose while the 2-year barely moved, so the curve steepened. The 10-year minus 2-year gap was about 0.48 points, up from 0.33 in mid-September.A steepening curve is not the same as an inverted one, which has often preceded recessions. It says investors want more compensation for lending to the government for a long time. That extra compensation is the term premium, and it can rise on inflation worries, government borrowing or uncertainty. Inflation was 3.7% in September, and Bank of America’s Michael Hartnett has argued that a rising term premium may threaten stocks more than another Fed hike, and that a hike could even help stabilize long-term yields. That is one analyst’s view, but it shows the debate. October 5, 2026: 2-year about 4.82%; 10-year about 5.30%; 30-year 5.66% (highest daily close in over 24 years). 10-year touched 5.00% on September 14 and was 5.19% on October 14. Fed funds 3.75%–4.00%; 52-week T-bill about 4.46%.
Why Stocks Should Care
Higher yields matter for stocks in three ways. First, they raise the bar: when a risk-free bond pays 5.3%, stocks have to promise more to be worth the risk. Second, they lower the value today of distant earnings, which tends to hit richly valued growth stocks hardest. Third, they raise borrowing costs: the 30-year mortgage rate reached 7.40% on October 15, which squeezes housing and consumer spending.There is a simple way to see the first effect. The S&P 500’s forward price-to-earnings ratio was about 20 in mid-October, which implies an earnings yield of about 5.0% (one divided by 20). The 10-year Treasury yielded about 5.24% on October 12. By my arithmetic, the gap, often called the equity risk premium, is about negative 0.2 points. In 2023, Bloomberg noted that it had fallen near zero, its lowest in over two decades. It is a rough yardstick, since earnings estimates can be wrong and stocks can grow earnings while a bond cannot, but it explains the unease.
What History Says: Three Moments at 5%
The cleanest way to think about it is through three episodes. The first is October 2023. The 10-year yield broke above 5% between October 19 and 23, touching 5.02% intraday, the highest since 2007. According to DataTrek, the S&P 500 fell 10.3% from July 31 to October 27 as yields rose from about 4% to about 5%. The index bottomed at 4,117 on October 27, then reversed sharply, rising 19.6% over the next six months as yields retreated.The second is 2007, the scary one. Yields climbed above 5% in the spring and peaked in June, but stocks did not fall right away. The S&P 500 kept rising for roughly four months, reaching an all-time closing high on October 9, 2007, according to CNBC reporting. Then the housing and credit crisis arrived, and the index lost more than half its value by March 2009, roughly 57%. Stocks can keep rising after the bond market sends a warning, and the warning can still be right.
The third is the quiet case. After the 10-year crossed 5% in July 1966, the S&P 500 was essentially flat over the next six months, down 1.6%. After April 2006, it rose 4.7% over six months. And when UBS looked at eight sharp 10-year yield spikes since 1985, it found that the S&P 500 was on average relatively flat over the following three months. None of these was a crash, and none was a boom. Most of the time, the immediate result was ordinary.
Six months after 10-year yield breakouts above 5%: 1966 −1.6%; April 2006 +4.7%; October 2023 +19.6%. UBS: stocks about flat on average three months after eight sharp yield spikes since 1985. In 2007, stocks rose about four months, then fell roughly 57% peak to trough.
What Separated the Outcomes
If the bond yield were the whole story, all three would look alike. They do not. According to Motley Fool analysis of Treasury data, from 1977 to 1998 the 30-year yield never closed below 5%, and the S&P 500 returned about 15.8% a year. From 1999 through 2004, with the 30-year still above 5%, it returned about 1% a year, a stretch that included the dot-com bust. Same yield, opposite results. The author concluded that the difference was the starting point for stocks, not the bond.Hartford Funds found something similar: since 1991 the S&P 500 returned about 12.6% a year when the 10-year yield was above 5%, versus about 9.1% when it was above 4.5%, as reported by the Motley Fool. Yields that rise on strong growth can coexist with strong stock returns. Yields that rise on inflation fear or a swelling term premium are harder on valuations without improving earnings. So the questions are: how expensive are stocks, how fast are earnings growing and why are yields rising?
Applying It to 2026
Run those three questions against today. Valuation is mixed. The forward P/E of about 20 is near its five-year average of 19.9, but CAPE, which smooths earnings over ten years, is around 41.6, near an all-time high, a level that has historically coincided with thinner long-run returns. Earnings are a bright spot: estimates cited by FactSet suggest roughly 30% growth for 2026, though sources vary. The reason yields are rising is the uncomfortable part. Inflation has climbed to 3.7%, real wages are down 0.7% and the Fed has resumed raising rates.So 2026 has features of each analog. Strong earnings and a reversal in yields would look like 2023. Expensive valuations and an overextended long end would look uncomfortably like 2007. A sideways grind would look like 1966. I cannot tell you which it will be, and neither can the strategists on television. What the pattern says is that outcomes depend on things that can change, which is a good reason to prepare for several of them.
The Analogs at a Glance
What It Means for You
For stock investors with long horizons, the most useful lesson is that a 5% yield alone is not a sell signal. As one analysis put it, selling because the 10-year crossed 5% requires two correct decisions: when to get out and when to get back in. Keep investing on a schedule, rebalance when your mix drifts and hold only the amount of stock you could sit through a 20% to 30% fall. Money you will need within a few years belongs in safer holdings that now pay more.For savers, the news is good. A 52-week T-bill paid about 4.46% and top savings accounts 4.34% to 4.50%, roughly matching inflation. For bond investors, rising yields are a double-edged sword: existing bond prices fall by roughly the bond’s duration times the change in yield, so a 10-year Treasury with a duration near 8 loses roughly 8% for each one-point rise, but new money earns more. For borrowers and would-be buyers, it is a reminder that rates, not just prices, drive affordability.
Signals Worth Watching
Rather than trying to predict, watch a few markers. The Fed meets October 27–28, and the next inflation report arrives November 10. Watch whether the 10-year settles above 5.5% or retreats, and whether the 30-year keeps making new highs. Watch credit spreads for stress and earnings reports for whether profits are holding up. A low VIX alongside soaring long-term yields is the kind of mismatch that can resolve in either direction.Mistakes to Avoid
The first mistake is treating a single signal as destiny. The second is selling at the first scare and missing a rebound, as happened in October 2023. The third is ignoring the warning entirely, as many did in 2007. The fourth is chasing yield in risky corners because Treasuries look boring. And the fifth is forgetting your own timeline, which matters more than any chart.Keep in mind: Historical episodes are small samples. Every one involved different economic conditions, and none is guaranteed to repeat. Use them to prepare for a range of outcomes, not to forecast a single one.
Conclusion
The bond market is sending a loud message: the cost of long-term money has risen to levels not seen in over two decades, with the 30-year at 5.66% and the 10-year above 5%. Stocks are near records, with a forward earnings yield of about 5.0% that no longer beats the 10-year. That is worth attention. But history’s answer is not a crash and not a cure. It is a spread of outcomes: a 19.6% rally after 2023, a record then a collapse after 2007 and sideways drift in 1966.What decided those outcomes was valuation, earnings growth and why yields were rising, and today’s picture contains elements of each. So respond the way history rewards: stay diversified, keep your timeline in view, hold money you need soon in safer assets that now pay well, rebalance rather than react and watch the signals that matter. A qualified adviser can help you apply this to your situation.
Frequently Asked Questions
Why do rising Treasury yields matter for stocks?Higher yields raise the return investors can earn with little risk, which makes stocks less attractive by comparison and lowers the present value of future earnings. They also raise borrowing costs for companies and households. In October 2026 the 10-year yield was around 5.2% and a 52-week Treasury bill paid about 4.46%.
Did stocks crash after the 10-year yield last hit 5%?
It depends on which time. In October 2023 the S&P 500 fell about 4% more after the breakout, bottomed on October 27, then rose 19.6% over the next six months. In 2007 stocks kept rising for about four months, reached a record on October 9, then entered a deep bear market. The two cases ended very differently.
Is an inverted yield curve the warning sign here?
Not right now. The curve has been steepening rather than inverting: on October 5 the 2-year yield was about 4.82%, the 10-year 5.30% and the 30-year 5.66%. The warning is about the long end rising, which reflects inflation, government borrowing and the term premium, not a classic inversion.
Should I sell stocks because yields are above 5%?
History does not support selling on that signal alone. Selling requires two correct decisions, when to get out and when to get back in. Investors who need money soon, or who hold more stocks than they can stomach, may want to adjust. Everyone else is usually better served by a plan and regular rebalancing. This is general information, not advice.
What should bond investors do when yields rise?
Higher yields hurt existing bond prices, roughly by the bond’s duration times the change in yield, but they also raise future income. Short-term Treasury bills and CDs now pay 4.4% to 5%, and reinvesting at higher rates helps over time. Match bond maturities to when you need the money.
0 Comments
Be the first to share your thoughts on this article.