

Finance
The Cost of the American Dream in 2026 -- Is It Real?

REALITY CHECK | The American Dream now costs over $5 million in lifetime expenses. Median home: $390,300. 75%+ of US homes unaffordable to typical earners. Income needed to buy: $93,000-$113,000 vs median income of $80,000. Down payment savings time in California: 14.1 years. In Pittsburgh: ~6 years. The Dream hasn't disappeared -- but it has split.
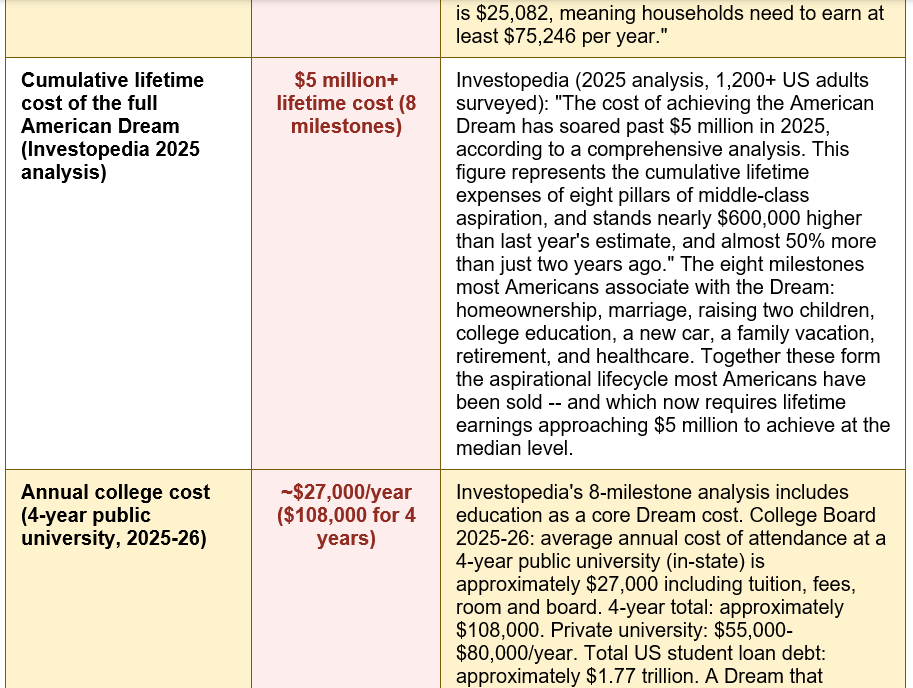
Investopedia's comprehensive 2025 analysis of the American Dream -- drawing on government data, industry statistics, and surveys of more than 1,200 US adults -- found that the cumulative lifetime cost of the eight milestones most Americans associate with a successful middle-class life has soared past $5 million. That figure stands nearly $600,000 higher than the prior year's estimate and almost 50% more than just two years ago. The milestones themselves are familiar: owning a home, getting married, raising two children, college education for those children, a new car, a family vacation, a secure retirement, and healthcare throughout. Together, these aspirations form the scaffolding of the American middle-class life most people were raised to expect. Together, they now require lifetime earnings approaching $5 million to achieve at median cost levels.
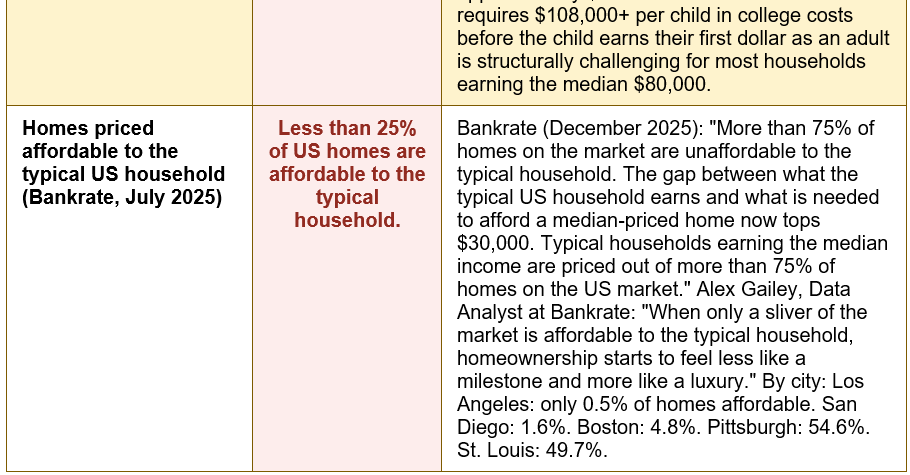
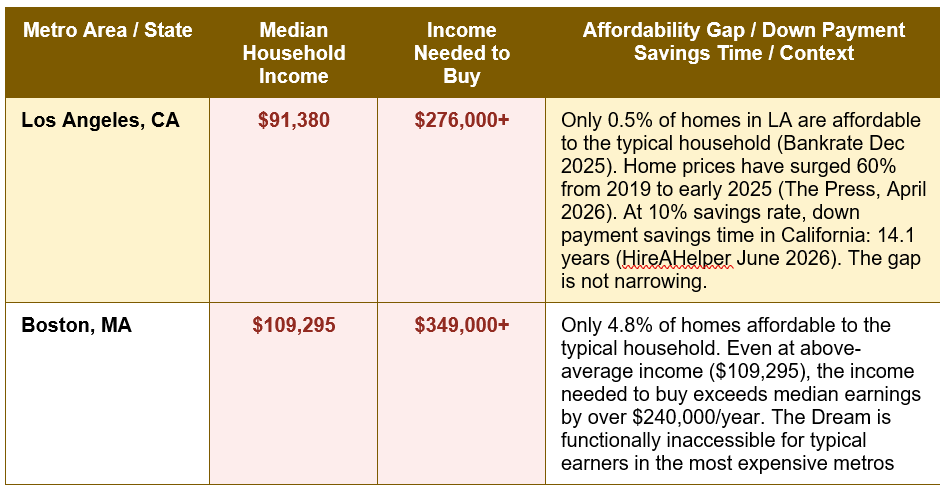
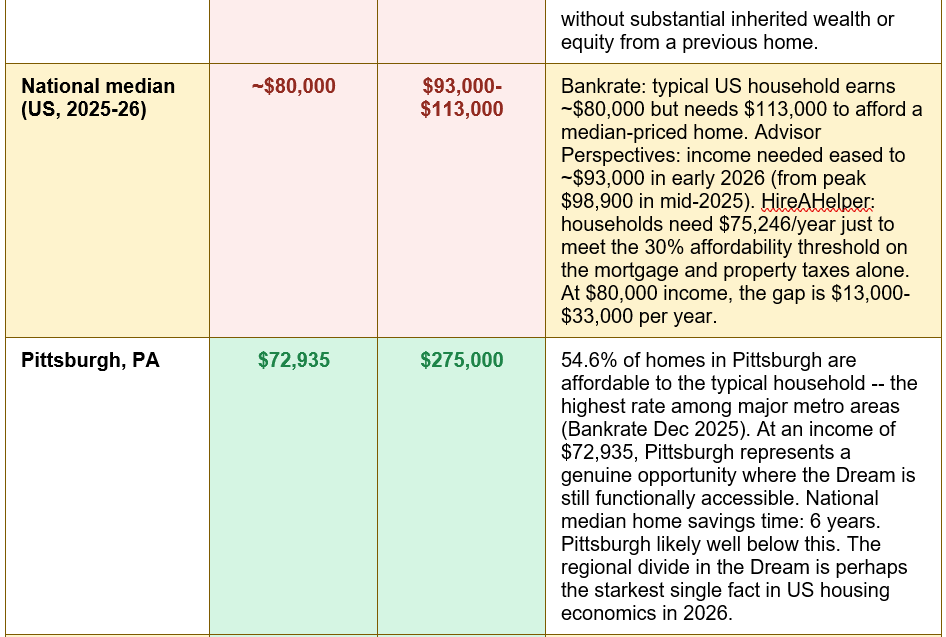
The gap between that number and the actual financial position of most American households is one of the defining economic stories of the decade. The typical US household earns approximately $80,000 per year. Bankrate's December 2025 analysis found that this income is sufficient to afford fewer than 25% of homes on the US market. More than 75% of homes listed for sale are priced beyond what the typical household can afford. In Los Angeles, just 0.5% of homes fall within reach. In San Diego, 1.6%. In Boston, 4.8%. HireAHelper (June 23, 2026): 'Homeownership is no longer aligned with what the average American earns, and it's drifting further out of reach.' This guide breaks down what the American Dream actually costs in 2026, why the gap between dream and reality has grown so wide, and what it means for the tens of millions of Americans still reaching for it.
These eight milestones, combined, produce a lifetime cost that exceeds $5 million at median current prices. Investopedia: the figure stands 'nearly $600,000 higher than last year's estimate, and almost 50% more than just two years ago.' The Dream has not changed. The price has.
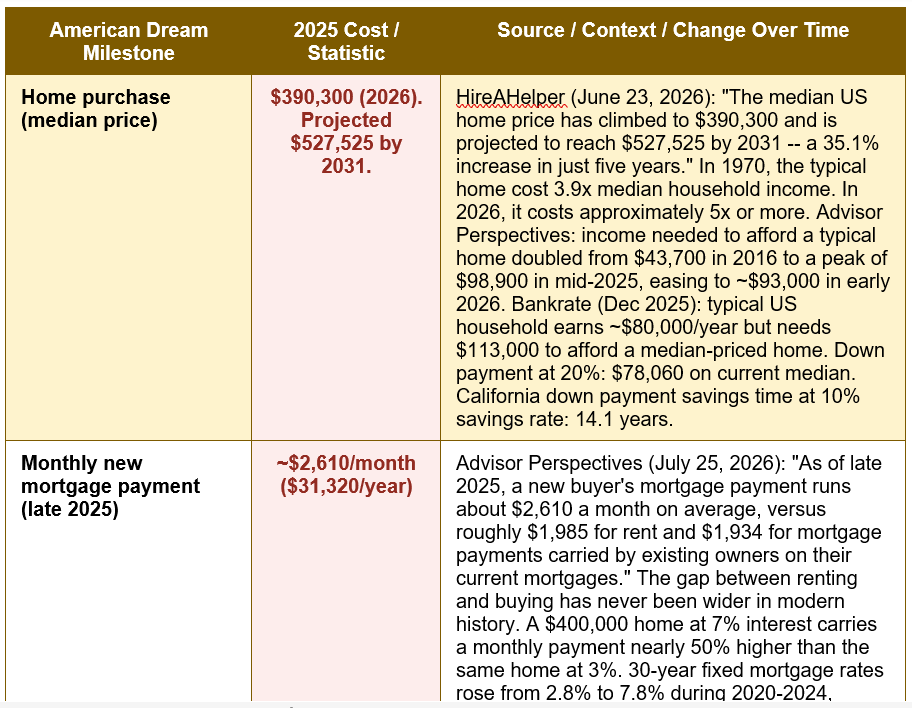
Advisor Perspectives (July 25, 2026 -- most current): 'Google searches for "can I afford a home" are at their highest level in nearly two decades. The answer to this query for many is "nope." Existing home sales are sitting near their lowest February level since 2009. At the same time, home prices haven't collapsed. Since 2022, the monthly cost to buy a house with a new mortgage has pulled dramatically away from both the cost to rent and the cost carried by existing owners on their current mortgages. As of late 2025, a new buyer's mortgage payment runs about $2,610 a month on average, versus roughly $1,985 for rent and $1,934 for mortgage payments carried by existing owners on their current mortgages.'
This three-way divergence -- new buyer costs, renters, and locked-in existing owners -- is itself a structural inequality machine. Existing homeowners, locked in at 2-3% mortgage rates from 2020-2021, pay $1,934/month for the same homes that would cost new buyers $2,610/month. Renters pay $1,985. New entrants to the market face a permanent premium, a mortgage rate penalty that effectively redistributes wealth from new buyers to existing owners. And home prices have not fallen to compensate: AOL/Hometap: 'Home prices have surged 60% from 2019 to early 2025.' The lock-in effect -- existing owners refusing to sell because they would lose their low-rate mortgage -- has further constrained supply, maintaining prices even as demand has fallen. AOL: 'The US faces a documented deficit of 4.7 million housing units.'
The 2026 housing affordability crisis in numbers: Median home: $390,300. Monthly payment: $2,610. Income needed: $93,000-$113,000. Typical household income: $80,000. 75%+ of homes unaffordable. LA: 0.5% affordable. — HireAHelper (June 23, 2026): 'Median US home price $390,300, projected $527,525 by 2031.' Advisor Perspectives (July 25, 2026 -- most current): 'New buyer mortgage payment ~$2,610/month vs rent $1,985 and existing owner $1,934.' Bankrate (Dec 2025): 'More than 75% of homes unaffordable to the typical household. Income needed to afford median home: $113,000 vs typical household income $80,000.' AOL/Hometap (April 2026): 'Home prices surged 60% from 2019 to early 2025. US deficit of 4.7 million housing units.'
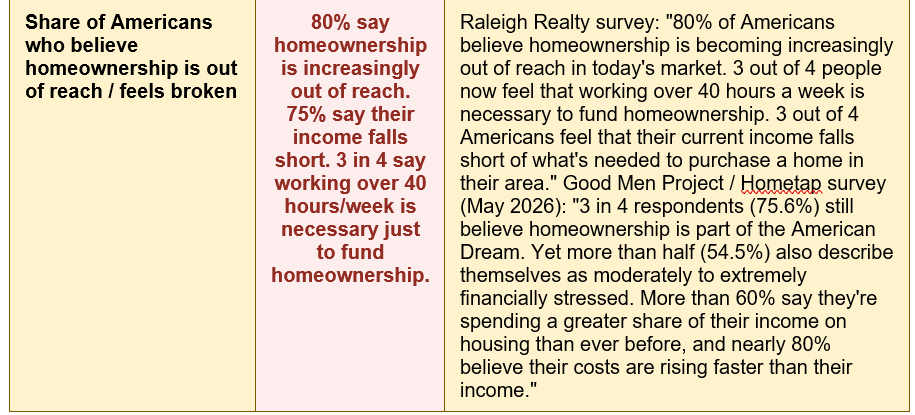
What people actually believe about the American Dream in 2026. Good Men Project/Hometap survey (May 2026, 1,000 homeowners): '3 in 4 respondents (75.6%) still believe homeownership is part of the American Dream. Yet more than half (54.5%) also describe themselves as moderately to extremely financially stressed. More than 60% say they're spending a greater share of their income on housing than ever before, and nearly 80% believe their costs are rising faster than their income.' Despite the financial stress, the belief in the Dream persists. Hometap: 'More than three-quarters of respondents (76%) said they still believe owning a home has value, and more than half (56.5%) said they feel proud to be a homeowner -- even amid the financial stress. That connection reflects how deeply homeownership is woven into Americans' financial and personal aspirations.' The data reveals a population that still believes in the Dream -- and is being financially squeezed by the gap between that belief and current economic conditions. The aspiration persists; it is the arithmetic that has changed.
FIVE FACTS ABOUT THE AMERICAN DREAM THAT MOST PEOPLE DON'T KNOW: (1) 75%+ OF US HOMES ARE UNAFFORDABLE TO THE TYPICAL HOUSEHOLD. Bankrate (Dec 2025): 'More than 75% of homes on the market are unaffordable to the typical household. When only a sliver of the market is affordable, homeownership starts to feel less like a milestone and more like a luxury.' (2) THE DREAM COSTS NEARLY 50% MORE THAN IT DID JUST TWO YEARS AGO. Investopedia 2025: the $5 million lifetime cost of the Dream is 'almost 50% more than just two years ago.' The rate of cost acceleration has exceeded wage growth by a wide margin. (3) NEW BUYERS PAY $676 MORE PER MONTH THAN EXISTING OWNERS FOR THE SAME HOMES. Advisor Perspectives: new buyer monthly payment ($2,610) vs existing owner payment ($1,934) -- a $676/month gap created by the interest rate differential between 2020-21 and 2024-26. This is a structural wealth transfer from new buyers to existing owners. (4) HOME PRICES RELATIVE TO INCOME ARE AT LEVELS NOT SEEN SINCE BEFORE THE 2008 CRASH. America First Policy: household income rose 99.7% since 2000. Median home price rose 150.1%. The gap between these two numbers is the affordability crisis quantified. (5) IN CALIFORNIA, SAVING A DOWN PAYMENT AT A 10% SAVINGS RATE TAKES 14.1 YEARS. HireAHelper (June 2026). The national median is 6 years. The regional divergence in the Dream is as stark as any economic divide in contemporary America.
WHAT TO DO IF THE AMERICAN DREAM FEELS OUT OF REACH: HOMEOWNERSHIP STRATEGIES FOR 2026: (1) Check affordability in multiple markets -- not just where you currently live. Remote and hybrid work has changed the geography of what is possible. Use Bankrate's affordability calculator (bankrate.com/calculators/mortgages/mortgage-affordability-calculator.aspx) and compare markets at realtor.com and zillow.com. (2) Target the 30% rule: your total housing cost (mortgage + insurance + taxes) should not exceed 30% of gross monthly income. Use this as your ceiling, not your target. (3) Down payment assistance: HUD (hud.gov) maintains a list of state and local down payment assistance programmes. Many first-time homebuyers qualify for grants or low-interest loans that reduce the deposit requirement. (4) Consider FHA loans: minimum 3.5% deposit vs 20% conventional. On a $300,000 home: $10,500 vs $60,000. (5) Build credit first: a score of 760+ qualifies for the best mortgage rates. The difference between 680 and 760 on a $350,000 mortgage is approximately $0.5% in rate, or $100+/month. FOR THE BROADER DREAM: (6) Child costs: plan childcare costs years in advance -- the $20,000-$30,000/year per child in many cities is a budget item that must be planned before the child arrives. (7) College costs: open a 529 college savings plan immediately on the birth of each child -- even $50/month compounds over 18 years to a meaningful education fund. (8) Retirement: capture every employer pension or 401(k) match -- this is the highest guaranteed return available. FREE GUIDANCE: CFPB consumerfinance.gov | HUD hud.gov | NFCC nfcc.org.
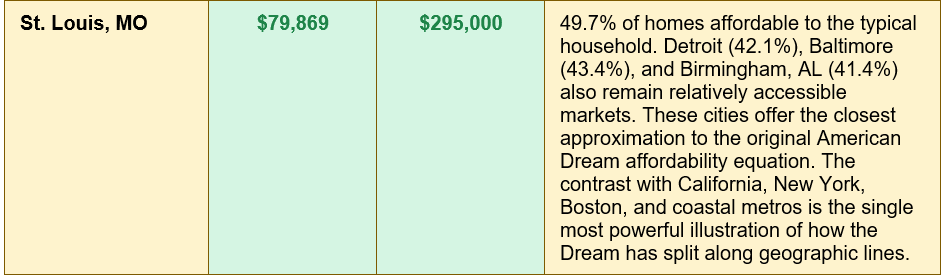
And yet. Hometap's survey of 1,000 homeowners found that 75.6% still believe homeownership is part of the American Dream, even as 54.5% describe themselves as financially stressed. 76% say owning a home still has value. 56.5% say they are proud to be homeowners despite the financial pressure. The aspiration is not broken. The economics are stressed -- but in Pittsburgh, St. Louis, Detroit, Baltimore, and dozens of other Midwestern and Southern cities, the Dream is still functionally accessible to households earning the median income. Geographic flexibility, disciplined saving, modest first purchases, and down payment assistance programmes have not disappeared.
The honest answer to 'can the American Dream still be achieved?' is: yes, but not by the same people, in the same places, or on the same timeline as previous generations. It requires more planning, more patience, more geographic flexibility, and more financial literacy than it has at any point in the past half-century. Advisor Perspectives (July 25, 2026): 'Housing affordability is near its worst levels since the early 1980s.' The Dream is real. The cost is real. And closing the gap between them -- for individuals, for policymakers, and for markets -- is the defining housing challenge of this decade.
Investopedia's 2025 analysis, which surveyed more than 1,200 US adults to identify the milestones Americans most associate with the Dream, placed the cumulative lifetime cost at over $5 million. This figure encompasses eight milestones: homeownership, marriage, raising two children, college education for those children, a new car, family vacations, retirement savings, and healthcare. Investopedia: the $5 million figure 'stands nearly $600,000 higher than last year's estimate, and almost 50% more than just two years ago.' The single largest component is retirement savings -- where Northwestern Mutual's 2026 study places the target at $1.46 million. The next largest is raising and educating two children (approximately $620,000-$666,000 in child-rearing costs plus $216,000+ in college costs). Homeownership, at a median of $390,300 for the purchase price alone -- with non-mortgage costs that have risen 35% since 2019 -- is the milestone most frequently cited as inaccessible. HireAHelper (June 23, 2026): 'The median US home price has climbed to $390,300 and is projected to reach $527,525 by 2031.'
Can the average American still afford to buy a home in 2026?
In most major metro areas, no -- not without significant financial stress or financial assistance. Bankrate (December 2025): 'More than 75% of homes on the market are unaffordable to the typical household. The typical US household earns almost $80,000 per year, but potential homebuyers would need to earn $113,000 per year to afford a median-priced home.' Advisor Perspectives (July 25, 2026): 'The income needed to afford the typical home has more than doubled in a decade, from about $43,700 in early 2016 to a peak of $98,900 in mid-2025, before easing to around $93,000 by early 2026.' The gap between what typical households earn and what they need to comfortably buy a home at median prices now tops $30,000 per year. However, the picture varies dramatically by location. In Pittsburgh, 54.6% of homes are affordable to the typical household. In St. Louis, 49.7%. In Los Angeles, 0.5%. The national average conceals two very different housing realities: accessible in the Midwest and parts of the South, functionally inaccessible in major coastal metro areas. Raleigh Realty survey: '80% of Americans believe homeownership is becoming increasingly out of reach in today's market' -- but that perception is more accurate in some markets than others.
Why have home prices risen so much faster than income?
The divergence between home price growth and income growth is one of the longest-running and most consequential trends in American economics. America First Policy Institute (January 2026): 'As median household income increased 99.7% between 2000 and 2024, the median house sales price increased by 150.1% during the same period.' Several structural forces explain the gap. Supply constraint: AOL/Hometap (April 2026): 'The US faces a documented deficit of 4.7 million housing units. With millennials entering peak homebuying years and older homeowners staying put, inventory has remained persistently tight -- keeping prices elevated.' Chronic under-construction since the 2008 financial crisis has produced a market where demand persistently exceeds supply, preventing prices from falling in response to declining affordability. Interest rate distortion: the period of historically low mortgage rates (2020-2021, when 30-year rates fell to 2.8-3%) drove a surge in buying demand and price appreciation. When rates subsequently rose to 7-7.8%, existing owners -- locked in at the low rates -- reduced their selling, further constraining supply. The resulting 'lock-in effect' has amplified the price level even as transaction volumes have fallen. Climate cost amplification: insurance costs are rising, particularly in climate-risk states, adding to the total cost of ownership beyond the mortgage.
What are the hidden costs of homeownership in 2026?
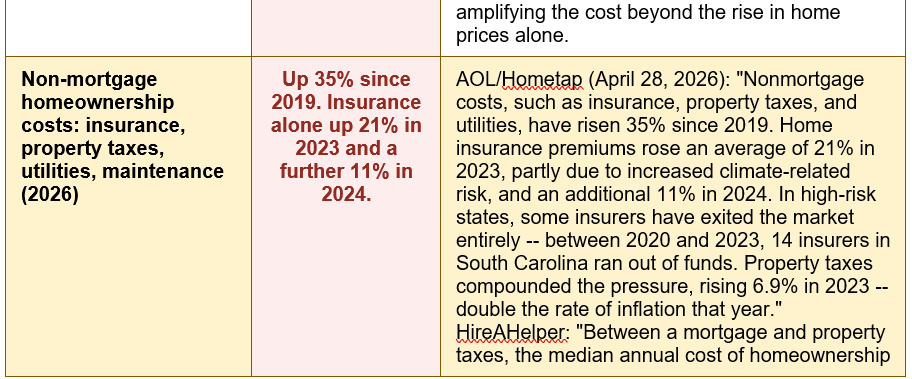
Beyond the mortgage payment, homeownership in 2026 carries a set of non-mortgage costs that have risen dramatically and are frequently underestimated by first-time buyers. AOL/Hometap (April 28, 2026): 'Nonmortgage costs, such as insurance, property taxes, and utilities, have risen 35% since 2019. Home insurance premiums rose an average of 21% in 2023, partly due to increased climate-related risk, and an additional 11% in 2024. In high-risk states, some insurers have exited the market entirely -- between 2020 and 2023, 14 insurers in South Carolina ran out of funds, driving further premium increases for remaining policyholders. Property taxes compounded the pressure, rising 6.9% in 2023 -- double the rate of inflation that year.' HireAHelper (June 2026): 'Between a mortgage and property taxes, the median annual cost of homeownership is $25,082.' This means that before utilities, maintenance, and insurance are added, a household needs $25,082 per year in housing costs alone -- and needs an income of at least $75,246 to keep housing within the traditional 30% affordability threshold. The Good Men Project/Hometap survey (May 2026): 'More than 60% say they're spending a greater share of their income on housing than ever before, and nearly 80% believe their costs are rising faster than their income.' They are correct.
What can Americans do to make the Dream more accessible?
For individuals, the strategies that most effectively close the gap between aspiration and affordability in 2026 involve geographic flexibility, financial preparation, and realistic sequencing of goals. HireAHelper (June 2026): 'Alternative homeownership models, such as rent-to-own or co-ownership, can also provide viable pathways.' Bankrate's December 2025 analysis identifies Pittsburgh, St. Louis, Detroit, Baltimore, and Birmingham as metros where more than 40% of homes are affordable to the typical household -- representing genuine opportunities for households with geographic flexibility. Down payment assistance: HUD maintains state-by-state lists of programmes that can reduce deposit requirements to 3.5% (FHA) or less. Many first-time buyers qualify for assistance they are not aware of. For the broader Dream: systematic early saving for children's education (529 plans), capturing the full employer 401(k) match for retirement, and building credit specifically for mortgage qualification are the three most impactful individual-level financial moves available. At the policy level, housing advocates broadly agree -- Hometap: 'Without an ongoing increase in home supply, the affordability gap is unlikely to close on its own. Sustaining [homeownership] at scale will require systems, tools, and policies that support homeowners not just at the time of purchase, but across their full journey.'
Table of Contents
- A Dream With a Price Tag Most Americans Cannot Afford
- What Is the American Dream? The Eight Milestones and Their 2025-2026 Price Tags
- The Housing Crisis at the Heart of the Dream
- The Price of the American Dream: Statistics and Data (2025-2026)
- The Regional Divide: Where the Dream Still Exists -- and Where It Has Died
- Five Structural Forces That Have Made the Dream More Expensive
- Who Can Still Achieve the Dream -- And What They Are Doing Differently
- Conclusion: A Dream Still Worth Chasing -- With Eyes Open
- Frequently Asked Questions (FAQ)
- How much does the American Dream cost in 2026?
- Can the average American still afford to buy a home in 2026?
- Why have home prices risen so much faster than income?
- What are the hidden costs of homeownership in 2026?
- What can Americans do to make the Dream more accessible?
A Dream With a Price Tag Most Americans Cannot Afford
The American Dream was never a precise financial document. When James Truslow Adams first popularised the phrase in his 1931 book The Epic of America, he described it as 'a dream of a land in which life should be better and richer and fuller for everyone, with opportunity for each according to ability or achievement.' It was a promise of upward mobility, of a better life earned through hard work. It was not, at its origin, denominated in dollars. But in 2026, it very much is.Investopedia's comprehensive 2025 analysis of the American Dream -- drawing on government data, industry statistics, and surveys of more than 1,200 US adults -- found that the cumulative lifetime cost of the eight milestones most Americans associate with a successful middle-class life has soared past $5 million. That figure stands nearly $600,000 higher than the prior year's estimate and almost 50% more than just two years ago. The milestones themselves are familiar: owning a home, getting married, raising two children, college education for those children, a new car, a family vacation, a secure retirement, and healthcare throughout. Together, these aspirations form the scaffolding of the American middle-class life most people were raised to expect. Together, they now require lifetime earnings approaching $5 million to achieve at median cost levels.
The gap between that number and the actual financial position of most American households is one of the defining economic stories of the decade. The typical US household earns approximately $80,000 per year. Bankrate's December 2025 analysis found that this income is sufficient to afford fewer than 25% of homes on the US market. More than 75% of homes listed for sale are priced beyond what the typical household can afford. In Los Angeles, just 0.5% of homes fall within reach. In San Diego, 1.6%. In Boston, 4.8%. HireAHelper (June 23, 2026): 'Homeownership is no longer aligned with what the average American earns, and it's drifting further out of reach.' This guide breaks down what the American Dream actually costs in 2026, why the gap between dream and reality has grown so wide, and what it means for the tens of millions of Americans still reaching for it.
What Is the American Dream? The Eight Milestones and Their 2025-2026 Price Tags
Investopedia's 2025 analysis defined the American Dream as the sum of eight milestones identified through surveys of more than 1,200 US adults as the most commonly cited markers of a successful American life. Each carries a current price tag that has inflated dramatically over the past two to five years:- Homeownership: $390,300 median home price in 2026 (HireAHelper, June 2026). A 20% down payment requires $78,060. Monthly mortgage at 7%: approximately $2,075 on the principal alone, or $2,610 total with taxes and insurance (Advisor Perspectives, July 2026). Household income required: $75,246-$113,000 depending on the source and assumptions used. This single milestone is the financial cornerstone of the Dream -- and the one most definitively out of reach for the majority of American households.
- Marriage: The average cost of a wedding in the US has reached approximately $30,000, according to The Knot's 2024 Real Weddings Study -- and the number continues to rise. Combined with the financial restructuring that follows household merger, marriage represents a significant upfront cost in the Dream's financial structure.
- Raising two children to adulthood: USDA estimates place the average cost of raising a child to age 18 in the US at approximately $310,000-$333,000 at current price levels, before any college costs. Two children: approximately $620,000-$666,000. This figure has increased substantially due to childcare cost inflation -- the cost of full-time childcare in most major cities now exceeds $20,000-$30,000 per year per child.
- College education for those children: College Board 2025-26: average annual cost of attendance at a 4-year in-state public university is approximately $27,000. Four-year total: $108,000 per child, or $216,000 for two. Private university costs run $55,000-$80,000+ per year. Total US student loan debt stands at approximately $1.77 trillion -- the accumulated evidence that the education component of the Dream is being financed by debt rather than savings.
- A new car (and replacement): The average new car price in the US has risen to approximately $47,000-$48,000 in 2025. Most households will buy multiple vehicles over their lifetime. Two new cars over the course of a working life: approximately $100,000 at today's prices, not accounting for financing costs.
- Annual family vacation: The average US family vacation cost has risen significantly -- a 2024 survey by Vacation.com placed the average family vacation spend at approximately $5,600 per trip. Over 30 working years, this component alone reaches approximately $168,000.
- Healthcare throughout life: Fidelity's 2025 estimate places average healthcare costs for a 65-year-old couple retiring today at $330,000 in after-tax savings for the remainder of retirement -- not including long-term care. Lifetime healthcare including working years: several hundred thousand dollars per person.
- Retirement: Northwestern Mutual's 2026 Planning and Progress Study places the "magic number" Americans believe they need to retire comfortably at $1.46 million. Against this benchmark, the median American household is severely underprepared.
These eight milestones, combined, produce a lifetime cost that exceeds $5 million at median current prices. Investopedia: the figure stands 'nearly $600,000 higher than last year's estimate, and almost 50% more than just two years ago.' The Dream has not changed. The price has.
The Housing Crisis at the Heart of the Dream
Of all the components of the American Dream, housing is the most structurally broken in 2026. The numbers converge on a single stark conclusion: homeownership has transitioned from a widely achievable milestone to a luxury product accessible to a shrinking minority of American households -- not because of temporary economic conditions, but because of structural forces that are unlikely to reverse without significant policy intervention.Advisor Perspectives (July 25, 2026 -- most current): 'Google searches for "can I afford a home" are at their highest level in nearly two decades. The answer to this query for many is "nope." Existing home sales are sitting near their lowest February level since 2009. At the same time, home prices haven't collapsed. Since 2022, the monthly cost to buy a house with a new mortgage has pulled dramatically away from both the cost to rent and the cost carried by existing owners on their current mortgages. As of late 2025, a new buyer's mortgage payment runs about $2,610 a month on average, versus roughly $1,985 for rent and $1,934 for mortgage payments carried by existing owners on their current mortgages.'
This three-way divergence -- new buyer costs, renters, and locked-in existing owners -- is itself a structural inequality machine. Existing homeowners, locked in at 2-3% mortgage rates from 2020-2021, pay $1,934/month for the same homes that would cost new buyers $2,610/month. Renters pay $1,985. New entrants to the market face a permanent premium, a mortgage rate penalty that effectively redistributes wealth from new buyers to existing owners. And home prices have not fallen to compensate: AOL/Hometap: 'Home prices have surged 60% from 2019 to early 2025.' The lock-in effect -- existing owners refusing to sell because they would lose their low-rate mortgage -- has further constrained supply, maintaining prices even as demand has fallen. AOL: 'The US faces a documented deficit of 4.7 million housing units.'
The 2026 housing affordability crisis in numbers: Median home: $390,300. Monthly payment: $2,610. Income needed: $93,000-$113,000. Typical household income: $80,000. 75%+ of homes unaffordable. LA: 0.5% affordable. — HireAHelper (June 23, 2026): 'Median US home price $390,300, projected $527,525 by 2031.' Advisor Perspectives (July 25, 2026 -- most current): 'New buyer mortgage payment ~$2,610/month vs rent $1,985 and existing owner $1,934.' Bankrate (Dec 2025): 'More than 75% of homes unaffordable to the typical household. Income needed to afford median home: $113,000 vs typical household income $80,000.' AOL/Hometap (April 2026): 'Home prices surged 60% from 2019 to early 2025. US deficit of 4.7 million housing units.'
The Price of the American Dream: Statistics and Data (2025-2026)
The following table maps the most current data on the cost of the American Dream across its key milestones, with source citations and context:
The Regional Divide: Where the Dream Still Exists -- and Where It Has Died
The American Dream has always carried a geographic dimension -- opportunities varied by state and city. But in 2026, that variation has become a chasm. The homeownership component of the Dream is functionally accessible in some markets and functionally extinct in others:
Five Structural Forces That Have Made the Dream More Expensive
COST #1: THE INTEREST RATE SHOCK | How rates rose from 2.8% to 7.8% and changed everything
America First Policy Institute (January 2026): 'The median 30-year mortgage rates jumped from 2.8% to 7.8%, and median home prices rose by over 30%. As a result, in 2024, Americans needed to make over $100,000 to comfortably afford a home, which is up 80% from January 2020.' Advisor Perspectives (July 25, 2026): 'A $400,000 home financed for 30 years at 7% has a monthly mortgage payment nearly 50% higher than the same home financed at 3% annual interest.' The rate shock is the single most disruptive force in the post-2022 housing market. At 3%, the monthly payment on a $390,300 home (20% down, $312,240 financed) is approximately $1,317. At 7%, the same home costs $2,078 per month -- $761 more every month, $9,132 more every year, for the identical house. This rate amplification means that even if home prices had remained flat (they did not), the monthly cost of homeownership would have increased 58% simply due to the interest rate change.COST #2: THE HIDDEN COSTS EXPLOSION | Insurance, property taxes, maintenance -- all rising faster than inflation
AOL/Hometap (April 28, 2026): 'Home insurance premiums rose an average of 21% in 2023, partly due to increased climate-related risk, and an additional 11% in 2024. Property taxes compounded the pressure, rising 6.9% in 2023 -- double the rate of inflation that year. Nonmortgage costs, such as insurance, property taxes, and utilities, have risen 35% since 2019.' HireAHelper (June 2026): 'Between a mortgage and property taxes, the median annual cost of homeownership is $25,082.' The Good Men Project/Hometap survey (May 2026): 'More than 60% say they're spending a greater share of their income on housing than ever before, and nearly 80% believe their costs are rising faster than their income. They're right.' The hidden cost acceleration is particularly damaging because these costs are largely non-discretionary: homeowners cannot opt out of property taxes, cannot skip insurance without losing their mortgage, and cannot defer maintenance indefinitely without destroying the asset's value.COST #3: THE SUPPLY CRISIS | 4.7 million missing homes -- and the deficit that is keeping prices elevated
AOL/Hometap (April 2026): 'The US faces a documented deficit of 4.7 million housing units. With millennials entering peak homebuying years and older homeowners staying put, inventory has remained persistently tight -- keeping prices elevated.' America First Policy Institute (January 2026): 'Housing prices have appreciated exponentially over several decades, increasing 167% between 1970 and 2024, 70% post-Great Recession, and 17% since the pandemic.' The supply crisis is structural rather than cyclical. New housing construction has chronically underperformed demand since the 2008 financial crisis, when builders contracted sharply and never fully recovered their pre-crisis building rates. The millennial generation -- the largest US generational cohort -- is now in its prime homebuying years (ages 28-43 in 2026). The combination of peak demographic demand and historically constrained supply is the physics of the price problem. Housing advocates broadly agree: without an ongoing increase in home supply, the affordability gap is unlikely to close on its own.COST #4: WAGE GROWTH THAT CANNOT KEEP PACE | Median income: 99.7% rise since 2000. Median home price: 150.1% rise.
America First Policy Institute (January 2026): 'As median household income increased 99.7% between 2000 and 2024, the median house sales price increased by 150.1% during the same period.' Raleigh Realty survey: '3 out of 4 Americans feel that their current income falls short of what's needed to purchase a home in their area.' The income-to-home-price ratio, which stood at approximately 3.9x in 1970, now stands at approximately 5x nationally and at 10x or more in the highest-cost markets. Advisor Perspectives (July 25, 2026): 'The income needed to afford the typical home has more than doubled in a decade, from about $43,700 in early 2016 to a peak of $98,900 in mid-2025.' Even as wages have grown in absolute terms, they have not kept pace with the compounding effect of home price appreciation and interest rate increases. The household earning $80,000 today has not been made whole by their wage growth -- they face a higher proportional barrier to homeownership than their counterparts in 2000 or 2010.COST #5: THE STUDENT DEBT OVERHANG | $1.77 trillion in student loans -- the down payment that cannot be saved
Investopedia's eight-milestone Dream analysis includes college education as a foundational component. The cost of that education has grown from an affordable public investment to a multi-decade financial burden for most households without family wealth. College Board 2025-26: average total cost of attendance at a 4-year public university is approximately $27,000 per year. With two children, a middle-class family faces $216,000 or more in college costs. Total US student loan debt stands at approximately $1.77 trillion -- the financial residue of three decades of real college cost increases outpacing financial aid and income growth simultaneously. The connection to homeownership is direct and documented: student loan payments reduce the monthly savings available for a down payment, reduce debt-to-income ratios for mortgage qualification, and delay household formation by years. The student debt generation arrives at the housing market already carrying one component of the Dream while reaching for another. The two debts compete for the same limited monthly income.What people actually believe about the American Dream in 2026. Good Men Project/Hometap survey (May 2026, 1,000 homeowners): '3 in 4 respondents (75.6%) still believe homeownership is part of the American Dream. Yet more than half (54.5%) also describe themselves as moderately to extremely financially stressed. More than 60% say they're spending a greater share of their income on housing than ever before, and nearly 80% believe their costs are rising faster than their income.' Despite the financial stress, the belief in the Dream persists. Hometap: 'More than three-quarters of respondents (76%) said they still believe owning a home has value, and more than half (56.5%) said they feel proud to be a homeowner -- even amid the financial stress. That connection reflects how deeply homeownership is woven into Americans' financial and personal aspirations.' The data reveals a population that still believes in the Dream -- and is being financially squeezed by the gap between that belief and current economic conditions. The aspiration persists; it is the arithmetic that has changed.
Who Can Still Achieve the Dream -- And What They Are Doing Differently
Despite the structural barriers, the American Dream is not equally inaccessible everywhere or to everyone. The households achieving it in 2026 are navigating the gap between aspiration and affordability through specific strategies -- not all of which require exceptional income.- Geographic arbitrage: choosing where to live based on affordability: Bankrate (Dec 2025): Pittsburgh (54.6% affordable), St. Louis (49.7%), Detroit (42.1%), Baltimore (43.4%), and Birmingham (41.4%) remain markets where the typical household income can access more than 40% of listed homes. HireAHelper (June 2026): "The national median time to save for a down payment is six years, but in California it is 14.1 years." Remote and hybrid work arrangements have expanded the geographic flexibility available to many professional households, allowing them to earn in higher-income markets while buying in more affordable ones. This geographic arbitrage is perhaps the most powerful single strategy available to households trying to access the homeownership component of the Dream in 2026.
- Buying below the median: Raleigh Realty: "37% of Americans say an affordable home costs less than $100,000." While that threshold is unrealistic in most major metro areas, in the Midwest and South, starter homes in the $150,000-$250,000 range remain available. The trade-off: location, commute, and local opportunity. The households achieving homeownership in 2026 are overwhelmingly doing so by buying modestly and building equity, not by buying aspirationally and stretching.
- Co-ownership and alternative models: Raleigh Realty: "Alternative homeownership models, such as rent-to-own or co-ownership, can also provide viable pathways to owning a home." Co-ownership with a partner, family member, or friend effectively pools income and down payment resources, increasing buying power without requiring individual income increases. Rent-to-own arrangements allow a portion of monthly payments to be credited toward a future purchase.
- Patience and systematic saving: HireAHelper: "The national median time to save for a down payment is 6 years." For most households not starting from a position of existing equity or family wealth, the path to homeownership runs through years of disciplined saving, debt reduction, and credit building. The households that achieve it are not those who found a shortcut -- they are those who sustained the process.
FIVE FACTS ABOUT THE AMERICAN DREAM THAT MOST PEOPLE DON'T KNOW: (1) 75%+ OF US HOMES ARE UNAFFORDABLE TO THE TYPICAL HOUSEHOLD. Bankrate (Dec 2025): 'More than 75% of homes on the market are unaffordable to the typical household. When only a sliver of the market is affordable, homeownership starts to feel less like a milestone and more like a luxury.' (2) THE DREAM COSTS NEARLY 50% MORE THAN IT DID JUST TWO YEARS AGO. Investopedia 2025: the $5 million lifetime cost of the Dream is 'almost 50% more than just two years ago.' The rate of cost acceleration has exceeded wage growth by a wide margin. (3) NEW BUYERS PAY $676 MORE PER MONTH THAN EXISTING OWNERS FOR THE SAME HOMES. Advisor Perspectives: new buyer monthly payment ($2,610) vs existing owner payment ($1,934) -- a $676/month gap created by the interest rate differential between 2020-21 and 2024-26. This is a structural wealth transfer from new buyers to existing owners. (4) HOME PRICES RELATIVE TO INCOME ARE AT LEVELS NOT SEEN SINCE BEFORE THE 2008 CRASH. America First Policy: household income rose 99.7% since 2000. Median home price rose 150.1%. The gap between these two numbers is the affordability crisis quantified. (5) IN CALIFORNIA, SAVING A DOWN PAYMENT AT A 10% SAVINGS RATE TAKES 14.1 YEARS. HireAHelper (June 2026). The national median is 6 years. The regional divergence in the Dream is as stark as any economic divide in contemporary America.
WHAT TO DO IF THE AMERICAN DREAM FEELS OUT OF REACH: HOMEOWNERSHIP STRATEGIES FOR 2026: (1) Check affordability in multiple markets -- not just where you currently live. Remote and hybrid work has changed the geography of what is possible. Use Bankrate's affordability calculator (bankrate.com/calculators/mortgages/mortgage-affordability-calculator.aspx) and compare markets at realtor.com and zillow.com. (2) Target the 30% rule: your total housing cost (mortgage + insurance + taxes) should not exceed 30% of gross monthly income. Use this as your ceiling, not your target. (3) Down payment assistance: HUD (hud.gov) maintains a list of state and local down payment assistance programmes. Many first-time homebuyers qualify for grants or low-interest loans that reduce the deposit requirement. (4) Consider FHA loans: minimum 3.5% deposit vs 20% conventional. On a $300,000 home: $10,500 vs $60,000. (5) Build credit first: a score of 760+ qualifies for the best mortgage rates. The difference between 680 and 760 on a $350,000 mortgage is approximately $0.5% in rate, or $100+/month. FOR THE BROADER DREAM: (6) Child costs: plan childcare costs years in advance -- the $20,000-$30,000/year per child in many cities is a budget item that must be planned before the child arrives. (7) College costs: open a 529 college savings plan immediately on the birth of each child -- even $50/month compounds over 18 years to a meaningful education fund. (8) Retirement: capture every employer pension or 401(k) match -- this is the highest guaranteed return available. FREE GUIDANCE: CFPB consumerfinance.gov | HUD hud.gov | NFCC nfcc.org.
Conclusion
The American Dream in 2026 carries a price tag that would have been unimaginable to the generation that defined it. Investopedia's analysis puts the lifetime cost at over $5 million -- nearly $600,000 higher than the prior year's estimate. The median home now costs $390,300 and requires an income that more than 75% of American households do not have. New homebuyers pay $2,610 per month on a mortgage while locked-in existing owners pay $1,934 for the same homes. The down payment in California takes 14.1 years to save at a 10% savings rate. These numbers are not spin -- they are the documented arithmetic of the gap between aspiration and affordability.And yet. Hometap's survey of 1,000 homeowners found that 75.6% still believe homeownership is part of the American Dream, even as 54.5% describe themselves as financially stressed. 76% say owning a home still has value. 56.5% say they are proud to be homeowners despite the financial pressure. The aspiration is not broken. The economics are stressed -- but in Pittsburgh, St. Louis, Detroit, Baltimore, and dozens of other Midwestern and Southern cities, the Dream is still functionally accessible to households earning the median income. Geographic flexibility, disciplined saving, modest first purchases, and down payment assistance programmes have not disappeared.
The honest answer to 'can the American Dream still be achieved?' is: yes, but not by the same people, in the same places, or on the same timeline as previous generations. It requires more planning, more patience, more geographic flexibility, and more financial literacy than it has at any point in the past half-century. Advisor Perspectives (July 25, 2026): 'Housing affordability is near its worst levels since the early 1980s.' The Dream is real. The cost is real. And closing the gap between them -- for individuals, for policymakers, and for markets -- is the defining housing challenge of this decade.
Frequently Asked Questions (FAQ)
How much does the American Dream cost in 2026?Investopedia's 2025 analysis, which surveyed more than 1,200 US adults to identify the milestones Americans most associate with the Dream, placed the cumulative lifetime cost at over $5 million. This figure encompasses eight milestones: homeownership, marriage, raising two children, college education for those children, a new car, family vacations, retirement savings, and healthcare. Investopedia: the $5 million figure 'stands nearly $600,000 higher than last year's estimate, and almost 50% more than just two years ago.' The single largest component is retirement savings -- where Northwestern Mutual's 2026 study places the target at $1.46 million. The next largest is raising and educating two children (approximately $620,000-$666,000 in child-rearing costs plus $216,000+ in college costs). Homeownership, at a median of $390,300 for the purchase price alone -- with non-mortgage costs that have risen 35% since 2019 -- is the milestone most frequently cited as inaccessible. HireAHelper (June 23, 2026): 'The median US home price has climbed to $390,300 and is projected to reach $527,525 by 2031.'
Can the average American still afford to buy a home in 2026?
In most major metro areas, no -- not without significant financial stress or financial assistance. Bankrate (December 2025): 'More than 75% of homes on the market are unaffordable to the typical household. The typical US household earns almost $80,000 per year, but potential homebuyers would need to earn $113,000 per year to afford a median-priced home.' Advisor Perspectives (July 25, 2026): 'The income needed to afford the typical home has more than doubled in a decade, from about $43,700 in early 2016 to a peak of $98,900 in mid-2025, before easing to around $93,000 by early 2026.' The gap between what typical households earn and what they need to comfortably buy a home at median prices now tops $30,000 per year. However, the picture varies dramatically by location. In Pittsburgh, 54.6% of homes are affordable to the typical household. In St. Louis, 49.7%. In Los Angeles, 0.5%. The national average conceals two very different housing realities: accessible in the Midwest and parts of the South, functionally inaccessible in major coastal metro areas. Raleigh Realty survey: '80% of Americans believe homeownership is becoming increasingly out of reach in today's market' -- but that perception is more accurate in some markets than others.
Why have home prices risen so much faster than income?
The divergence between home price growth and income growth is one of the longest-running and most consequential trends in American economics. America First Policy Institute (January 2026): 'As median household income increased 99.7% between 2000 and 2024, the median house sales price increased by 150.1% during the same period.' Several structural forces explain the gap. Supply constraint: AOL/Hometap (April 2026): 'The US faces a documented deficit of 4.7 million housing units. With millennials entering peak homebuying years and older homeowners staying put, inventory has remained persistently tight -- keeping prices elevated.' Chronic under-construction since the 2008 financial crisis has produced a market where demand persistently exceeds supply, preventing prices from falling in response to declining affordability. Interest rate distortion: the period of historically low mortgage rates (2020-2021, when 30-year rates fell to 2.8-3%) drove a surge in buying demand and price appreciation. When rates subsequently rose to 7-7.8%, existing owners -- locked in at the low rates -- reduced their selling, further constraining supply. The resulting 'lock-in effect' has amplified the price level even as transaction volumes have fallen. Climate cost amplification: insurance costs are rising, particularly in climate-risk states, adding to the total cost of ownership beyond the mortgage.
What are the hidden costs of homeownership in 2026?
Beyond the mortgage payment, homeownership in 2026 carries a set of non-mortgage costs that have risen dramatically and are frequently underestimated by first-time buyers. AOL/Hometap (April 28, 2026): 'Nonmortgage costs, such as insurance, property taxes, and utilities, have risen 35% since 2019. Home insurance premiums rose an average of 21% in 2023, partly due to increased climate-related risk, and an additional 11% in 2024. In high-risk states, some insurers have exited the market entirely -- between 2020 and 2023, 14 insurers in South Carolina ran out of funds, driving further premium increases for remaining policyholders. Property taxes compounded the pressure, rising 6.9% in 2023 -- double the rate of inflation that year.' HireAHelper (June 2026): 'Between a mortgage and property taxes, the median annual cost of homeownership is $25,082.' This means that before utilities, maintenance, and insurance are added, a household needs $25,082 per year in housing costs alone -- and needs an income of at least $75,246 to keep housing within the traditional 30% affordability threshold. The Good Men Project/Hometap survey (May 2026): 'More than 60% say they're spending a greater share of their income on housing than ever before, and nearly 80% believe their costs are rising faster than their income.' They are correct.
What can Americans do to make the Dream more accessible?
For individuals, the strategies that most effectively close the gap between aspiration and affordability in 2026 involve geographic flexibility, financial preparation, and realistic sequencing of goals. HireAHelper (June 2026): 'Alternative homeownership models, such as rent-to-own or co-ownership, can also provide viable pathways.' Bankrate's December 2025 analysis identifies Pittsburgh, St. Louis, Detroit, Baltimore, and Birmingham as metros where more than 40% of homes are affordable to the typical household -- representing genuine opportunities for households with geographic flexibility. Down payment assistance: HUD maintains state-by-state lists of programmes that can reduce deposit requirements to 3.5% (FHA) or less. Many first-time buyers qualify for assistance they are not aware of. For the broader Dream: systematic early saving for children's education (529 plans), capturing the full employer 401(k) match for retirement, and building credit specifically for mortgage qualification are the three most impactful individual-level financial moves available. At the policy level, housing advocates broadly agree -- Hometap: 'Without an ongoing increase in home supply, the affordability gap is unlikely to close on its own. Sustaining [homeownership] at scale will require systems, tools, and policies that support homeowners not just at the time of purchase, but across their full journey.'
0 Comments
Be the first to share your thoughts on this article.