

Finance
The State of US Household Finance: Federal Reserve Data

Table of Contents
- At a Glance by Region
- Introduction: Stable at the Aggregate, Uneven at the Household Level
- The National Picture: SHED 2025 Key Metrics in Full
- The US Income Map: Median Household Income by Region and State
- Financial Wellbeing by Demographic: Who Is Falling Behind
- The Five Forces Shaping US Household Finance in 2025-2026
- Conclusion: Stable at the Top, Strained at the Margins
- Frequently Asked Questions (FAQ)
- What percentage of Americans are doing okay financially in 2025?
- Which US state has the highest and lowest median household income?
- How much does the average American household owe in 2025-2026?
- Why do only 25% of Americans rate the national economy as good or excellent?
- What is the Federal Reserve SHED report and why does it matter for household finances?
- External References & Further Reading
At a Glance by Region
Before the detailed data, here is the US household financial picture mapped across its six major economic regions -- from the highest-income Northeast corridor to the lowest-income Deep South: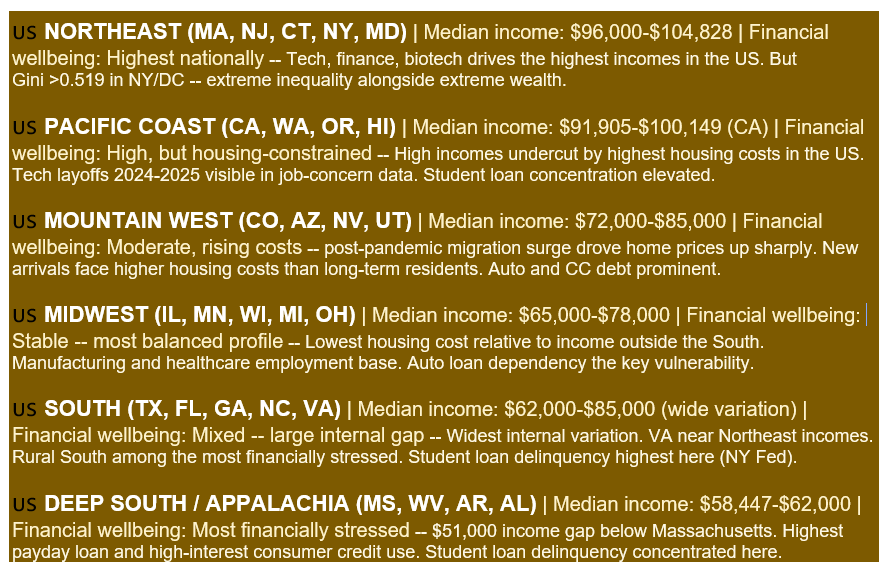
Stable at the Aggregate, Uneven at the Household Level
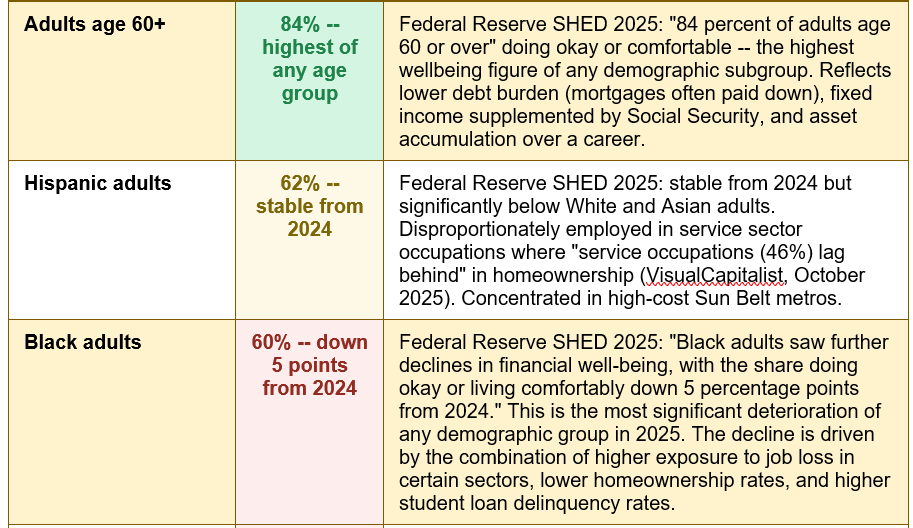
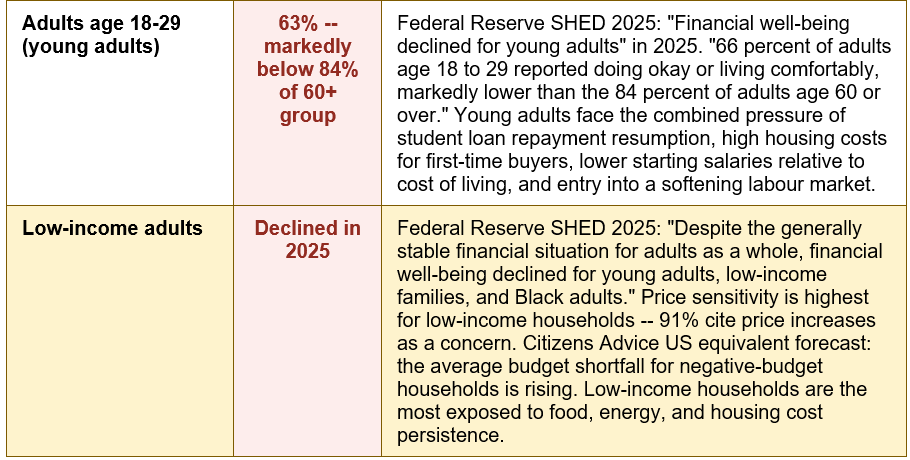
On May 13, 2026, the Federal Reserve released its Economic Well-Being of U.S. Households report for 2025 -- the 13th annual Survey of Household Economics and Decisionmaking (SHED), conducted in October 2025 across nearly 13,000 adults. The headline finding: 73% of US adults report doing okay or living comfortably financially. The same figure as 2024. Aggregate household net worth rose by $2.2 trillion in Q4 2025. Household debt payments represent just 11.3% of disposable income -- well below the 15.8% peak of 2007. The broad strokes suggest a household finance sector that is stable, even resilient.Look at the subgroups, and a different picture emerges. Black adults saw a 5-percentage-point decline in financial wellbeing from 2024 -- the most significant deterioration of any demographic group. Young adults (18-29) report just 63% doing okay, compared to 84% of those aged 60 and over. Concerns about finding or keeping a job rose from 37% to 42% between 2024 and 2025. Ninety-one percent of all US adults cite price increases as at least a minor financial concern. Only about 25% of Americans rate the national economy as good or excellent -- half the share who did so before the pandemic in 2019. The aggregate is stable. The distribution is not.
This guide presents the complete state of US household finances in 2025-2026: the Federal Reserve's most current data, the census bureau's income-by-state picture, the demographic breakdown of financial wellbeing, the regional map of income and debt stress, and the five structural forces that will shape American household finances through 2027. It uses data from the most current sources available as of August 2026.
The National Picture: SHED 2025 Key Metrics in Full
The following table maps the Federal Reserve's most current household finance data from the SHED 2025 report (released May 13, 2026):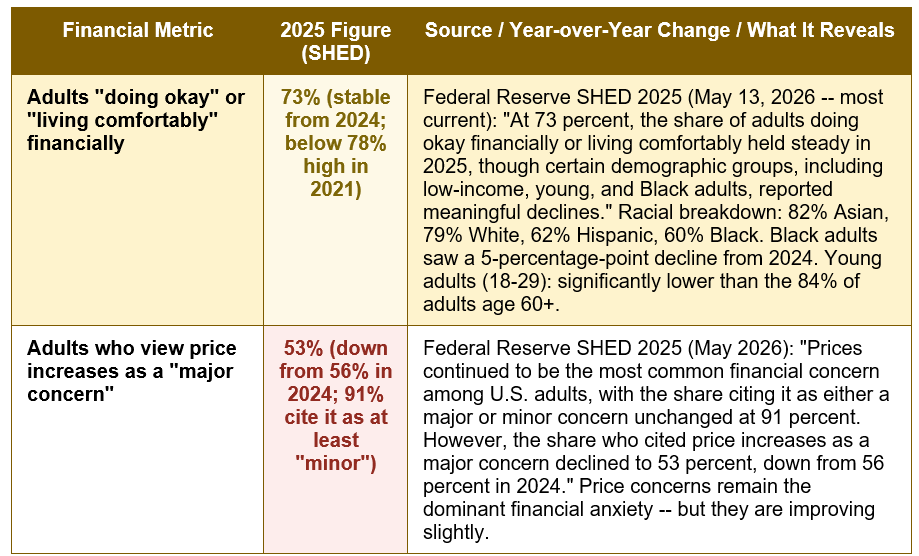
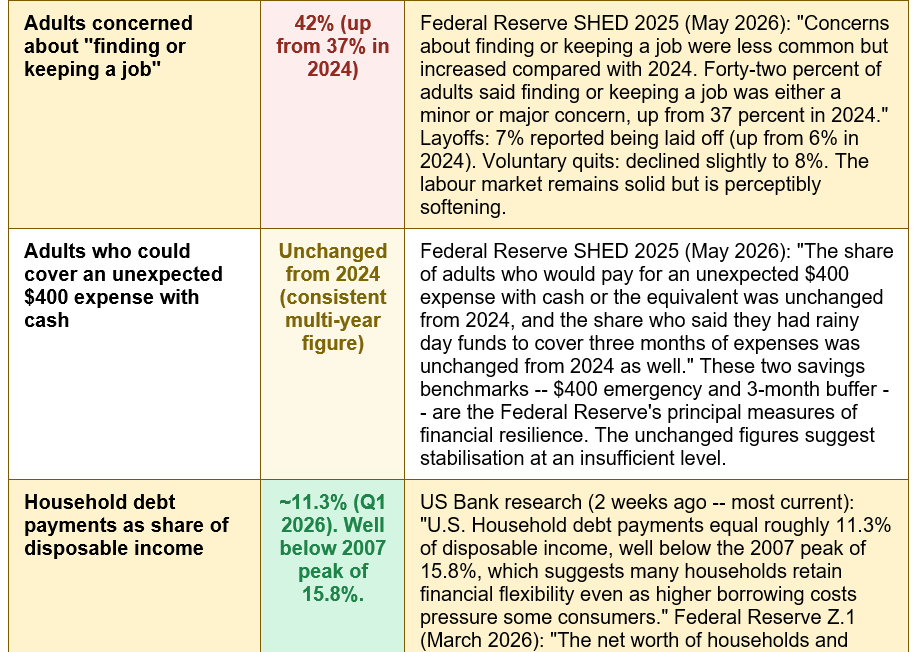
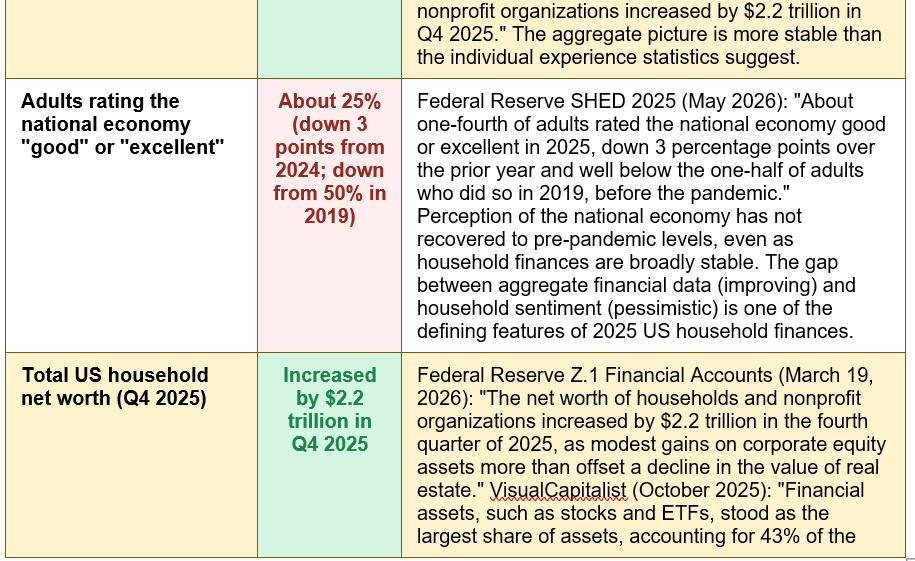

US household finance 2025 -- the defining numbers: 73% doing okay (stable). 91% cite price concerns. 42% worried about jobs (up from 37%). 11.3% debt-to-income ratio. Net worth +$2.2T Q4 2025. — Federal Reserve SHED 2025 (May 13, 2026 -- most current, 13,000 adults surveyed Oct 2025): '73% doing okay or comfortable. 91% cite price increases as concern. 53% call it major concern (down from 56%). 42% worried about jobs -- up from 37%.' US Bank research (2 weeks ago): '11.3% debt-to-income ratio -- below 15.8% 2007 peak.' Federal Reserve Z.1 (March 2026): 'Net worth +$2.2 trillion Q4 2025.' Only 25% rate national economy as good/excellent -- down from 50% in 2019.
The US Income Map: Median Household Income by Region and State
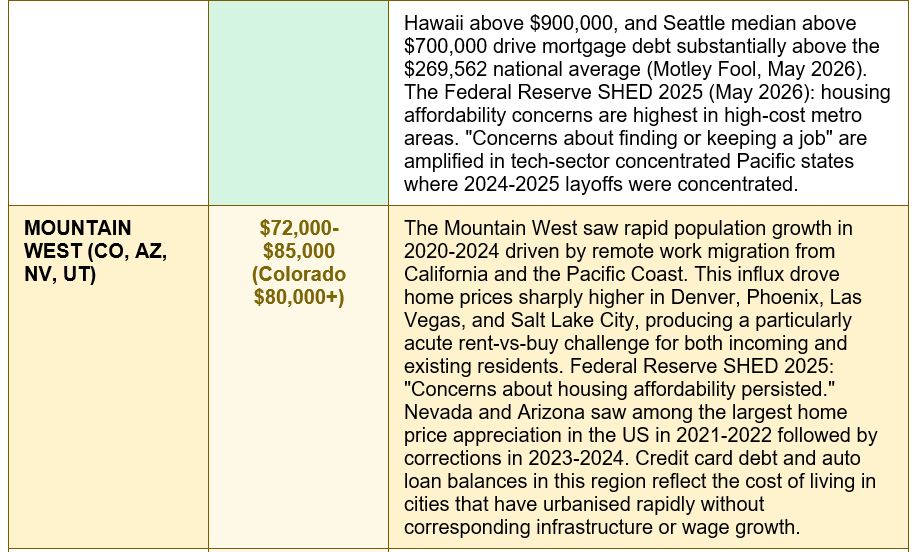
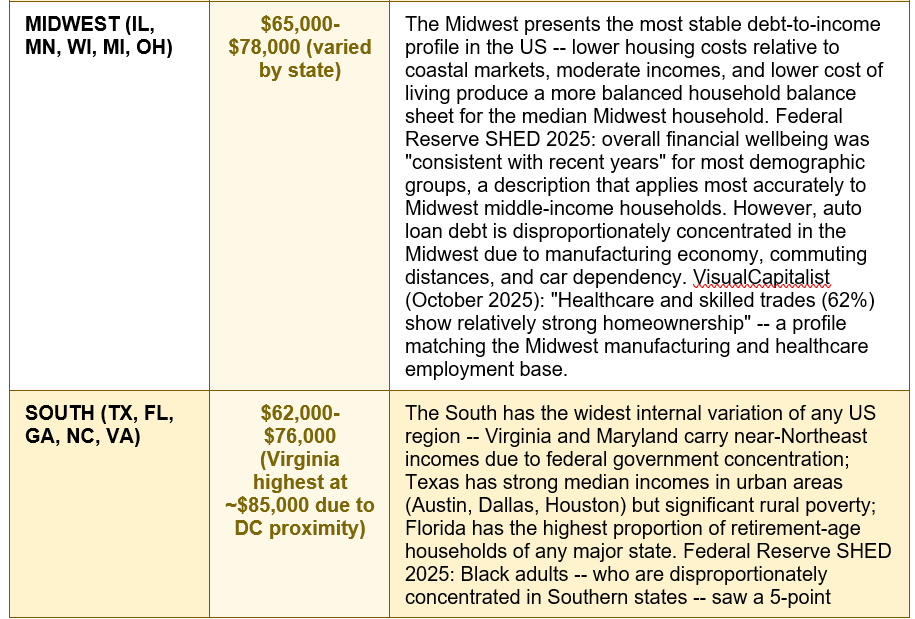
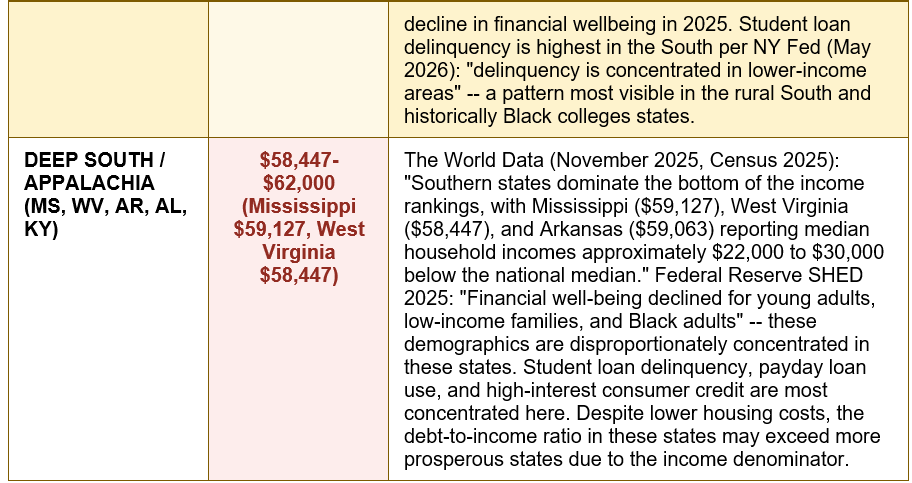
The $51,000 gap between the highest and lowest median household incomes in the US -- from Massachusetts at $104,828 to Mississippi at $59,127 -- is one of the most significant structural features of American household finances: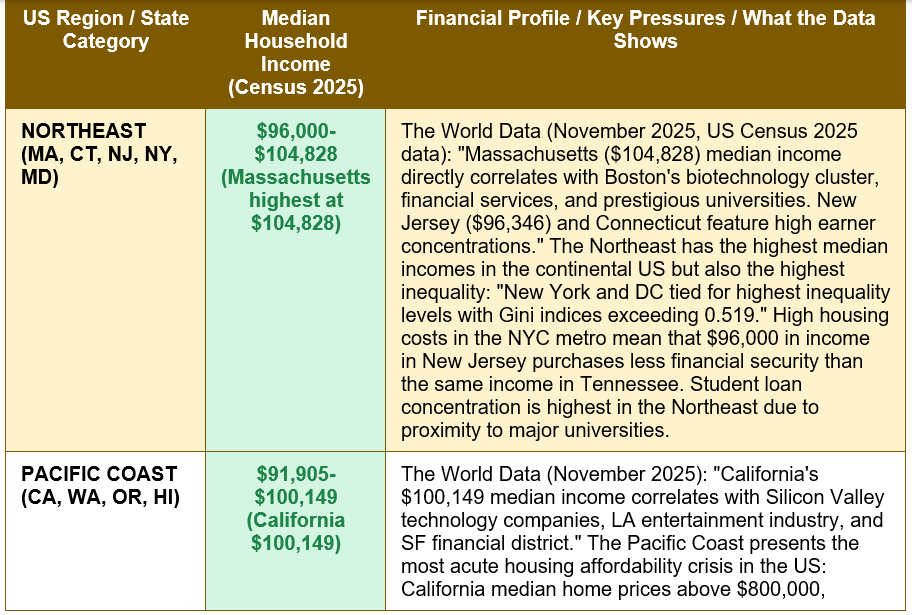
Financial Wellbeing by Demographic: Who Is Falling Behind
The 73% national average conceals the widest demographic dispersion since the SHED series began. The following table maps financial wellbeing by the demographic groups where the Federal Reserve's 2025 data shows the most significant variation: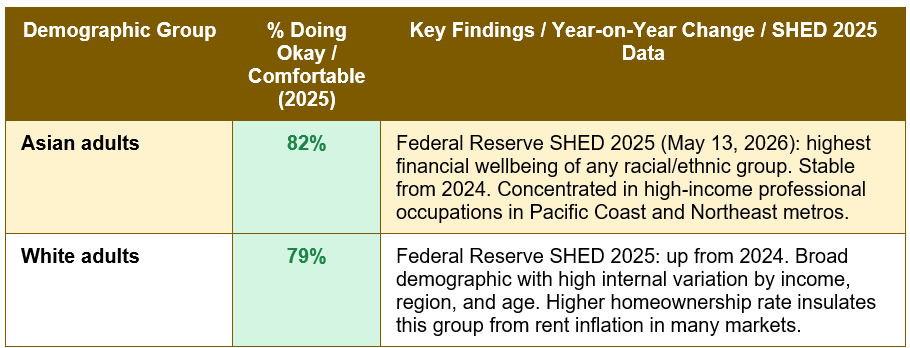
The Five Forces Shaping US Household Finance in 2025-2026
1 PRICE PERSISTENCE -- THE DOMINANT HOUSEHOLD FINANCE FORCE | 91% of adults cite price increases as a concern. The rate is falling; the level is permanent.
Federal Reserve SHED 2025 (May 2026): 'Prices continued to be the most common financial concern among U.S. adults, with the share citing it as either a major or minor concern unchanged at 91 percent.' The slight improvement -- major concern falling from 56% to 53% -- reflects CPI easing from its 2022 peak but should not be mistaken for a resolution. US household budgets have permanently reset to a higher price level across food, housing, energy, and services. Federal Reserve income and expenses data (May 2026): 'A majority of adults said that changes in prices they paid compared with the prior year had made their finances worse, but the share saying so declined compared with 2023 and 2024.' The cumulative effect of three years of above-average inflation on American household balance sheets is embedded in every budget line -- from grocery bills that are 20-25% higher than 2020 levels to mortgage payments that reflect the highest rates in over a decade. US Bank research (2 weeks ago): 'Labor market conditions continue to support consumer spending, although hiring has slowed. Growth slowed late last year as the government shutdown weighed on activity, while consumer spending, hiring and income trends remained broadly supportive.'2 THE LABOUR MARKET SOFTENING -- A RISING ANXIETY | 7% laid off (up from 6%). 42% worried about jobs (up from 37%). Fewer voluntary quits.
Federal Reserve SHED 2025 (May 2026): 'Concerns about finding or keeping a job increased compared with 2024. Forty-two percent of adults said finding or keeping a job was either a minor or major concern, up from 37 percent in 2024. There was a small increase in layoffs, as 7 percent of all adults reported being laid off, up from 6 percent in 2024. The percentage of adults who voluntarily left a job declined slightly to 8 percent.' These are not yet crisis-level labour market statistics -- 7% layoff rate and 42% job concern are elevated but not alarming in historical context. But they represent a clear directional shift from the tight labour market of 2021-2023, and they explain the rising financial anxiety captured in the 42% job-concern figure. The SHED also captured a specific contemporary development: 'One in four workers used generative AI at work in the prior month, and 81 percent of users agreed that it saves them time.' AI adoption at work is the most striking emerging variable in US household finance -- as a potential productivity enhancer for some workers and a potential displacement threat for others. The long-term household finance implications of generative AI are the most consequential uncertain variable in US economic planning for 2026-2030.3 THE SAVINGS ADEQUACY GAP -- UNCHANGED AND INSUFFICIENT | $400 emergency coverage unchanged from 2024. 3-month rainy day fund: unchanged. Both at insufficient levels.
Federal Reserve SHED 2025 (May 2026): 'The share of adults who would pay for an unexpected $400 expense with cash or the equivalent was unchanged from 2024, and the share who said they had rainy day funds to cover three months of expenses was unchanged from 2024 as well.' The stability of these savings metrics is not reassuring. The fact that they are unchanged from 2024 means that the savings adequacy gap has not narrowed despite two years of CPI deceleration and broadly stable labour markets. These two metrics are the Federal Reserve's primary measures of household financial resilience, and both are at levels that financial planners consider insufficient for absorbing even moderate financial shocks. The demographic breakdown of savings adequacy follows the wellbeing distribution exactly: adults age 60+ have dramatically better savings buffers than young adults; high-income households have dramatically better buffers than low-income ones; White and Asian adults have better buffers than Black and Hispanic adults. VisualCapitalist (October 2025): 'Financial assets, such as stocks and ETFs, stood as the largest share of assets, accounting for 43% of the total.' The household net worth improvement captured in the Federal Reserve Z.1 data is real -- but it is concentrated in financial assets and real estate, and is therefore most accessible to households that already have significant wealth.4 THE HOUSING AFFORDABILITY WALL -- COAST TO COAST | Housing concerns persist in SHED 2025. First-time buyers face the worst conditions in decades.
Federal Reserve SHED 2025 (May 2026): housing affordability was a persistent concern across virtually every demographic subgroup and geographic region. The specific data on housing from the 2025 survey reflects the combined impact of elevated mortgage rates (averaging 6.66% for a 30-year fixed as of July 30, 2026, per Freddie Mac) and home prices that remain elevated despite easing from 2022 peaks. The lock-in effect -- the approximately 60-70% of existing mortgage holders who locked in rates below 4% in 2020-2022 -- continues to suppress housing supply by making it financially irrational for owners to sell and buy at current rates. This suppressed supply sustains prices and keeps first-time buyers out of markets they could otherwise afford. VisualCapitalist (October 2025): 'The biggest takeaway: beyond a certain income level, what you earn matters less than how stable and predictable that income is.' Occupations like education, healthcare, and public services -- with more stable and predictable incomes -- achieve homeownership rates above what their pay alone would suggest. Service occupation workers (46% homeownership) lag significantly, reflecting the intersection of income volatility and housing cost barriers in the markets where service workers typically live.5 THE SENTIMENT-REALITY GAP -- THE MOST PUZZLING FEATURE OF 2025 | 25% rate the national economy good/excellent -- half the 2019 share, despite broadly stable finances.
Federal Reserve SHED 2025 (May 2026): 'About one-fourth of adults rated the national economy good or excellent in 2025, down 3 percentage points over the prior year and well below the one-half of adults who did so in 2019, before the pandemic.' This is the most analytically striking finding in the SHED 2025 report: aggregate household finances are broadly stable -- 73% doing okay, net worth up $2.2 trillion, debt service ratio at 11.3% -- yet only 25% rate the national economy positively. This is barely half the pre-pandemic 50%. The sentiment-reality gap is driven by several interlocking factors: the permanent price level reset (consumers experience the price level, not the inflation rate -- prices are still 20%+ above 2020 even at 2.6% inflation); the distributional reality (the aggregate stability conceals the specific declines experienced by Black adults, young adults, and low-income households); political polarisation in economic perception (SHED data consistently shows that perceptions of the national economy track partisan identification closely); and the AI/automation anxiety embedded in the rising job-concern figures. US Bank research (2 weeks ago): 'The resilience of the U.S. consumer is a core driver of economic health at a time of trade uncertainty.' The consumer remains resilient in their spending behaviour while expressing profound pessimism about the economy they are spending in.The inequality architecture of US household finance in 2025. The Federal Reserve SHED 2025 data, read alongside the Census Bureau income-by-state data, reveals the most precise picture of financial inequality in America. At the top: Massachusetts households at $104,828 median income, 82% of Asian adults doing okay or comfortable, adults age 60+ at 84% wellbeing, homeowners with sub-4% mortgages whose net worth increased as their properties appreciated. At the bottom: Mississippi households at $59,127 median income, Black adults at 60% wellbeing and declining, young adults at 63% wellbeing in a softening job market, renters in high-cost metros spending 40-50% of income on housing, and the 27% of Americans who are not doing okay financially and were not captured in the stable headline figure. The World Data (November 2025, Census 2025): 'New York and the District of Columbia tied for the highest inequality levels with Gini indices exceeding 0.519, reflecting enormous income gaps between wealthy finance and government professionals and lower-income service workers.' The Gini coefficient of 0.519 in New York places it among the most unequal jurisdictions in the developed world -- while simultaneously hosting some of the highest median incomes in the country. US household finance is not one picture. It is 50 pictures, layered on top of each other, producing a national average that accurately describes almost no one's individual experience.
FIVE URGENT SIGNALS IN THE 2025-2026 US HOUSEHOLD FINANCE DATA: (1) BLACK ADULTS: 5-POINT DECLINE IN FINANCIAL WELLBEING IN ONE YEAR. Federal Reserve SHED 2025: 60% doing okay -- the lowest of any racial group and declining. If you are in this demographic, the CFPB (consumerfinance.gov), National Urban League financial counselling services, and NFCC (nfcc.org) all provide targeted financial guidance. (2) JOB CONCERN UP FROM 37% TO 42%. The labour market is softening. If your income is not stable: build the emergency fund first. Federal Reserve SHED: the $400 expense and 3-month rainy day metrics are both unchanged -- at insufficient levels. A 3-month emergency fund at current 4.5-5.0% HYSA rates is the single highest-return risk management action available. (3) 91% CITE PRICE INCREASES AS A CONCERN. Prices are not returning to 2020 levels. The cumulative inflation of 20%+ since 2020 is permanent. Household budgets must be rebuilt around the current price level, not the pre-2021 baseline. Review your budget using 2025 prices as the baseline, not 2020 prices as the reference. (4) ONLY 25% RATE THE NATIONAL ECONOMY POSITIVELY. Half the pre-pandemic share. This level of pessimism, when widely shared, affects consumer spending decisions, hiring confidence, and investment -- and can become self-reinforcing. The household-level action: focus on your own balance sheet, not the national one. The 73% who are doing okay are doing so because of their individual financial habits, not because of the national economy rating. (5) HOUSING AFFORDABILITY -- 30-YEAR MORTGAGE AT 6.66% (FREDDIE MAC, JULY 2026). First-time buyers face the most challenging entry conditions in decades. The rent-vs-buy calculation has shifted significantly: in many markets, renting and investing the would-be down payment in a low-cost index fund produces better 5-year financial outcomes than buying at current prices and rates. Use a rent-vs-buy calculator (Bankrate, Redfin, NYT Upshot) with your specific numbers before committing.
YOUR US HOUSEHOLD FINANCE BENCHMARK -- HOW DO YOU COMPARE? INCOME CHECK: Look up your state's median household income at Census.gov. Are you above or below your state median? Above: prioritise savings and investment. Below: focus on income growth strategies and high-priority debt elimination. WELLBEING CHECK: Federal Reserve SHED 2025 reference points -- if you are doing okay or living comfortably, you are in the 73%. If not: identify the single biggest driver. Is it income, debt, housing costs, or a specific expense category? Each has a different primary action. $400 EMERGENCY TEST: Can you cover an unexpected $400 expense today without borrowing or using a credit card? If no: this is the first financial milestone. Open a high-yield savings account (current best rates: 4.5-5.0% APY -- Ally, Marcus, SoFi, Discover) and automate a weekly transfer of $25-50 until you reach $400. 3-MONTH RAINY DAY FUND: Calculate 3 months of essential expenses (housing, food, utilities, transport, minimum debt payments). Do you have that amount in a separate savings account? If no: this is the second financial milestone after the $400 buffer. DEBT-TO-INCOME RATIO: Total your monthly minimum debt payments (mortgage/rent, credit cards, student loans, auto). Divide by monthly gross income. National average: 11.3%. If yours exceeds 20%: high-interest consumer debt (credit cards above 15% APR) is the priority for elimination. FREE RESOURCES: CFPB consumerfinance.gov | NFCC nfcc.org | studentaid.gov | HUD housing counsellors hud.gov.
Conclusion
The Federal Reserve's SHED 2025 report (May 13, 2026) provides the most comprehensive and current picture of US household finances available. At the national level: 73% of adults are doing okay or living comfortably -- consistent with 2024. Household net worth grew by $2.2 trillion in Q4 2025. Debt service payments represent just 11.3% of disposable income, well below historical danger levels. The aggregate picture is one of stability, not crisis.At the demographic and regional margins: Black adults' financial wellbeing fell 5 percentage points in a single year. Young adults report just 63% doing okay -- 21 percentage points below adults age 60 and over. Mississippi's median household income ($59,127) is $45,701 below Massachusetts ($104,828) -- two states in the same country, subject to the same national inflation and the same Federal Reserve monetary policy, but separated by a financial reality gap that is almost as wide as the median income itself. Only 25% of Americans rate the national economy as good or excellent -- half the pre-pandemic share.
US Bank research (2 weeks ago): 'The resilience of the U.S. consumer is a core driver of economic health at a time of trade uncertainty.' The resilience is real, documented in the spending data and the debt service ratio. But it is unevenly distributed. The 27% of Americans who are not doing okay financially are not a rounding error in the national data -- they are 70-80 million people, concentrated among the young, the lower-income, Black households, and the residents of the states where the income map shows the deepest colours. The state of US household finance in 2025 is: stable for most, and declining for the most vulnerable.
Frequently Asked Questions (FAQ)
What percentage of Americans are doing okay financially in 2025?According to the Federal Reserve's Economic Well-Being of U.S. Households in 2025 report (SHED), released May 13, 2026, 73% of US adults reported either 'doing okay' (39%) or 'living comfortably' (34%) financially at the time of the October 2025 survey. This is consistent with the 2024 figure but below the 78% high recorded in 2021. The 73% national average conceals significant demographic and regional variation. By racial/ethnic group: 82% of Asian adults, 79% of White adults, 62% of Hispanic adults, and 60% of Black adults were doing okay or comfortable. Black adults saw the most significant decline -- down 5 percentage points from 2024. By age: 84% of adults age 60 and over reported doing okay or comfortable, versus 63% of adults age 18-29. By income: high-income adults have substantially higher wellbeing rates than low-income adults, with low-income adults experiencing further declines in 2025. The Federal Reserve report notes that 'despite the generally stable financial situation for adults as a whole, financial well-being declined for young adults, low-income families, and Black adults.' The 27% who are not doing okay financially -- approximately 70-80 million adults -- represent the other side of the headline figure: a significant and demographically concentrated population experiencing financial stress even as aggregate metrics remain stable.
Which US state has the highest and lowest median household income?
The gap is significant and structurally persistent. The World Data (November 2025, US Census Bureau Current Population Survey 2025): Massachusetts has the highest median household income of any US state at $104,828, followed closely by New Jersey ($96,346) and Connecticut, reflecting Boston's biotechnology and financial services concentration, New Jersey's proximity to the New York metro area, and Connecticut's financial industry. Maryland ($94,000+) and California ($100,149) are also consistently among the highest. Note that Washington DC, technically a federal district rather than a state, has the highest median household income of any jurisdiction at approximately $107,000+, reflecting the concentration of federal government and government-related professional employment. At the other end: Mississippi ($59,127), West Virginia ($58,447), and Arkansas ($59,063) have the lowest median household incomes of any US states -- approximately $22,000 to $30,000 below the national median. The World Data: 'Southern states dominate the bottom of the income rankings.' These income differences reflect fundamental structural factors: industry composition, educational attainment rates, urbanisation, historical economic development patterns, and proximity to major metropolitan employment centres. The $45,701 gap between Mississippi and Massachusetts means that the same price level -- for housing, food, healthcare, and education -- represents a radically different share of household income depending on which state you live in, even before accounting for state-level cost-of-living differences.
How much does the average American household owe in 2025-2026?
Total US household debt reached $18.8 trillion in Q1 2026, according to the Federal Reserve Bank of New York's Quarterly Household Debt and Credit Report (May 12, 2026). This works out to approximately $144,615 per household across roughly 130 million US households. Motley Fool (May 2026) provides more granular figures: average total debt per household was approximately $105,444 in September 2025 (Experian data). Broken down: mortgage debt averages $269,562 per mortgaged household. Average credit card debt stands at $6,715. Average auto loan balance among borrowers: $24,297. Average student loan debt per borrower: approximately $37,000 (EducationData.org). The positive aggregate context: US Bank research (2 weeks ago): 'U.S. Household debt payments equal roughly 11.3% of disposable income, well below the 2007 peak of 15.8%, which suggests many households retain financial flexibility even as higher borrowing costs pressure some consumers.' The Federal Reserve Z.1 (March 2026): household net worth increased by $2.2 trillion in Q4 2025. Credit card debt at $1.3 trillion is growing at 5-9% annually and charging an average APR of 22.3% (Experian, March 2026) -- the most expensive and fastest-growing consumer debt category. Student loan delinquency rose to 10.3% in Q1 2026 (NY Fed), reflecting the post-pause return to repayment and the most acute specific debt crisis in the current household finance landscape.
Why do only 25% of Americans rate the national economy as good or excellent?
Federal Reserve SHED 2025 (May 2026): 'About one-fourth of adults rated the national economy good or excellent in 2025, down 3 percentage points over the prior year and well below the one-half of adults who did so in 2019, before the pandemic.' This 25% approval rating for the national economy, recorded while 73% of households report doing okay financially, is one of the most analytically interesting features of current US household finance. Several factors drive the disconnect. First, the cumulative price level: consumers experience the absolute price of groceries, gas, rent, and healthcare -- which remain 20%+ above 2020 levels even as CPI has fallen to ~2.6%. This is the price level, not the inflation rate, and it does not improve just because the rate of increase slows. Second, distributional pessimism: the 27% not doing okay financially experience severe distress that disproportionately dominates their perception of economic conditions. Third, partisan perception: research consistently shows that perceptions of the national economy track political identification, producing large swings in approval depending on which party holds the presidency. Fourth, AI and job displacement anxiety: the 42% job concern figure (up from 37%) includes a growing component of workers who fear that their roles will be affected by AI and automation -- a concern that does not resolve with lower inflation or higher aggregate net worth. The Federal Reserve SHED: 'One in four workers used generative AI at work in the prior month.' The scale of AI adoption in the workplace is visible and accelerating, making the anxiety it generates genuinely rational even if the aggregate employment data remains stable.
What is the Federal Reserve SHED report and why does it matter for household finances?
The Survey of Household Economics and Decisionmaking (SHED) is the Federal Reserve Board's primary tool for measuring the economic well-being of US households at the individual and household level -- as distinct from the aggregate macroeconomic data published in the Z.1 Financial Accounts or the Consumer Price Index. Federal Reserve Board: 'Since 2013, the Federal Reserve Board has conducted the Survey of Household Economics and Decisionmaking, which measures the economic well-being of U.S. households and identifies potential risks to their finances. The survey includes modules on a range of topics of current relevance to financial well-being including credit access and behaviors, savings, retirement, economic fragility, and education and student loans.' The 2025 edition surveyed nearly 13,000 adults in October 2025 and was released May 13, 2026. Why it matters: the SHED captures what aggregate data misses. GDP growth, aggregate net worth, and headline inflation figures describe the average across all households -- but SHED reveals the distribution: which households are thriving, which are struggling, which specific demographics are improving or declining, and which specific financial vulnerabilities (the $400 emergency expense, the 3-month rainy day fund, housing affordability, student loan stress) are most acute. For policy makers, the SHED is the primary source for identifying where household financial stress is concentrated and where interventions would have the greatest impact. For individuals, it provides benchmark data -- allowing any household to compare their own financial situation to nationally representative figures and identify where they stand relative to their peers. The SHED is freely available at federalreserve.gov/consumerscommunities/shed.htm.

0 Comments Comments