

Investing
The Wealth-Building Secret Most Investors Learn Way Too Late

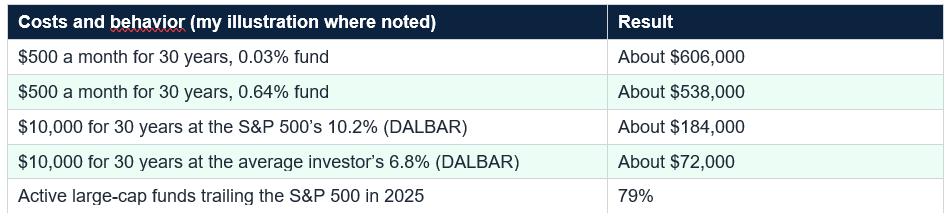
Over 20 years through 2024 the S&P 500 returned about 10.6% a year fully invested, 6.4% missing the 10 best days and 3.7% missing the 20 best (JPMorgan); seven of the 10 best days came within two weeks of one of the 10 worst; $10,000 became about $75,000 fully invested vs about $34,400 missing the 10 best days (my arithmetic). The behavior and cost gap: average investor 6.8% vs 10.2% for the S&P 500 over 30 years (DALBAR), $10,000 becoming about $72,000 vs $184,000; 79% of active large-cap funds trailed the S&P 500 in 2025; 0.64% fees vs 0.03% cost about $68,000 over 30 years at $500 a month. My arithmetic ($500 a month, 7%): $86,500 after 10 years, $260,500 after 20, $610,000 after 30 and $1.31 million after 40; growth is 31% of the balance at 10 years and 82% at 40; a 10-year delay costs about $702,000, and catching up from 35 takes about $1,076 a month.
The secret is not an investment. It is the shape of compounding and what it takes to stay on it. This guide explains why growth arrives late, what waiting costs, what happens to people who step out of the market and why costs and behavior quietly decide so many outcomes, using 2026 data where I can and flagging where an argument is one-sided, as some famous charts are.
Each decade adds more: about $86,500 in the first ten years, $173,900 in years 11 to 20, $349,500 in years 21 to 30 and $702,400 in years 31 to 40, more than the entire balance that existed after 30 years. The same monthly deposit does very different work depending on when it happens, which is why the final decade is where wealth is made.
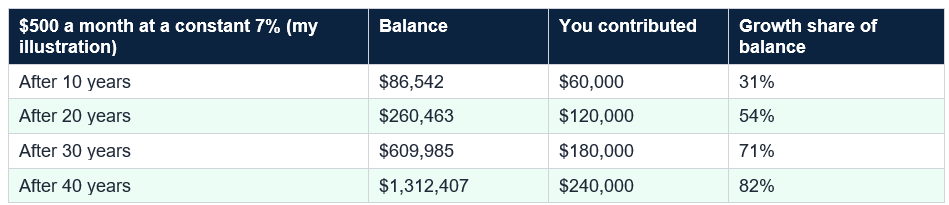
$500 a month at 7%: $86,542 after 10 years, $260,463 after 20, $609,985 after 30, $1,312,407 after 40. Years 31–40 add about $702,400; years 1–10 add about $86,500. Growth is 82% of the 40-year balance.
Catching up is expensive. To reach the same $1.31 million starting at 35, you would need about $1,076 a month, more than double; starting at 45, about $2,519, more than five times as much. These are constant-7% assumptions, not forecasts, but the lesson holds under any reasonable return: the early dollars are the most valuable you will ever invest. Vanguard’s 2026 data, from my earlier research, show median balances of only about $2,234 for savers under 25 and $18,732 for ages 25 to 34, exactly when time is most valuable.

Why do people miss them? Because the best days come right after the worst. Seven of the 10 best days over 20 years fell within two weeks of one of the 10 worst, and March 2020 alone had several of both, so someone who sells in a panic is usually out on the way back up. Masterworks puts the 30-year version, through June 2025, at 8.45% fully invested versus 5.56% missing the 10 best and 3.66% missing the 20 best.

The famous chart is one-sided. It shows the cost of missing the best days without showing the benefit of dodging the worst ones, and analyses that do both show avoiding the worst days would help even more. The catch is that nobody can reliably identify either in advance, and because they cluster, exits usually miss both.
Another reason we learn late is waiting for certainty: until we understand more, until a crash passes, until the news looks better. It rarely does. With the S&P 500 up about 11.4% this year, inflation at 3.7% and the Fed deciding between holding and hiking, there is always a reason to wait, and the cost of waiting, as the table above shows, is measured in hundreds of thousands of dollars.
Concentration matters too. Hendrik Bessembinder found that the best 4.3% of stocks created all the market’s net wealth, a strong argument for owning the whole market rather than hunting for the few winners. People who learn this late have often paid years of high fees; people who learn it early buy a broad, cheap fund, automate and get on with their lives.
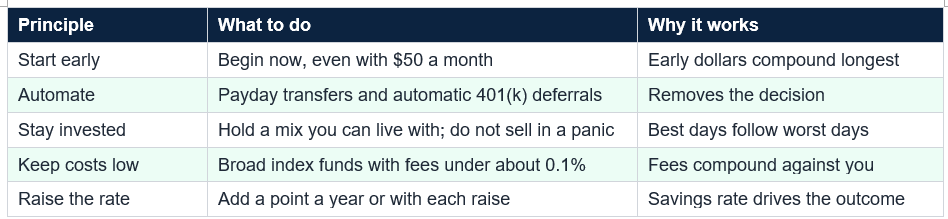
Automation is the quiet enabler: Vanguard found that automatic enrollment lifts retirement-plan participation to 94% from 64%. When saving happens before you see the money, you do not decide again each month and are less likely to stop when markets get scary. The 401(k) millionaires are people who started, kept going and let time do the heavy lifting.
Fifth, protect the plan from your own emotions. Keep an emergency fund so you never have to sell stocks to pay a bill (Bankrate found only 46% of Americans could cover three months of expenses), use tax-advantaged accounts first, a 401(k) with a 2026 limit of $24,500 and a Roth IRA with a limit of $7,500, and look at your account less often: review quarterly, rebalance yearly and ignore the headlines in between.
Catch-up contributions are available to older savers in many plans (check current limits), delaying Social Security can raise benefits and a planner can run your actual numbers, which my constant-7% illustrations cannot. The key step is the same as 20 years ago: begin, automate and stay the course. The best time to start was years ago. The second best is today.
Your move: This week, set up one automatic contribution, even $50, into a low-cost broad fund. Then write down the one thing you will not do when markets fall: sell. Put the rule where you will see it.
None of this requires brilliance, only starting, automating, keeping costs low and staying put through the scary days. If you are early, you have the biggest asset there is; if you are late, you have the same tools, used harder. The secret is easier to read in a chart than to follow in a crash. A qualified adviser can help you apply it.
That time and consistency matter more than picking the right investment. Compounding is back-loaded, so most of the growth arrives in the final years, and anyone who starts late or interrupts the process gives up the part that matters most. In my illustration, $500 a month at 7% grows to about $86,500 in 10 years but about $1.31 million in 40, with years 31 to 40 adding about $702,000.
How much does missing the market’s best days cost?
A lot, according to JPMorgan Asset Management. Over the 20 years through 2024, staying fully invested in the S&P 500 returned about 10.6% a year, while missing the 10 best days cut that to about 6.4% and missing the 20 best days to about 3.7%. Seven of the 10 best days came within two weeks of one of the 10 worst, so investors who sell in a panic often miss the rebound.
Is it too late to start investing at 35 or 45?
It is later, not too late. In my illustration, starting $500 a month at 35 instead of 25 leaves about $610,000 at 65 instead of about $1.31 million, and starting at 45 leaves about $260,000. Catching up from 35 would take about $1,076 a month, and from 45 about $2,519 a month, at a constant 7%. The best response is to start now and raise your savings rate.
Can I avoid the worst days and keep the best?
In theory, yes; in practice, almost nobody does it reliably. The best and worst days cluster together, often in the same crises, so exiting after a drop usually means missing the rebound. Some analyses note that avoiding only the worst days would help even more than missing the best days hurts, but that requires predicting them. Most people do better with a plan and automatic contributions.
What else do investors learn too late?
That costs and behavior compound too. DALBAR research found the average investor earned about 6.8% a year over 30 years against 10.2% for the S&P 500, and a 0.64% fund costs about $68,000 more over 30 years than a 0.03% fund in my $500-a-month illustration. S&P Dow Jones Indices found 79% of active large-cap funds trailed the S&P 500 in 2025. This is general education, not personal advice.
Table of Contents
- The Lesson That Comes Late
- The Short Answer
- Secret One: Compounding Is Back-Loaded
- Secret Two: Waiting Has a Price
- Secret Three: The Best Days Hide Inside the Worst
- Why We Learn It Late: Behavior
- Secret Four: Costs Compound Too
- What the 401(k) Millionaires Did
- Putting the Secret to Work Today
- If You Are Starting Late
- Common Mistakes
- Conclusion
- Frequently Asked Questions
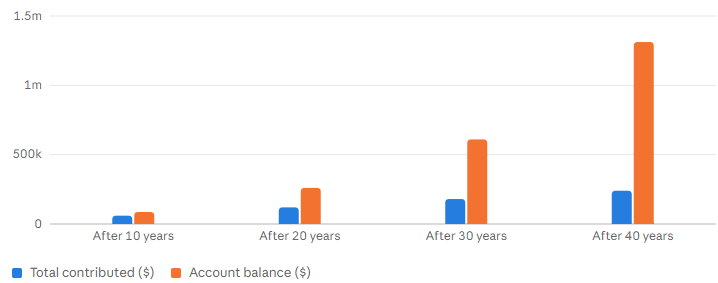
Compounding is back-loaded: $500 a month at 7% (contributions vs. balance, $)
Dollars by Author's illustration: constant 7%, end-of-month contributions, no taxes or fees; growth is 31% of the balance at 10 years and 82% at 40
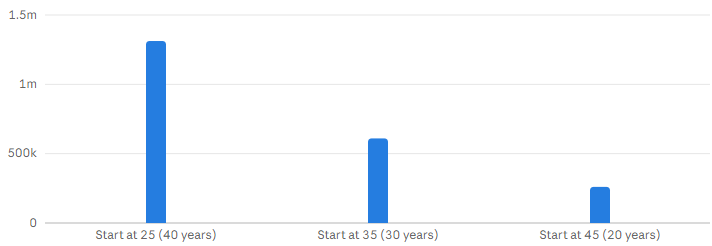
The price of waiting: $500 a month starting at 25, 35 or 45 ($ at age 65)
Balance at 65 ($) by Author's illustration at a constant 7%; matching the age-25 result from 35 takes about $1,076 a month; from 45, about $2,519
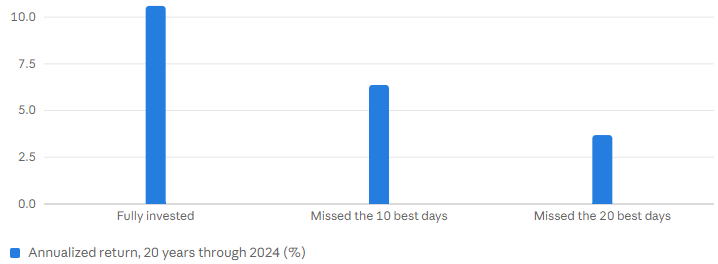
The cost of missing the best days: S&P 500 annualized return over 20 years (%)
Annualized return (%) by J.P. Morgan Asset Management via J.P. Morgan Private Bank; $10,000 becomes about $75,000, $34,400 and $20,600 (my arithmetic)
The Lesson That Comes Late
Ask people who have built real wealth what they would tell their younger selves and the answers tend to rhyme. They do not say pick better stocks or find a secret strategy. They say start earlier, put in more, leave it alone and stop overpaying for things that do not help. It is almost embarrassingly simple, which is probably why so many of us learn it only after the best years have passed.The secret is not an investment. It is the shape of compounding and what it takes to stay on it. This guide explains why growth arrives late, what waiting costs, what happens to people who step out of the market and why costs and behavior quietly decide so many outcomes, using 2026 data where I can and flagging where an argument is one-sided, as some famous charts are.
The Short Answer
The secret most investors learn too late is that time and consistency beat cleverness. Compounding is back-loaded, so starting late or interrupting the process costs far more than people expect. Staying invested matters too: over 20 years, missing just the 10 best days of the S&P 500 cut the annualized return from about 10.6% to about 6.4%. Add the damage from fees and emotional trading, and the lesson is clear: start early, automate, keep costs low and stay put.Secret One: Compounding Is Back-Loaded
Most people imagine growth as a steady slope; it is closer to a hockey stick. In my illustration, $500 a month at a constant 7% grows to about $86,500 after 10 years, $260,500 after 20, $610,000 after 30 and $1.31 million after 40. You contribute $240,000 over those 40 years, so about $1.07 million, or 82% of the final balance, is growth; after 10 years it is only 31%.Each decade adds more: about $86,500 in the first ten years, $173,900 in years 11 to 20, $349,500 in years 21 to 30 and $702,400 in years 31 to 40, more than the entire balance that existed after 30 years. The same monthly deposit does very different work depending on when it happens, which is why the final decade is where wealth is made.
$500 a month at 7%: $86,542 after 10 years, $260,463 after 20, $609,985 after 30, $1,312,407 after 40. Years 31–40 add about $702,400; years 1–10 add about $86,500. Growth is 82% of the 40-year balance.
Secret Two: Waiting Has a Price
Because growth is back-loaded, a delay removes the most productive years. In my illustration, starting $500 a month at 25 and continuing to 65 ends with about $1.31 million; starting at 35 ends with about $610,000, and at 45, about $260,000. A ten-year delay costs about $702,000, and a twenty-year delay about $1.05 million, even though the monthly deposits are identical.Catching up is expensive. To reach the same $1.31 million starting at 35, you would need about $1,076 a month, more than double; starting at 45, about $2,519, more than five times as much. These are constant-7% assumptions, not forecasts, but the lesson holds under any reasonable return: the early dollars are the most valuable you will ever invest. Vanguard’s 2026 data, from my earlier research, show median balances of only about $2,234 for savers under 25 and $18,732 for ages 25 to 34, exactly when time is most valuable.
Secret Three: The Best Days Hide Inside the Worst
The second half of the secret is staying invested. JPMorgan Asset Management’s widely cited analysis found that over the 20 years through 2024, an investor fully invested in the S&P 500 earned about 10.6% a year; missing just the 10 best days cut that to about 6.4%, and missing the 20 best to about 3.7%. On $10,000, that is about $75,000 versus $34,400 versus $20,600, by my arithmetic. A Motley Fool analysis from October 17 found similar results through October 2026: about 11% a year fully invested, under 7% without the 10 best days, and about $9,900 after missing the 40 best, less than the starting amount.Why do people miss them? Because the best days come right after the worst. Seven of the 10 best days over 20 years fell within two weeks of one of the 10 worst, and March 2020 alone had several of both, so someone who sells in a panic is usually out on the way back up. Masterworks puts the 30-year version, through June 2025, at 8.45% fully invested versus 5.56% missing the 10 best and 3.66% missing the 20 best.
The famous chart is one-sided. It shows the cost of missing the best days without showing the benefit of dodging the worst ones, and analyses that do both show avoiding the worst days would help even more. The catch is that nobody can reliably identify either in advance, and because they cluster, exits usually miss both.
Why We Learn It Late: Behavior
If staying invested is so valuable, why does anyone leave? Because losses hurt more than gains feel good, and fear peaks exactly when prices are lowest. DALBAR research, summarized by MyETFJourney, found that over 30 years the average investor earned about 6.8% a year while the S&P 500 returned about 10.2%. On $10,000, that is about $72,000 versus about $184,000, a difference of more than $110,000 caused not by bad investments but by the timing of buying and selling.Another reason we learn late is waiting for certainty: until we understand more, until a crash passes, until the news looks better. It rarely does. With the S&P 500 up about 11.4% this year, inflation at 3.7% and the Fed deciding between holding and hiking, there is always a reason to wait, and the cost of waiting, as the table above shows, is measured in hundreds of thousands of dollars.
Secret Four: Costs Compound Too
The same math that grows your savings also grows what you pay. In my illustration, $500 a month for 30 years at 7% before fees grows to about $606,000 in a fund charging 0.03% and about $538,000 in one charging 0.64%, a gap of roughly $68,000. Top S&P 500 index funds charge 0.015% to 0.04%, according to Bankrate. And performance does not make up for it: S&P Dow Jones Indices found 79% of active large-cap funds trailed the S&P 500 in 2025.Concentration matters too. Hendrik Bessembinder found that the best 4.3% of stocks created all the market’s net wealth, a strong argument for owning the whole market rather than hunting for the few winners. People who learn this late have often paid years of high fees; people who learn it early buy a broad, cheap fund, automate and get on with their lives.
What the 401(k) Millionaires Did
Fidelity reported a record 654,000 401(k) millionaires in the second quarter of 2026. What set them apart was habit, not exotic investing: they saved about 17.3% of pay, or 25.8% including employer contributions, against a 14.4% average, and stayed invested through market swings. Put in more, and leave it alone.Automation is the quiet enabler: Vanguard found that automatic enrollment lifts retirement-plan participation to 94% from 64%. When saving happens before you see the money, you do not decide again each month and are less likely to stop when markets get scary. The 401(k) millionaires are people who started, kept going and let time do the heavy lifting.
Putting the Secret to Work Today
First, start now, even small: $50 a month beats a $500-a-month plan that begins in five years. Second, automate contributions on payday. Third, pick a broad, low-cost fund and a stock-and-bond mix you can hold through a 30% drop, because an allocation you abandon is worse than a modest one you keep. Fourth, raise your contribution by a point each year or with each raise.Fifth, protect the plan from your own emotions. Keep an emergency fund so you never have to sell stocks to pay a bill (Bankrate found only 46% of Americans could cover three months of expenses), use tax-advantaged accounts first, a 401(k) with a 2026 limit of $24,500 and a Roth IRA with a limit of $7,500, and look at your account less often: review quarterly, rebalance yearly and ignore the headlines in between.
If You Are Starting Late
If you are reading this at 40 or 50 with little saved, take a deep breath. The math is harsher but not hopeless. The levers are the savings rate, the time horizon and cost. Raise your savings rate as high as you can, since doubling or tripling contributions can recover much of the gap; consider working a few years longer, which adds contributions and shortens the period you must fund; keep costs low; and resist big risks to make up for lost time.Catch-up contributions are available to older savers in many plans (check current limits), delaying Social Security can raise benefits and a planner can run your actual numbers, which my constant-7% illustrations cannot. The key step is the same as 20 years ago: begin, automate and stay the course. The best time to start was years ago. The second best is today.
Common Mistakes
Common mistakes include waiting for the right moment, selling after a drop, chasing last year’s winners, paying high fees for active management that usually trails the index, checking balances daily and funding retirement only when money is left over. Another is treating returns as guaranteed: the 7% in my illustrations is an assumption, and markets can fall 30% or more. The point of the secret is not that markets always rise but that those who stay in the game, with low costs and steady contributions, historically get the benefit of the best days.Your move: This week, set up one automatic contribution, even $50, into a low-cost broad fund. Then write down the one thing you will not do when markets fall: sell. Put the rule where you will see it.
Conclusion
The wealth-building secret most investors learn too late is that time does the heavy lifting. Compounding is back-loaded: in my illustration, $500 a month grows to about $86,500 in 10 years and about $1.31 million in 40, with the final decade adding about $702,000. Waiting ten years costs about the same amount. Leaving the market is costly too, since missing just the 10 best days over 20 years cut JPMorgan’s annualized return from about 10.6% to about 6.4%. And costs and behavior quietly add or subtract tens of thousands of dollars.None of this requires brilliance, only starting, automating, keeping costs low and staying put through the scary days. If you are early, you have the biggest asset there is; if you are late, you have the same tools, used harder. The secret is easier to read in a chart than to follow in a crash. A qualified adviser can help you apply it.
Frequently Asked Questions
What is the wealth-building secret most investors learn too late?That time and consistency matter more than picking the right investment. Compounding is back-loaded, so most of the growth arrives in the final years, and anyone who starts late or interrupts the process gives up the part that matters most. In my illustration, $500 a month at 7% grows to about $86,500 in 10 years but about $1.31 million in 40, with years 31 to 40 adding about $702,000.
How much does missing the market’s best days cost?
A lot, according to JPMorgan Asset Management. Over the 20 years through 2024, staying fully invested in the S&P 500 returned about 10.6% a year, while missing the 10 best days cut that to about 6.4% and missing the 20 best days to about 3.7%. Seven of the 10 best days came within two weeks of one of the 10 worst, so investors who sell in a panic often miss the rebound.
Is it too late to start investing at 35 or 45?
It is later, not too late. In my illustration, starting $500 a month at 35 instead of 25 leaves about $610,000 at 65 instead of about $1.31 million, and starting at 45 leaves about $260,000. Catching up from 35 would take about $1,076 a month, and from 45 about $2,519 a month, at a constant 7%. The best response is to start now and raise your savings rate.
Can I avoid the worst days and keep the best?
In theory, yes; in practice, almost nobody does it reliably. The best and worst days cluster together, often in the same crises, so exiting after a drop usually means missing the rebound. Some analyses note that avoiding only the worst days would help even more than missing the best days hurts, but that requires predicting them. Most people do better with a plan and automatic contributions.
What else do investors learn too late?
That costs and behavior compound too. DALBAR research found the average investor earned about 6.8% a year over 30 years against 10.2% for the S&P 500, and a 0.64% fund costs about $68,000 more over 30 years than a 0.03% fund in my $500-a-month illustration. S&P Dow Jones Indices found 79% of active large-cap funds trailed the S&P 500 in 2025. This is general education, not personal advice.
0 Comments
Be the first to share your thoughts on this article.