
Investing
Types of Stocks: A Plain-English Guide for Beginner Investors

2026 returns through October 2: S&P SmallCap 600 +16.30%, S&P 500 +13.79%, S&P MidCap 400 +12.08%. Expected 2026 earnings growth: S&P 500 32.0%, MidCap 26.9%, SmallCap 24.2% (First Trust). S&P 500 sector weights (June 30, 2026): technology 38.0%, financials 11.8%, communication services 9.7%, consumer discretionary 9.3%, industrials 8.9%, health care 8.9%, staples 4.6%, energy 3.0%, utilities 2.2%, real estate 1.8%, materials 1.8% (Schwab). Twelve-month sector returns to July 24, 2026: energy +41.7%, technology +27.2%, health care +21.3%, consumer discretionary −1.7%; S&P 500 +17.4% (Schwab). Small-cap growth vs value: Q2 2026 growth +25.7% vs value +17.2%; five-year (to March 31) value +5.8% vs growth +1.6% annualized (Royce). Dividends: S&P 500 yield about 1.0% (Fidelity); 52-week T-bill 4.46%; a dividend-focused ETF (DIVB) yielded 2.87%. Best 4.3% of US stocks created all net wealth since 1926; 58% failed to beat Treasury bills.
This is a particularly good year to learn them, because the types have not moved together. Through October 2, small-company stocks beat large ones, energy stocks beat almost everything over the past twelve months, and technology now makes up about 38% of the S&P 500. Here is a plain-English guide, with the 2026 numbers that show how each type has behaved.
For most beginners, common stock is the main event, and the rest of this guide is about its flavors. Preferred shares are a more specialized choice, worth understanding if you want steady income but different from owning a piece of a growing business.
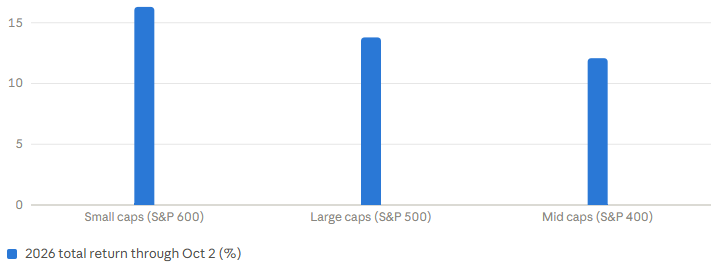
In 2026 the order has been surprising. Through October 2, the S&P SmallCap 600 returned 16.30%, the S&P 500 returned 13.79% and the S&P MidCap 400 returned 12.08%, according to First Trust. Small caps beat large and mid caps in eight of eleven sectors, and expected earnings growth for 2026 jumped for all three groups, to 32.0% for the S&P 500, 26.9% for mid caps and 24.2% for small caps. Royce reported that the Russell 2000 gained 22.6% in the first half versus 10.3% for the Russell 1000, and that small-cap valuations relative to large caps were still near their lowest in 25 years at the end of June.
The numbers: 2026 through October 2: S&P SmallCap 600 +16.30%; S&P 500 +13.79%; S&P MidCap 400 +12.08%. Small caps beat large caps in 8 of 11 sectors (First Trust). Leadership rotates, so this is a snapshot, not a trend.
Royce’s data shows how the leadership flips. In the second quarter of 2026, the Russell 2000 Growth Index gained 25.7% versus 17.2% for the value index, helped by exposure to artificial intelligence. Yet small-cap value led for the year to date at 23.0% versus 22.2%, and over five years to March 31 it returned 5.8% a year against 1.6% for growth. Growth edged ahead over ten years, 9.8% versus 9.6%. If you can only remember one thing, it is that style leadership changes, and nobody reliably knows when.
Yields vary by sector. Dividend.com’s August survey of dividend-paying stocks found financials at 5.74%, real estate at 5.39%, energy at 4.23% and utilities at 3.56%, versus 1.59% for technology. Those figures cover a broader set of dividend payers than the index, including some funds with high mandated payouts, so they will not match the index yield. For a diversified example, the iShares Core Dividend ETF yielded 2.87% in September. And remember that dividends are not guaranteed. Dividend.com noted that Telus cut its dividend by 55.2%. A high yield can be a warning, not a gift.
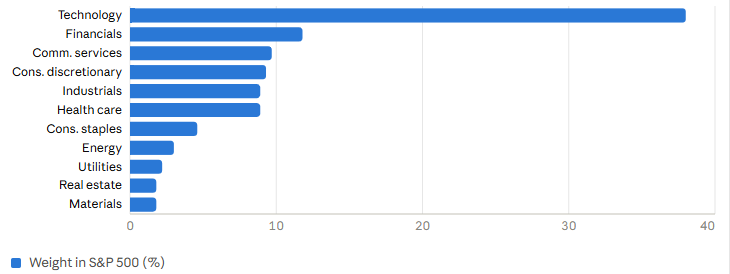
Performance has been uneven. In the twelve months to July 24, energy gained 41.7%, technology 27.2% and health care 21.3%, versus 17.4% for the whole index, while consumer discretionary fell 1.7%. Notice how much a single sector now matters. When technology is 38% of an index, the index behaves a lot like a technology fund.
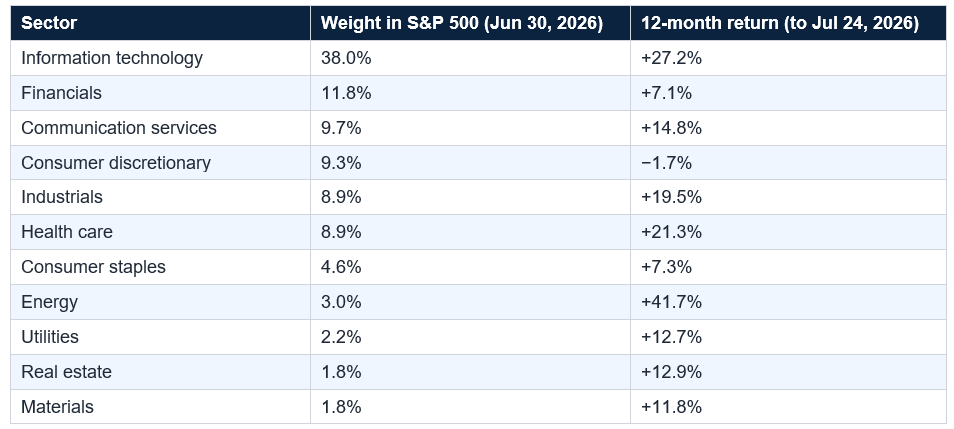
The labels are not perfect, and 2026 shows it: energy, a classic cyclical, led the year, while staples gained just 7.3% over twelve months. Still, thinking in these terms helps you see whether your portfolio leans toward growth in good times or protection in bad ones.
Here, the research on individual stocks is a useful reality check. Hendrik Bessembinder found that the best-performing 4.3% of US stocks created all of the market’s net wealth since 1926, and that 58% failed to beat Treasury bills over their lifetimes. A label such as "blue chip" or "growth" does not tell you which group a stock will land in.
Keep in mind: Labels describe a stock today, not its future. A blue chip can stumble, a penny stock can soar and a value stock can stay cheap for years. Use types to understand and diversify, not to predict.
Two cautions. First, concentration: a fund tracking the S&P 500 is about 38% technology and 39% in ten stocks, so if you add a technology fund on top, you are doubling down. Second, chasing last year’s winner. This year’s small-cap leadership and energy surge may reverse. A plan that holds several types and rebalances occasionally protects you from guessing which one is next.
The best habit is to hold several types rather than bet on one, keep your core broad and low cost, and treat the latest winner with suspicion. Labels help you understand, but they do not predict. Start by looking at what you already own, and see which types you have too much or too little of. This is general education, not personalized advice, and a qualified adviser can help you apply it.
Investors usually sort stocks several ways at once: by ownership class (common or preferred), by company size (large, mid, small, micro), by style (growth, value, blend), by income (dividend payers), by sector (such as technology or energy), by behavior (cyclical or defensive) and by quality or risk (blue chip, speculative, penny). One stock can fit several categories.
What is the difference between growth and value stocks?
Growth stocks are priced for fast expected earnings growth, often with low or no dividends. Value stocks trade at lower prices relative to earnings or assets, often because growth is slower or sentiment is poor. Leadership rotates: in the second quarter of 2026, small-cap growth rose 25.7% versus 17.2% for small-cap value, yet value led over some longer periods.
Are dividend stocks safer than other stocks?
Not necessarily. Dividends can be cut, as Telus did with a 55.2% reduction, according to Dividend.com. The S&P 500’s overall yield is only about 1.0%, while a 52-week Treasury bill paid about 4.46% in October, so the yield alone is not a reason to choose a stock.
Which type of stock is best for beginners?
Most beginners do best owning many types at once through a broad index fund, rather than picking one. Research by Hendrik Bessembinder found that 58% of US stocks failed to beat Treasury bills over their lifetimes and that the best 4.3% created all net market wealth, which is why diversification matters.
Do small-cap stocks beat large-cap stocks?
Not always. In 2026 through October 2, the S&P SmallCap 600 returned 16.30% versus 13.79% for the S&P 500, but small caps trailed large caps in 2025 and often swing more. Results rotate over time, so many investors hold both.
2026 year-to-date returns by company size (through Oct 2, %)
Total return (%) by Index (First Trust)
S&P 500 sector weights, June 30, 2026 (%)
% of index by Sector (Schwab / S&P Dow Jones Indices)
Table of Contents
- Why Stocks Come in Types
- Common and Preferred Stock
- By Size: Large, Mid, Small and Micro
- By Style: Growth, Value and Blend
- By Income: Dividend Stocks
- By Sector: The 11 Slices of the Market
- By Behavior: Cyclical and Defensive
- By Region: Domestic, International and Emerging
- By Quality and Risk: Blue Chip, Penny and IPO Stocks
- How the Types Overlap
- Putting It Together: Building a Mix
- Conclusion
- Frequently Asked Questions
Why Stocks Come in Types
Walk into any conversation about investing and you will hear a lot of labels: growth, value, small cap, blue chip, defensive, dividend. They sound like jargon, but each one answers a practical question. How big is the company? How is it priced? Does it pay you cash? What does it do for a living? How does it behave when the economy wobbles? Knowing the types helps you understand what you own, and just as importantly, what you might be missing.This is a particularly good year to learn them, because the types have not moved together. Through October 2, small-company stocks beat large ones, energy stocks beat almost everything over the past twelve months, and technology now makes up about 38% of the S&P 500. Here is a plain-English guide, with the 2026 numbers that show how each type has behaved.
Common and Preferred Stock
The most basic split is by the kind of ownership. Common stock is what almost everyone means by "stock." It gives you a slice of the company, usually a vote on major issues and a share of any growth or dividends the company chooses to pay. Preferred stock is a hybrid. It typically pays a fixed dividend, usually carries no voting rights, and ranks ahead of common stock if the company runs into trouble. It behaves partly like a bond.For most beginners, common stock is the main event, and the rest of this guide is about its flavors. Preferred shares are a more specialized choice, worth understanding if you want steady income but different from owning a piece of a growing business.
By Size: Large, Mid, Small and Micro
Company size is measured by market capitalization, the share price multiplied by the number of shares. Conventions vary, but roughly, large caps are worth more than about $10 billion, mid caps about $2 billion to $10 billion, small caps a few hundred million to $2 billion, and micro caps less than that. Large caps tend to be established and steadier. Smaller companies can grow faster but are usually more volatile and more sensitive to the economy.In 2026 the order has been surprising. Through October 2, the S&P SmallCap 600 returned 16.30%, the S&P 500 returned 13.79% and the S&P MidCap 400 returned 12.08%, according to First Trust. Small caps beat large and mid caps in eight of eleven sectors, and expected earnings growth for 2026 jumped for all three groups, to 32.0% for the S&P 500, 26.9% for mid caps and 24.2% for small caps. Royce reported that the Russell 2000 gained 22.6% in the first half versus 10.3% for the Russell 1000, and that small-cap valuations relative to large caps were still near their lowest in 25 years at the end of June.
The numbers: 2026 through October 2: S&P SmallCap 600 +16.30%; S&P 500 +13.79%; S&P MidCap 400 +12.08%. Small caps beat large caps in 8 of 11 sectors (First Trust). Leadership rotates, so this is a snapshot, not a trend.
By Style: Growth, Value and Blend
Style describes how a stock is priced relative to what it earns or owns. Growth stocks are companies expected to grow earnings quickly, so investors pay a premium for them, and they often pay little or no dividend. Value stocks trade at lower prices relative to earnings or assets, perhaps because growth is slower or the market is doubtful. Blend funds hold a mix of both. Neither style is better in every era.Royce’s data shows how the leadership flips. In the second quarter of 2026, the Russell 2000 Growth Index gained 25.7% versus 17.2% for the value index, helped by exposure to artificial intelligence. Yet small-cap value led for the year to date at 23.0% versus 22.2%, and over five years to March 31 it returned 5.8% a year against 1.6% for growth. Growth edged ahead over ten years, 9.8% versus 9.6%. If you can only remember one thing, it is that style leadership changes, and nobody reliably knows when.
By Income: Dividend Stocks
Dividend stocks pay a regular cash share of profits. They appeal to people who want income and often come from mature businesses. But watch the numbers. According to Fidelity’s third-quarter 2026 update, the S&P 500’s overall dividend yield is only about 1.0%, because the biggest weight belongs to technology, which yields about 0.4%. Meanwhile, a 52-week Treasury bill paid about 4.46% in October. A stock that yields 2% is competing with cash that pays more than double.Yields vary by sector. Dividend.com’s August survey of dividend-paying stocks found financials at 5.74%, real estate at 5.39%, energy at 4.23% and utilities at 3.56%, versus 1.59% for technology. Those figures cover a broader set of dividend payers than the index, including some funds with high mandated payouts, so they will not match the index yield. For a diversified example, the iShares Core Dividend ETF yielded 2.87% in September. And remember that dividends are not guaranteed. Dividend.com noted that Telus cut its dividend by 55.2%. A high yield can be a warning, not a gift.
By Sector: The 11 Slices of the Market
Sector is the industry a company works in. The standard system has eleven: technology, financials, communication services, consumer discretionary, industrials, health care, consumer staples, energy, utilities, real estate and materials. Weights matter, because an index fund buys sectors in proportion to their size. As of June 30, 2026, technology was 38.0% of the S&P 500, financials 11.8%, communication services 9.7% and consumer discretionary 9.3%, according to Schwab. Energy, utilities, real estate and materials together were under 9%.Performance has been uneven. In the twelve months to July 24, energy gained 41.7%, technology 27.2% and health care 21.3%, versus 17.4% for the whole index, while consumer discretionary fell 1.7%. Notice how much a single sector now matters. When technology is 38% of an index, the index behaves a lot like a technology fund.
By Behavior: Cyclical and Defensive
Another useful split is how stocks react to the economy. Cyclical stocks, such as industrials, consumer discretionary and energy, tend to do well when the economy is expanding and struggle in downturns, because people buy cars, vacations and machinery when times are good. Defensive stocks, such as consumer staples, utilities and health care, sell things people need regardless, so their earnings tend to be steadier. They often hold up better in a slump and lag in a boom.The labels are not perfect, and 2026 shows it: energy, a classic cyclical, led the year, while staples gained just 7.3% over twelve months. Still, thinking in these terms helps you see whether your portfolio leans toward growth in good times or protection in bad ones.
By Region: Domestic, International and Emerging
Stocks can also be sorted by where the company is based. Domestic stocks are US companies. International developed-market stocks cover places such as Europe and Japan, and emerging-market stocks cover faster-growing but riskier economies. Holding all three spreads your bets across different economies, currencies and valuations. The mix matters because the US market is heavily concentrated: the top 10 stocks make up about 39.1% of the S&P 500, according to figures cited by KuCoin, so adding other regions can reduce your reliance on a few American giants.By Quality and Risk: Blue Chip, Penny and IPO Stocks
Finally, there are labels about quality and risk. Blue-chip stocks are large, well-established companies with long records, such as household-name leaders in their industries. They are generally steadier, though not immune to losses. At the other extreme, penny stocks generally trade below $5 a share, often on thinly traded markets with little public information, which makes them easy to manipulate and risky. Newly listed IPO stocks have short histories and can swing wildly as the market works out what they are worth.Here, the research on individual stocks is a useful reality check. Hendrik Bessembinder found that the best-performing 4.3% of US stocks created all of the market’s net wealth since 1926, and that 58% failed to beat Treasury bills over their lifetimes. A label such as "blue chip" or "growth" does not tell you which group a stock will land in.
Keep in mind: Labels describe a stock today, not its future. A blue chip can stumble, a penny stock can soar and a value stock can stay cheap for years. Use types to understand and diversify, not to predict.
How the Types Overlap
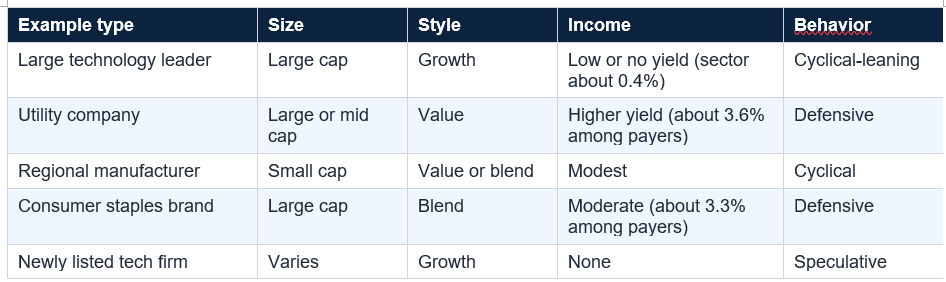
One company can belong to several types at once. A large technology company can be a large-cap, growth, non-dividend or low-dividend, cyclical-leaning, domestic stock all together. That is why it helps to look at a stock through several lenses. The table shows how a few archetypes fit.
Putting It Together: Building a Mix
The practical question is how to use all this. The simplest answer is to own many types at once through a broad index fund, which gives you large, mid and small companies, every sector and both growth and value in one purchase. If you want more control, you can add a tilt: a small-cap fund for extra growth potential, a dividend fund for income, an international fund for geographic spread. Keep the core broad and the tilts modest.Two cautions. First, concentration: a fund tracking the S&P 500 is about 38% technology and 39% in ten stocks, so if you add a technology fund on top, you are doubling down. Second, chasing last year’s winner. This year’s small-cap leadership and energy surge may reverse. A plan that holds several types and rebalances occasionally protects you from guessing which one is next.
Conclusion
Types of stocks are just ways of describing a company: how big it is, how it is priced, whether it pays you, what it sells and how it behaves when the economy shifts. They are useful because they show you what you own. In 2026 that matters more than usual, with small caps beating large ones, energy leading the sectors and one sector, technology, claiming 38% of the S&P 500.The best habit is to hold several types rather than bet on one, keep your core broad and low cost, and treat the latest winner with suspicion. Labels help you understand, but they do not predict. Start by looking at what you already own, and see which types you have too much or too little of. This is general education, not personalized advice, and a qualified adviser can help you apply it.
Frequently Asked Questions
What are the main types of stocks?Investors usually sort stocks several ways at once: by ownership class (common or preferred), by company size (large, mid, small, micro), by style (growth, value, blend), by income (dividend payers), by sector (such as technology or energy), by behavior (cyclical or defensive) and by quality or risk (blue chip, speculative, penny). One stock can fit several categories.
What is the difference between growth and value stocks?
Growth stocks are priced for fast expected earnings growth, often with low or no dividends. Value stocks trade at lower prices relative to earnings or assets, often because growth is slower or sentiment is poor. Leadership rotates: in the second quarter of 2026, small-cap growth rose 25.7% versus 17.2% for small-cap value, yet value led over some longer periods.
Are dividend stocks safer than other stocks?
Not necessarily. Dividends can be cut, as Telus did with a 55.2% reduction, according to Dividend.com. The S&P 500’s overall yield is only about 1.0%, while a 52-week Treasury bill paid about 4.46% in October, so the yield alone is not a reason to choose a stock.
Which type of stock is best for beginners?
Most beginners do best owning many types at once through a broad index fund, rather than picking one. Research by Hendrik Bessembinder found that 58% of US stocks failed to beat Treasury bills over their lifetimes and that the best 4.3% created all net market wealth, which is why diversification matters.
Do small-cap stocks beat large-cap stocks?
Not always. In 2026 through October 2, the S&P SmallCap 600 returned 16.30% versus 13.79% for the S&P 500, but small caps trailed large caps in 2025 and often swing more. Results rotate over time, so many investors hold both.
0 Comments
Be the first to share your thoughts on this article.