
Real Estate
UK House Prices 2026: Latest Data & Property Forecasts
UK house prices started 2026 with genuine momentum — rising 2% in the first four months. Then a geopolitical shock from the Middle East pushed mortgage rates back up, cooled buyer confidence, and triggered a wave of downward forecast revisions from Savills, Knight Frank, Pantheon Macroeconomics and Rightmove. As of September 2026, the market is in controlled deceleration: Nationwide shows +1.6% annual growth, Lloyds shows the first annual fall since November 2023, and RICS data shows buyer enquiries down nearly 30%. Yet medium-term forecasts remain broadly positive. This guide brings together all the latest data, the regional picture, the forecast consensus, and what it means for buyers and sellers right now.

Three headline figures tell the story. Nationwide puts the average UK house price at £275,465 in August 2026, with annual growth of 1.6% — a deceleration from 2.2% in June. The Lloyds House Price Index (the renamed Halifax index, following the rebrand completed in July 2026) puts the average at £298,468 in August, down from £299,153 in July and recording the first annual fall since November 2023. The ONS UK House Price Index — the most comprehensive measure, using Land Registry sold data — shows 2.0% annual growth and an average of £271,295 for June 2026, the most recently available official figure.
The three indices diverge in both methodology and result — as they always have — but the direction of travel is consistent: growth is slowing, buyer activity has cooled, and the second half of 2026 is proving more challenging than the first. Yet this is not a repeat of 2022's post-mini-Budget shock or the sharp downturn many feared when interest rates first rose. It is, as SurveyMerchant's September 2026 briefing describes it, 'a tug-of-war between cautious buyers, stretched affordability, and a mortgage market still adjusting to Bank of England policy.'
Average UK house prices — August 2026: Nationwide £275,465 (+1.6% annual; −0.4% monthly). Lloyds/Halifax £298,468 (+0.0% / first annual fall since Nov 2023). ONS/Land Registry £271,295–£272,000 (+2.0% annual, June 2026). Bank of England base rate: 3.75% (held July 2026). Average fixed mortgage rates: ~4%. RICS buyer enquiries: −28%. RICS agreed sales: −30%. Transaction volumes 2026: expected 1.4–1.5 million.
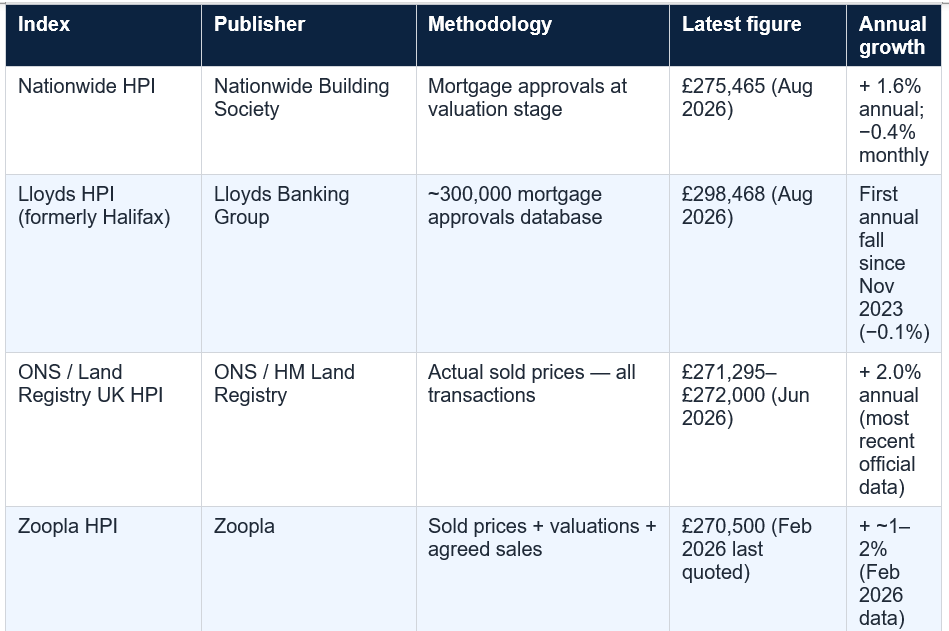

The key divergence between Nationwide (£275,465) and Lloyds (£298,468) reflects the different composition of each lender's mortgage book — Lloyds lends on more expensive properties on average — rather than a fundamental disagreement about the direction of the market. Both show deceleration from earlier in 2026. The MoneyWeek analysis (published 10 September 2026, two days before this article) captures the Lloyds position: 'The lender also said house prices fell on an annual basis for the first time since November 2023' in August 2026.
Nationwide's commentary in its July 2026 release was notably cautious: 'Market activity and house prices have remained subdued in recent months, in part reflecting the uncertain economic backdrop.' Lloyds described the July market as 'steady... average property price effectively unchanged over the month' and noted that 'average house prices have remained relatively stable for almost two years, moving within a narrow range.'
Then the geopolitical situation changed. A conflict beginning in the Middle East in February 2026 pushed oil and gas prices sharply higher, reignited inflationary pressures, and caused fixed mortgage rates — which had been declining toward the 4% level — to stop falling and in some cases tick back up. Buyer confidence, which had been recovering, retreated. YooSell (July 2026) describes the mechanism: 'The UK housing market forecast changed significantly in 2026 because of geopolitical conflict in the Middle East that began in February 2026. The conflict pushed up oil and gas prices, reignited inflation, and caused fixed mortgage rates to rise sharply. Savills, Knight Frank, Pantheon Macroeconomics and others all revised their forecasts downward.'
The partial recovery came in late May and June 2026 following a US-Iran ceasefire and lower-than-expected May inflation data. But by then, the damage to market confidence was done. Savills revised its full-year forecast from +2% to −2%. Rightmove, which had started the year forecasting +2% on asking prices, downgraded to 0% to −2%. Pantheon Macroeconomics, which had forecast +3%, cut to +1%.
The 2026 housing market is a case study in how external shocks — not domestic fundamentals — can reshape a property market in weeks. The UK's underlying housing demand is structurally strong: household formation continues to outpace new build completions, and population growth sustains demand even in downturns. But mortgage rate sensitivity means that geopolitical events that affect gilt yields and swap rates filter directly into monthly mortgage costs within weeks, and buyer affordability is the marginal variable that determines whether transactions proceed. The geopolitical shock was the mechanism; stretched affordability was the pre-existing vulnerability it exploited.
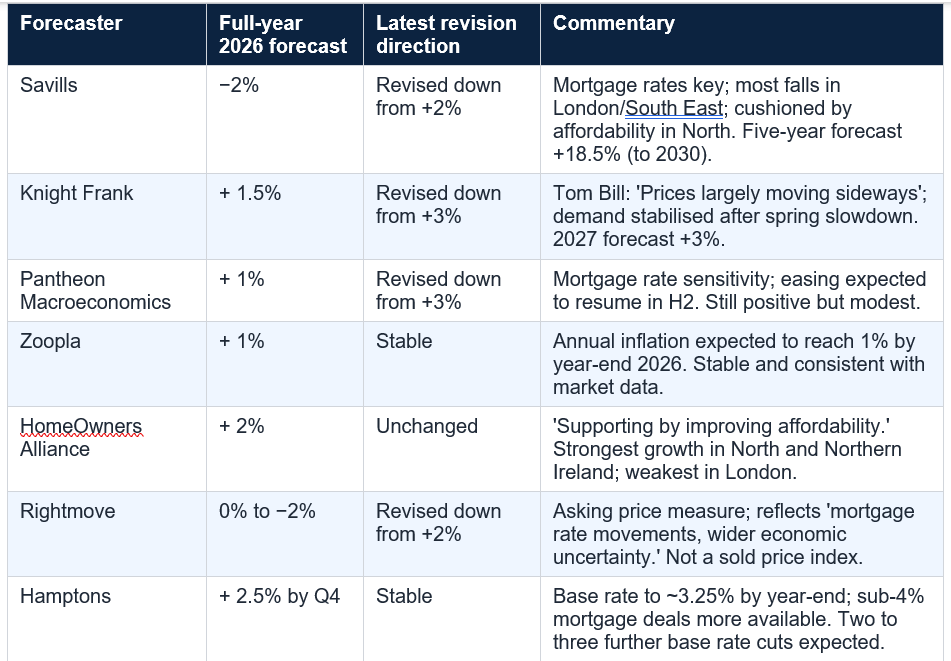
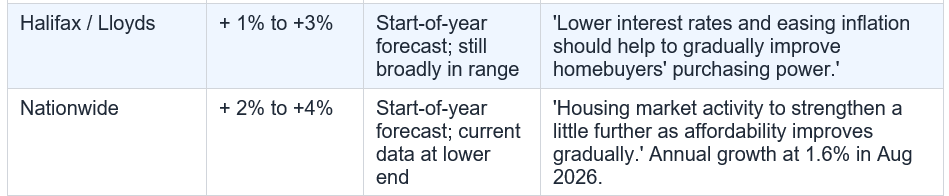
Forecasters have a poor track record on UK house prices. Rightmove forecast +4% for 2025; Nationwide's index ended 2025 at +0.6% and Halifax at +0.3% (HomeOwners Alliance). The range of 2026 forecasts from −2% to +2.5% reflects genuine uncertainty. Use forecasts as scenario planning tools, not predictions — and remember that regional variation can make national forecasts almost irrelevant for individual transactions.
Northern Ireland: Leading growth: +8.0% annual (Oct 2025 Halifax); +6.3% Feb 2026 Halifax — Highest growth region. Most affordable major market relative to incomes; most headroom for price improvement. Savills projects outperformance to continue through the five-year period.
Scotland: +4.4% annual (Oct 2025 Halifax); +4.7% Feb 2026 — Second strongest performer. Average price £216,051 (Oct 2025). Comparative affordability and employment market supporting prices. September 2026 briefings note 'comparatively firmer conditions.'
North East: +4.1% annual (Oct 2025 Halifax); +3.5% Feb 2026 — Most affordable English region by absolute price (average ~£180,924 Oct 2025). Price-to-income ratios leave meaningful headroom for growth even with higher mortgage rates.
North West: +2.9% annual (Feb 2026 Halifax) — Manchester and surrounding areas continue to attract demand from southern buyers seeking affordability. Buy-to-let investors also remain more active in Northern regions.
Wales: +2.0% annual (Oct 2025 Halifax); +2.4% Feb 2026 — Mid-range performer. Average price £229,558 (Oct 2025). Stamp duty structure in Wales (Land Transaction Tax) differs from England; threshold changes affect Welsh market differently.
London: −0.3% to −1.0% annual (Oct 2025–Feb 2026 Halifax); Savills forecasts most significant falls in 2026 — Average price ~£542,273 (Oct 2025 Halifax). Higher stamp duty costs on expensive properties; stretched affordability; increased supply from landlord disposals. South East also weak: −2.2% (Feb 2026 Halifax). Tom Bill (Knight Frank): 'London asking prices are falling faster than the national average.'
The IREIS September 2026 briefing summarises the dynamic: 'Three months into the second half of 2026, the consensus from market participants is that London and the South East are correcting whilst the North West and Scotland show comparatively firmer conditions.' Savills' Lucian Cook stated in his revised forecast: 'Regional performance continues to be shaped by affordability. Savills forecasts the North of England, Scotland and Wales to outperform during the period of higher mortgage rates, reflecting their stronger affordability cushion.'
The YooSell analysis (July 2026) adds: 'The most affordable regions, including the North West, Midlands and Northern Ireland, are forecast to see positive price growth of 3–5% [for 2026 as a whole]. UK house prices may fall modestly in some areas, particularly London, the South East and premium rural markets, but are not expected to fall nationally in a significant or sustained way.'
The Bank of England cut its base rate four times during 2025, from 4.75% to 3.75%. At 3.75%, the base rate is significantly below its 2023 peak of 5.25% but still above the pre-2022 era of near-zero rates. The MPC held at 3.75% at its July 2026 meeting (6-3 vote, the most hawkish split this cycle according to IREIS), and approximately 90% of economists in a Reuters poll expected another hold at the September 17 2026 meeting.
For the housing market, the relevant rate is not the base rate but the mortgage rate — specifically the two- and five-year fixed rates that the majority of buyers use. These are priced primarily off gilt yields and swap rates, not the Bank of England base rate directly. Average fixed mortgage rates for many products were hovering around 4% as of mid-2026 (Savills; Robinson & Hall), having come down from the 6%+ peaks of late 2022 and 2023. But the geopolitical-driven volatility in gilt yields in early 2026 caused those rates to stop declining and in some cases temporarily reverse.
Hamptons' forecast (cited HomeOwners Alliance) outlines the expected trajectory: 'We expect inflation to fall faster than anticipated next year, paving the way for two or three base rate cuts. By year-end, the Bank Rate could settle around 3.25%, with mortgage rates stabilising near 4%. This should boost the availability of sub-4% mortgage deals, even for borrowers with smaller deposits, easing affordability pressures.' Oxford Economics' projection, cited by Savills, targets a base rate of 2.5% by 2027.
Buyer/Seller tip: For buyers: a 4% mortgage rate on a £250,000 loan over 25 years costs approximately £1,319/month. At 3.5%, the same loan costs approximately £1,252/month — a saving of £67/month or £804/year. The difference between a 4% and 3% rate over 25 years on the same loan is approximately £155/month or £46,500 total. Whether to lock in now or wait for rates to fall is one of the most important buyer decisions in the current market. There is no guarantee that rates will fall — consult a whole-of-market mortgage broker for current options. See gov.uk/mortgages for MoneyHelper guidance.
These borrowers took out five-year fixes in 2021 and 2022, when the Bank of England base rate was near zero and fixed rates of 2–2.5% were widely available. When their deal expires, they face remortgaging at rates of approximately 4%+ — a significant and unavoidable increase in monthly costs. For a borrower with a £200,000 outstanding mortgage, the difference between a 2% and 4% rate is approximately £204 per month — or £2,448 per year.
The impact on the housing market is twofold. First, some borrowers facing the payment shock may be forced to sell or to accept lower prices to attract buyers quickly. Second, the financial pressure on existing homeowners may reduce their confidence to trade up to more expensive properties, dampening the 'second-stepper' market. Hamptons' language is careful but clear: 'Others are still adjusting to higher costs, particularly the 600,000 borrowers on sub-3% five-year fixes due to expire in 2026 and 2027.'
If you are one of the 600,000 borrowers with a sub-3% fix expiring in 2026 or 2027, the transition to a 4%+ rate is now a near-certainty rather than a risk. Plan for the increase now rather than waiting for your deal to expire: speak to your lender about product transfer options (which do not require a new valuation or income assessment), and contact a whole-of-market broker to compare the remortgage market. Starting the process 3–6 months before expiry gives you the most options.
The increase in supply has two principal drivers. First, private landlords are selling. The Renters' Rights Act — which passed into law in 2026 and has restructured the private rented sector by abolishing Section 21 no-fault evictions — has reduced landlords' flexibility. Combined with higher mortgage rates on buy-to-let properties and additional stamp duty, many landlords are choosing to exit rather than adapt. Savills' revised forecast notes: 'Lower demand is being set against elevated levels of stock — partially from landlords selling up in the face of greater regulation, which will place downward pressure on prices, particularly across submarkets in London and the South East.'
Second, some sellers who delayed listing during the market uncertainty of 2024–2025 are now bringing properties to market, having waited for what they hoped would be improved conditions. When improved conditions were interrupted by the geopolitical shock of early 2026, those properties joined a market with already-cautious buyers — creating a buyer's market in many segments.
The rising supply from landlord disposals is primarily concentrated in the lower end of the market — smaller properties in urban areas that were previously rented out. For first-time buyers with mortgage pre-approval, this represents an opportunity: more choice, less competition, and in some areas, the ability to negotiate asking prices downward. For sellers in the same segments, it means longer time on market and pricing discipline is essential.
The August 2026 RICS data (cited SurveyMerchant, September 2026) is sobering in some respects: new buyer enquiries are approximately −28% (meaning significantly more surveyors report falling enquiries than rising ones), and agreed sales are approximately −30%. These are readings consistent with a subdued rather than active market.
However, the same survey showed seller instructions improving sharply — meaning the supply side of the market is becoming more active even as demand cools. In the medium term, if demand recovers (as Hamptons and the base-rate-cutting camp expect), rising supply now may create good conditions for buyers while the market rebalances. The RICS survey's 12-month price expectation balance is one of the metrics that turned positive in early 2026 even when the current reading was subdued — reflecting surveyors' view that the current weakness is temporary rather than structural.
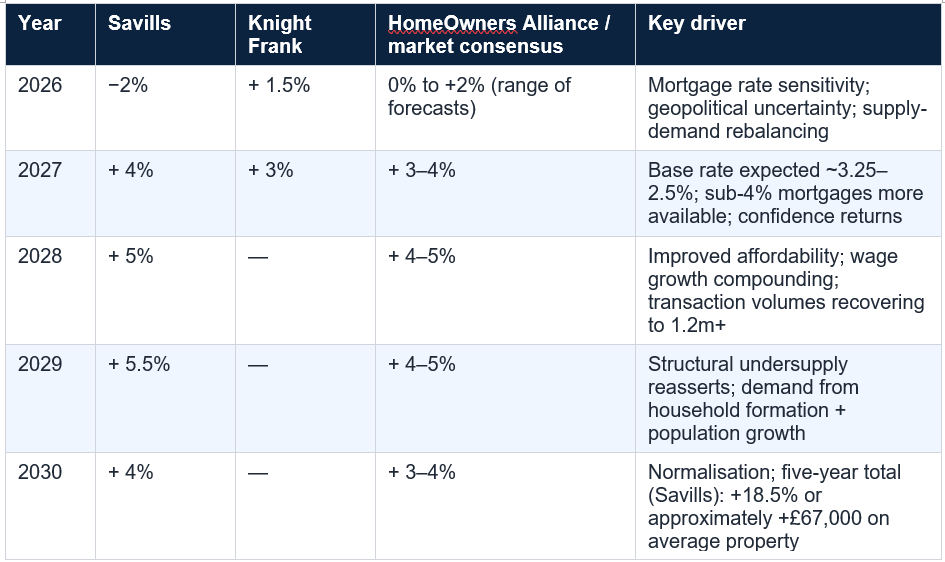
Sources: Savills revised mainstream house price forecast (2026); Robinson & Hall (April 2026) citing Savills five-year total; HomeOwners Alliance (September 2026); Knight Frank; YooSell (July 2026). All forecasts are opinion and subject to change. Not financial or property advice.
Savills' five-year view is expressed with notable conviction: over the five years to 2030, average house prices are expected to increase by 18.5%, or approximately £67,000 on the current average price. The driver is the gradual improvement in affordability as mortgage rates decline, wage growth continues, and household formation sustains underlying demand. Oxford Economics projects the Bank of England base rate at 2.5% by 2027 — a level that would bring two- and five-year fixed rates significantly below 4% for many borrowers, materially improving purchasing power.
The long-term structural case for UK house prices rests on a supply constraint that has persisted for decades. Housing completions in England consistently fall short of the government's own targets. Planning reform remains politically difficult. And the combination of population growth and changing household formation patterns — more single-person households, more people living alone — generates demand that new build cannot keep pace with. These structural factors underpin the medium-term case even when the cyclical picture is subdued.
Properties that are priced in line with local comparables are still selling — transaction volumes of 1.4–1.5 million for 2026 are consistent with a functioning, active market even if not a booming one. But properties priced ahead of the market are languishing. The longer a property sits unsold, the weaker the negotiating position when a buyer eventually arrives.
The regional picture is the more important story. Northern Ireland, Scotland, and the North of England continue to outperform on affordability grounds. London and the South East are under genuine pressure from stretched affordability, returning supply, landlord disposals, and higher stamp duty costs. For buyers and sellers in these different markets, the implications are almost opposite: northern buyers may be in a window of improving affordability before the medium-term price recovery; southern sellers may need to price more competitively than they have been.
The medium-term view — Savills +18.5% over five years to 2030, underpinned by falling rates, improving wages, and structural undersupply — remains intact. The question for 2026 is not whether house prices will be significantly higher in 2030 than today, but whether the market reaches that destination through modest growth or through a modest dip followed by a stronger recovery. The answer depends on mortgage rates, the Bank of England's next moves, and geopolitical conditions that are inherently unpredictable.
The average UK house price in August–September 2026 depends on which index you use: Nationwide puts it at £275,465 (August 2026, annual growth +1.6%); the Lloyds House Price Index (formerly Halifax, renamed July 2026) shows £298,468 (August 2026, first annual fall since November 2023); and the ONS/Land Registry figure — the most comprehensive, using actual sold prices — was £271,295–£272,000 for June 2026 (the most recently published official data), with annual growth of +2.0%. The divergence reflects different methodologies: Nationwide and Lloyds use mortgage approval data; ONS uses actual completed sales. The ONS is considered the most reliable but has a 2–3 month lag. The July 2026 ONS figure was due for publication on 16 September 2026. Sources: MoneyWeek (10 September 2026); IREIS (September 2026); HomeOwners Alliance (September 2026).
Will UK house prices fall in 2026?
Forecasts range from −2% (Savills' revised forecast, citing higher mortgage rates following mid-year geopolitical shock) to +2.5% (Hamptons, citing expected rate cuts). Knight Frank forecasts +1.5%, Pantheon Macroeconomics +1%, Zoopla +1%, HomeOwners Alliance +2%, Rightmove 0% to −2%. The consensus is that any falls will be modest and concentrated in London and the South East, while the North of England, Northern Ireland, and Scotland continue to see positive growth. The national average is unlikely to fall sharply — transaction volumes of 1.4–1.5 million for 2026 are consistent with a functioning market, not a crash. Forecasters have a poor track record: Rightmove forecast +4% for 2025 and Nationwide ended the year at +0.6% (HomeOwners Alliance). Treat all forecasts as scenario planning, not predictions.
Why did house price forecasts change so much during 2026?
Geopolitical conflict beginning in February 2026 pushed oil and gas prices higher, reignited inflationary pressure, and caused fixed mortgage rates to stop falling and in some cases tick back up. This happened just as the market was recovering from 2024–2025's adjustment period. The partial recovery of forecasts followed a US-Iran ceasefire and lower-than-expected May 2026 inflation data (YooSell, July 2026). The episode illustrates how sensitive the UK housing market is to mortgage rate movements — and how quickly external shocks can disrupt domestic market trajectories. Savills revised from +2% to −2% in a single update; Rightmove moved from +2% to 0%/−2%.
What is happening to UK house prices in London in 2026?
London is the weakest major UK region in 2026. Halifax data showed slight annual declines of −0.3% to −1.0% in late 2025 and early 2026 (TradingEconomics). By February 2026, London was down 1% annually while the South East was −2.2% (Halifax, February 2026). Savills forecasts the most significant 2026 falls will be in London and the South East, reflecting: stretched affordability (average London price ~£542,273); higher stamp duty costs on expensive properties; increased supply from landlords selling up following the Renters' Rights Act; and buyer caution driven by geopolitical uncertainty. The medium-term outlook for London is more positive — Savills projects the market to recover from 2027 as rates fall and confidence returns — but 2026 is proving challenging for London sellers.
What are the UK house price forecasts for 2027 and beyond?
Medium-term forecasts are considerably more optimistic than the immediate 2026 outlook. Savills forecasts +4% in 2027, +5% in 2028, +5.5% in 2029, and +4% in 2030 — a cumulative five-year total of +18.5%, approximately £67,000 on the average property. Knight Frank forecasts +3% for 2027. The driver is the expected continuation of Bank of England rate cuts — Oxford Economics projects a base rate of 2.5% by 2027, which would bring two- and five-year fixed mortgage rates materially below 4% for many borrowers, significantly improving affordability. Structural undersupply of housing in the UK remains the most powerful long-term price support: household formation consistently outpaces new build completions, and planning reform remains politically difficult to deliver at scale.
Should I buy a house in 2026 or wait until 2027?
There is no universally correct answer — it depends on your circumstances, region, and timeline. In the North of England, Northern Ireland, and Scotland, where affordability is better and prices are still growing positively, waiting may mean buying at higher prices in 2027. In London and the South East, where prices are under pressure in 2026, there may be more negotiating room for buyers now than in 2027 if the medium-term recovery takes hold. If you are buying for ten or more years, the difference between buying in late 2026 versus early 2027 is unlikely to be material — the five-year forecast of +18.5% (Savills) would dwarf the short-term variation. For a personalised view on timing and affordability, use MoneyHelper's mortgage tools at moneyhelper.org.uk and consult a qualified independent financial adviser or mortgage broker.
Table of Contents
- A Market in Controlled Deceleration
- The Latest Data: What the Major Indices Show in August–September 2026
- Why Forecasts Were Revised Down Mid-Year
- The 2026 Forecast Consensus: What the Experts Now Say
- The Regional Picture: North–South Divide Deepens
- Mortgage Rates: The Key Variable Keeping Buyers Cautious
- The 600,000 Borrower Problem: Mortgage Expiry Risk
- Supply Is Rising: What More Listings Mean for Prices
- RICS Survey: What Surveyors Are Seeing on the Ground
- The Medium-Term Outlook: 2027–2030 Forecasts
- Buyers: Should You Buy Now or Wait?
- Sellers: What the Market Means for Your Asking Price
- Conclusion: Modest Moves, Meaningful Differences by Region
- Frequently Asked Questions
2026 Full Year Forecast: The Range of Expert View
Regional House Prices: The North - South DIvide
Medium term Outlook: 2026 - 2030 Savills Forecast
A Market in Controlled Deceleration
The UK housing market in September 2026 is not crashing, but it is clearly losing momentum. After a surprisingly strong start to the year — Nationwide recorded 2.0% house price growth across the first four months of 2026 — a combination of geopolitical shock, higher-than-expected mortgage rate persistence, and returning caution among buyers has pushed the market into a period of near-stagnation.Three headline figures tell the story. Nationwide puts the average UK house price at £275,465 in August 2026, with annual growth of 1.6% — a deceleration from 2.2% in June. The Lloyds House Price Index (the renamed Halifax index, following the rebrand completed in July 2026) puts the average at £298,468 in August, down from £299,153 in July and recording the first annual fall since November 2023. The ONS UK House Price Index — the most comprehensive measure, using Land Registry sold data — shows 2.0% annual growth and an average of £271,295 for June 2026, the most recently available official figure.
The three indices diverge in both methodology and result — as they always have — but the direction of travel is consistent: growth is slowing, buyer activity has cooled, and the second half of 2026 is proving more challenging than the first. Yet this is not a repeat of 2022's post-mini-Budget shock or the sharp downturn many feared when interest rates first rose. It is, as SurveyMerchant's September 2026 briefing describes it, 'a tug-of-war between cautious buyers, stretched affordability, and a mortgage market still adjusting to Bank of England policy.'
Average UK house prices — August 2026: Nationwide £275,465 (+1.6% annual; −0.4% monthly). Lloyds/Halifax £298,468 (+0.0% / first annual fall since Nov 2023). ONS/Land Registry £271,295–£272,000 (+2.0% annual, June 2026). Bank of England base rate: 3.75% (held July 2026). Average fixed mortgage rates: ~4%. RICS buyer enquiries: −28%. RICS agreed sales: −30%. Transaction volumes 2026: expected 1.4–1.5 million.
The Latest Data: What the Major Indices Show in August–September 2026
The UK has five major house price indices, each measuring a different slice of the market with different methodologies. Understanding what each one measures explains why the headline numbers diverge:The key divergence between Nationwide (£275,465) and Lloyds (£298,468) reflects the different composition of each lender's mortgage book — Lloyds lends on more expensive properties on average — rather than a fundamental disagreement about the direction of the market. Both show deceleration from earlier in 2026. The MoneyWeek analysis (published 10 September 2026, two days before this article) captures the Lloyds position: 'The lender also said house prices fell on an annual basis for the first time since November 2023' in August 2026.
Nationwide's commentary in its July 2026 release was notably cautious: 'Market activity and house prices have remained subdued in recent months, in part reflecting the uncertain economic backdrop.' Lloyds described the July market as 'steady... average property price effectively unchanged over the month' and noted that 'average house prices have remained relatively stable for almost two years, moving within a narrow range.'
Why Forecasts Were Revised Down Mid-Year
The UK housing market entered 2026 with broad optimism. Interest rates had fallen four times in 2025, from 4.75% to 3.75%. Inflation was easing. Wage growth was outpacing house price growth, gradually improving affordability. Savills, Knight Frank, Hamptons and Nationwide all started the year forecasting modest positive growth of 2–4%. Prices responded: Nationwide recorded 2.0% growth in the first four months of the year.Then the geopolitical situation changed. A conflict beginning in the Middle East in February 2026 pushed oil and gas prices sharply higher, reignited inflationary pressures, and caused fixed mortgage rates — which had been declining toward the 4% level — to stop falling and in some cases tick back up. Buyer confidence, which had been recovering, retreated. YooSell (July 2026) describes the mechanism: 'The UK housing market forecast changed significantly in 2026 because of geopolitical conflict in the Middle East that began in February 2026. The conflict pushed up oil and gas prices, reignited inflation, and caused fixed mortgage rates to rise sharply. Savills, Knight Frank, Pantheon Macroeconomics and others all revised their forecasts downward.'
The partial recovery came in late May and June 2026 following a US-Iran ceasefire and lower-than-expected May inflation data. But by then, the damage to market confidence was done. Savills revised its full-year forecast from +2% to −2%. Rightmove, which had started the year forecasting +2% on asking prices, downgraded to 0% to −2%. Pantheon Macroeconomics, which had forecast +3%, cut to +1%.
The 2026 housing market is a case study in how external shocks — not domestic fundamentals — can reshape a property market in weeks. The UK's underlying housing demand is structurally strong: household formation continues to outpace new build completions, and population growth sustains demand even in downturns. But mortgage rate sensitivity means that geopolitical events that affect gilt yields and swap rates filter directly into monthly mortgage costs within weeks, and buyer affordability is the marginal variable that determines whether transactions proceed. The geopolitical shock was the mechanism; stretched affordability was the pre-existing vulnerability it exploited.
The 2026 Forecast Consensus: What the Experts Now Say
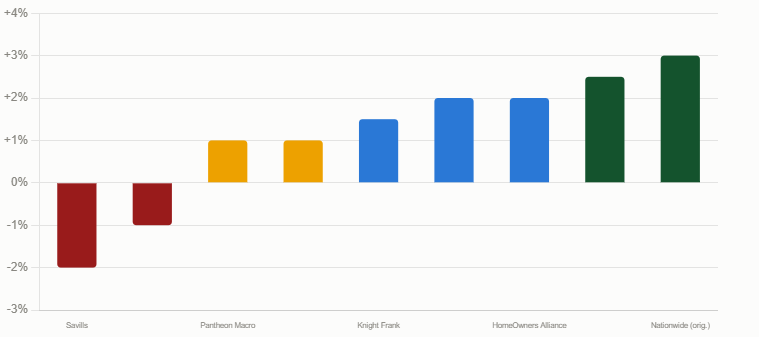
As of September 2026, the forecast consensus for full-year 2026 house price growth in the UK ranges from −2% (Savills) to +2.5% (Hamptons). This unusually wide range reflects genuine disagreement about how quickly mortgage rates will settle and how buyer confidence will evolve in the second half of the year. The key forecasts:Forecasters have a poor track record on UK house prices. Rightmove forecast +4% for 2025; Nationwide's index ended 2025 at +0.6% and Halifax at +0.3% (HomeOwners Alliance). The range of 2026 forecasts from −2% to +2.5% reflects genuine uncertainty. Use forecasts as scenario planning tools, not predictions — and remember that regional variation can make national forecasts almost irrelevant for individual transactions.
The Regional Picture: North–South Divide Deepens
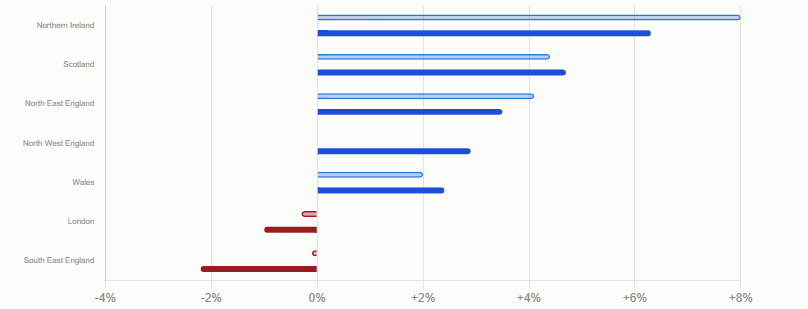
National house price data conceals substantial regional variation. In 2026, that variation has widened significantly as the geopolitical shock and affordability pressure disproportionately affect London and the South East — where prices are highest, affordability is most stretched, and stamp duty costs are most prohibitive — while more affordable northern markets continue to show positive growth.Northern Ireland: Leading growth: +8.0% annual (Oct 2025 Halifax); +6.3% Feb 2026 Halifax — Highest growth region. Most affordable major market relative to incomes; most headroom for price improvement. Savills projects outperformance to continue through the five-year period.
Scotland: +4.4% annual (Oct 2025 Halifax); +4.7% Feb 2026 — Second strongest performer. Average price £216,051 (Oct 2025). Comparative affordability and employment market supporting prices. September 2026 briefings note 'comparatively firmer conditions.'
North East: +4.1% annual (Oct 2025 Halifax); +3.5% Feb 2026 — Most affordable English region by absolute price (average ~£180,924 Oct 2025). Price-to-income ratios leave meaningful headroom for growth even with higher mortgage rates.
North West: +2.9% annual (Feb 2026 Halifax) — Manchester and surrounding areas continue to attract demand from southern buyers seeking affordability. Buy-to-let investors also remain more active in Northern regions.
Wales: +2.0% annual (Oct 2025 Halifax); +2.4% Feb 2026 — Mid-range performer. Average price £229,558 (Oct 2025). Stamp duty structure in Wales (Land Transaction Tax) differs from England; threshold changes affect Welsh market differently.
London: −0.3% to −1.0% annual (Oct 2025–Feb 2026 Halifax); Savills forecasts most significant falls in 2026 — Average price ~£542,273 (Oct 2025 Halifax). Higher stamp duty costs on expensive properties; stretched affordability; increased supply from landlord disposals. South East also weak: −2.2% (Feb 2026 Halifax). Tom Bill (Knight Frank): 'London asking prices are falling faster than the national average.'
The IREIS September 2026 briefing summarises the dynamic: 'Three months into the second half of 2026, the consensus from market participants is that London and the South East are correcting whilst the North West and Scotland show comparatively firmer conditions.' Savills' Lucian Cook stated in his revised forecast: 'Regional performance continues to be shaped by affordability. Savills forecasts the North of England, Scotland and Wales to outperform during the period of higher mortgage rates, reflecting their stronger affordability cushion.'
The YooSell analysis (July 2026) adds: 'The most affordable regions, including the North West, Midlands and Northern Ireland, are forecast to see positive price growth of 3–5% [for 2026 as a whole]. UK house prices may fall modestly in some areas, particularly London, the South East and premium rural markets, but are not expected to fall nationally in a significant or sustained way.'
Mortgage Rates: The Key Variable Keeping Buyers Cautious
If there is a single variable that explains almost all of the UK housing market's 2026 trajectory, it is mortgage rates. When rates were falling in late 2024 and early 2025, buyer activity recovered and prices responded. When geopolitical events in early 2026 interrupted that decline, the market stalled.The Bank of England cut its base rate four times during 2025, from 4.75% to 3.75%. At 3.75%, the base rate is significantly below its 2023 peak of 5.25% but still above the pre-2022 era of near-zero rates. The MPC held at 3.75% at its July 2026 meeting (6-3 vote, the most hawkish split this cycle according to IREIS), and approximately 90% of economists in a Reuters poll expected another hold at the September 17 2026 meeting.
For the housing market, the relevant rate is not the base rate but the mortgage rate — specifically the two- and five-year fixed rates that the majority of buyers use. These are priced primarily off gilt yields and swap rates, not the Bank of England base rate directly. Average fixed mortgage rates for many products were hovering around 4% as of mid-2026 (Savills; Robinson & Hall), having come down from the 6%+ peaks of late 2022 and 2023. But the geopolitical-driven volatility in gilt yields in early 2026 caused those rates to stop declining and in some cases temporarily reverse.
Hamptons' forecast (cited HomeOwners Alliance) outlines the expected trajectory: 'We expect inflation to fall faster than anticipated next year, paving the way for two or three base rate cuts. By year-end, the Bank Rate could settle around 3.25%, with mortgage rates stabilising near 4%. This should boost the availability of sub-4% mortgage deals, even for borrowers with smaller deposits, easing affordability pressures.' Oxford Economics' projection, cited by Savills, targets a base rate of 2.5% by 2027.
Buyer/Seller tip: For buyers: a 4% mortgage rate on a £250,000 loan over 25 years costs approximately £1,319/month. At 3.5%, the same loan costs approximately £1,252/month — a saving of £67/month or £804/year. The difference between a 4% and 3% rate over 25 years on the same loan is approximately £155/month or £46,500 total. Whether to lock in now or wait for rates to fall is one of the most important buyer decisions in the current market. There is no guarantee that rates will fall — consult a whole-of-market mortgage broker for current options. See gov.uk/mortgages for MoneyHelper guidance.
The 600,000 Borrower Problem: Mortgage Expiry Risk
One of the most significant structural risks to the UK housing market in the second half of 2026 and into 2027 is the mortgage maturity cliff. Hamptons estimates that approximately 600,000 borrowers are on sub-3% five-year fixed rate mortgages that expire in 2026 and 2027.These borrowers took out five-year fixes in 2021 and 2022, when the Bank of England base rate was near zero and fixed rates of 2–2.5% were widely available. When their deal expires, they face remortgaging at rates of approximately 4%+ — a significant and unavoidable increase in monthly costs. For a borrower with a £200,000 outstanding mortgage, the difference between a 2% and 4% rate is approximately £204 per month — or £2,448 per year.
The impact on the housing market is twofold. First, some borrowers facing the payment shock may be forced to sell or to accept lower prices to attract buyers quickly. Second, the financial pressure on existing homeowners may reduce their confidence to trade up to more expensive properties, dampening the 'second-stepper' market. Hamptons' language is careful but clear: 'Others are still adjusting to higher costs, particularly the 600,000 borrowers on sub-3% five-year fixes due to expire in 2026 and 2027.'
If you are one of the 600,000 borrowers with a sub-3% fix expiring in 2026 or 2027, the transition to a 4%+ rate is now a near-certainty rather than a risk. Plan for the increase now rather than waiting for your deal to expire: speak to your lender about product transfer options (which do not require a new valuation or income assessment), and contact a whole-of-market broker to compare the remortgage market. Starting the process 3–6 months before expiry gives you the most options.
Supply Is Rising: What More Listings Mean for Prices
One factor that is clearly weighing on prices in 2026 — particularly in London and the South East — is a significant increase in the supply of properties for sale. RICS reported in August 2026 that seller instructions had improved sharply, even as buyer enquiries fell to approximately −28% and agreed sales to approximately −30% (SurveyMerchant, September 2026).The increase in supply has two principal drivers. First, private landlords are selling. The Renters' Rights Act — which passed into law in 2026 and has restructured the private rented sector by abolishing Section 21 no-fault evictions — has reduced landlords' flexibility. Combined with higher mortgage rates on buy-to-let properties and additional stamp duty, many landlords are choosing to exit rather than adapt. Savills' revised forecast notes: 'Lower demand is being set against elevated levels of stock — partially from landlords selling up in the face of greater regulation, which will place downward pressure on prices, particularly across submarkets in London and the South East.'
Second, some sellers who delayed listing during the market uncertainty of 2024–2025 are now bringing properties to market, having waited for what they hoped would be improved conditions. When improved conditions were interrupted by the geopolitical shock of early 2026, those properties joined a market with already-cautious buyers — creating a buyer's market in many segments.
The rising supply from landlord disposals is primarily concentrated in the lower end of the market — smaller properties in urban areas that were previously rented out. For first-time buyers with mortgage pre-approval, this represents an opportunity: more choice, less competition, and in some areas, the ability to negotiate asking prices downward. For sellers in the same segments, it means longer time on market and pricing discipline is essential.
RICS Survey: What Surveyors Are Seeing on the Ground
While the headline price indices measure where prices are, the RICS Residential Market Survey measures where the market is heading — collecting real-time feedback from chartered surveyors across the country on buyer enquiries, agreed sales, prices achieved, and expectations. It is often the earliest leading indicator of market turning points.The August 2026 RICS data (cited SurveyMerchant, September 2026) is sobering in some respects: new buyer enquiries are approximately −28% (meaning significantly more surveyors report falling enquiries than rising ones), and agreed sales are approximately −30%. These are readings consistent with a subdued rather than active market.
However, the same survey showed seller instructions improving sharply — meaning the supply side of the market is becoming more active even as demand cools. In the medium term, if demand recovers (as Hamptons and the base-rate-cutting camp expect), rising supply now may create good conditions for buyers while the market rebalances. The RICS survey's 12-month price expectation balance is one of the metrics that turned positive in early 2026 even when the current reading was subdued — reflecting surveyors' view that the current weakness is temporary rather than structural.
The Medium-Term Outlook: 2027–2030 Forecasts
While 2026 has proven more difficult than expected, the medium-term forecasts from the major property research houses are significantly more positive — and broadly consistent in their direction if not their precise magnitude.Sources: Savills revised mainstream house price forecast (2026); Robinson & Hall (April 2026) citing Savills five-year total; HomeOwners Alliance (September 2026); Knight Frank; YooSell (July 2026). All forecasts are opinion and subject to change. Not financial or property advice.
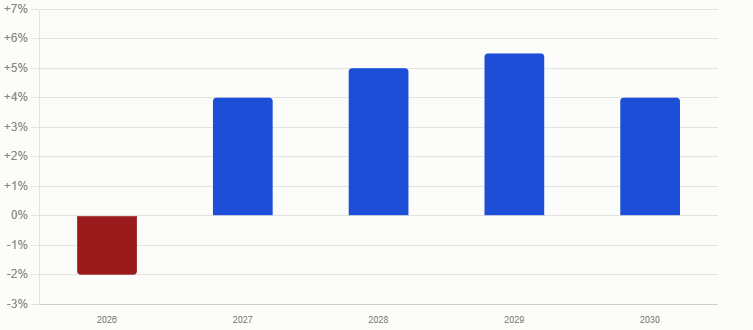
Savills' five-year view is expressed with notable conviction: over the five years to 2030, average house prices are expected to increase by 18.5%, or approximately £67,000 on the current average price. The driver is the gradual improvement in affordability as mortgage rates decline, wage growth continues, and household formation sustains underlying demand. Oxford Economics projects the Bank of England base rate at 2.5% by 2027 — a level that would bring two- and five-year fixed rates significantly below 4% for many borrowers, materially improving purchasing power.
The long-term structural case for UK house prices rests on a supply constraint that has persisted for decades. Housing completions in England consistently fall short of the government's own targets. Planning reform remains politically difficult. And the combination of population growth and changing household formation patterns — more single-person households, more people living alone — generates demand that new build cannot keep pace with. These structural factors underpin the medium-term case even when the cyclical picture is subdued.
Buyers: Should You Buy Now or Wait?
The question most buyers are asking in September 2026 is whether to act now or wait for either lower prices or lower mortgage rates. There is no universally correct answer — it depends entirely on individual circumstances — but the evidence suggests several useful frameworks:- If you plan to stay for five or more years: the short-term price movements matter much less than the long-term trajectory. Savills forecasts 18.5% cumulative growth by 2030. If you are buying to live in the property for a decade or more, the current soft patch is unlikely to be material to your total outcome.
- If you are a first-time buyer in an affordable region: the combination of more choice (rising supply), reduced competition, and improving affordability (wage growth outpacing house price growth) may make 2026 a better time to buy than 2025 or the early years of the next cycle when prices are expected to rise more strongly.
- If you are buying in London or the South East: Savills and Knight Frank both expect the most significant price pressure in these markets. Buyers in this segment may have more pricing power in late 2026 than they will in 2027 if the medium-term recovery takes hold.
- If you are waiting for mortgage rates to fall below 4%: Hamptons' forecast is that sub-4% deals should become more available if the Bank Rate falls to 3.25% by year-end. However, if rates fall and buyer demand returns simultaneously, asking prices may rise. The gain from a lower rate and the potential loss from a higher purchase price may partially offset.
Sellers: What the Market Means for Your Asking Price
For sellers in 2026, the most important insight from the data is that buyer enquiries are approximately 30% below where they were at the same time last year (RICS, August 2026). That means fewer buyers are looking at any given property, more competition from other sellers (especially in London and the South East where landlord disposals are adding to stock), and a market where pricing accurately from the outset is more important than ever.Properties that are priced in line with local comparables are still selling — transaction volumes of 1.4–1.5 million for 2026 are consistent with a functioning, active market even if not a booming one. But properties priced ahead of the market are languishing. The longer a property sits unsold, the weaker the negotiating position when a buyer eventually arrives.
- Price realistically from day one: your estate agent will typically present an optimistic case for the asking price. In the current market, starting at or just below the agent's highest suggested price, rather than above it, reduces the risk of a price reduction later that signals weakness to buyers.
- Present the property well: in a buyer's market, presentation matters more than in a seller's market. Buyers have more choice and will be more selective.
- Be prepared to negotiate on price: RICS data suggests agreed sales volumes are approximately 30% below year-ago levels. In this environment, being willing to negotiate — rather than holding out for the asking price — is likely to result in a faster and more certain sale.
- Consider timing: if your sale is not urgent, the medium-term forecasts suggest the market may be in better shape in 2027 as the base rate falls and affordability improves. But market timing is uncertain — and the costs of delay (holding costs, mortgage payments, opportunity cost) are real and immediate.
Conclusion
UK house prices in September 2026 are in a period of controlled deceleration. The first four months of the year brought 2% growth and genuine optimism; a geopolitical shock disrupted that trajectory and triggered a wave of downward forecast revisions. The current picture — Nationwide +1.6% annual, Lloyds first annual fall since November 2023, RICS buyer enquiries −28% — is subdued but not alarming. Transaction volumes of 1.4–1.5 million are consistent with a functioning market.The regional picture is the more important story. Northern Ireland, Scotland, and the North of England continue to outperform on affordability grounds. London and the South East are under genuine pressure from stretched affordability, returning supply, landlord disposals, and higher stamp duty costs. For buyers and sellers in these different markets, the implications are almost opposite: northern buyers may be in a window of improving affordability before the medium-term price recovery; southern sellers may need to price more competitively than they have been.
The medium-term view — Savills +18.5% over five years to 2030, underpinned by falling rates, improving wages, and structural undersupply — remains intact. The question for 2026 is not whether house prices will be significantly higher in 2030 than today, but whether the market reaches that destination through modest growth or through a modest dip followed by a stronger recovery. The answer depends on mortgage rates, the Bank of England's next moves, and geopolitical conditions that are inherently unpredictable.
Frequently Asked Questions
What is the average UK house price in September 2026?The average UK house price in August–September 2026 depends on which index you use: Nationwide puts it at £275,465 (August 2026, annual growth +1.6%); the Lloyds House Price Index (formerly Halifax, renamed July 2026) shows £298,468 (August 2026, first annual fall since November 2023); and the ONS/Land Registry figure — the most comprehensive, using actual sold prices — was £271,295–£272,000 for June 2026 (the most recently published official data), with annual growth of +2.0%. The divergence reflects different methodologies: Nationwide and Lloyds use mortgage approval data; ONS uses actual completed sales. The ONS is considered the most reliable but has a 2–3 month lag. The July 2026 ONS figure was due for publication on 16 September 2026. Sources: MoneyWeek (10 September 2026); IREIS (September 2026); HomeOwners Alliance (September 2026).
Will UK house prices fall in 2026?
Forecasts range from −2% (Savills' revised forecast, citing higher mortgage rates following mid-year geopolitical shock) to +2.5% (Hamptons, citing expected rate cuts). Knight Frank forecasts +1.5%, Pantheon Macroeconomics +1%, Zoopla +1%, HomeOwners Alliance +2%, Rightmove 0% to −2%. The consensus is that any falls will be modest and concentrated in London and the South East, while the North of England, Northern Ireland, and Scotland continue to see positive growth. The national average is unlikely to fall sharply — transaction volumes of 1.4–1.5 million for 2026 are consistent with a functioning market, not a crash. Forecasters have a poor track record: Rightmove forecast +4% for 2025 and Nationwide ended the year at +0.6% (HomeOwners Alliance). Treat all forecasts as scenario planning, not predictions.
Why did house price forecasts change so much during 2026?
Geopolitical conflict beginning in February 2026 pushed oil and gas prices higher, reignited inflationary pressure, and caused fixed mortgage rates to stop falling and in some cases tick back up. This happened just as the market was recovering from 2024–2025's adjustment period. The partial recovery of forecasts followed a US-Iran ceasefire and lower-than-expected May 2026 inflation data (YooSell, July 2026). The episode illustrates how sensitive the UK housing market is to mortgage rate movements — and how quickly external shocks can disrupt domestic market trajectories. Savills revised from +2% to −2% in a single update; Rightmove moved from +2% to 0%/−2%.
What is happening to UK house prices in London in 2026?
London is the weakest major UK region in 2026. Halifax data showed slight annual declines of −0.3% to −1.0% in late 2025 and early 2026 (TradingEconomics). By February 2026, London was down 1% annually while the South East was −2.2% (Halifax, February 2026). Savills forecasts the most significant 2026 falls will be in London and the South East, reflecting: stretched affordability (average London price ~£542,273); higher stamp duty costs on expensive properties; increased supply from landlords selling up following the Renters' Rights Act; and buyer caution driven by geopolitical uncertainty. The medium-term outlook for London is more positive — Savills projects the market to recover from 2027 as rates fall and confidence returns — but 2026 is proving challenging for London sellers.
What are the UK house price forecasts for 2027 and beyond?
Medium-term forecasts are considerably more optimistic than the immediate 2026 outlook. Savills forecasts +4% in 2027, +5% in 2028, +5.5% in 2029, and +4% in 2030 — a cumulative five-year total of +18.5%, approximately £67,000 on the average property. Knight Frank forecasts +3% for 2027. The driver is the expected continuation of Bank of England rate cuts — Oxford Economics projects a base rate of 2.5% by 2027, which would bring two- and five-year fixed mortgage rates materially below 4% for many borrowers, significantly improving affordability. Structural undersupply of housing in the UK remains the most powerful long-term price support: household formation consistently outpaces new build completions, and planning reform remains politically difficult to deliver at scale.
Should I buy a house in 2026 or wait until 2027?
There is no universally correct answer — it depends on your circumstances, region, and timeline. In the North of England, Northern Ireland, and Scotland, where affordability is better and prices are still growing positively, waiting may mean buying at higher prices in 2027. In London and the South East, where prices are under pressure in 2026, there may be more negotiating room for buyers now than in 2027 if the medium-term recovery takes hold. If you are buying for ten or more years, the difference between buying in late 2026 versus early 2027 is unlikely to be material — the five-year forecast of +18.5% (Savills) would dwarf the short-term variation. For a personalised view on timing and affordability, use MoneyHelper's mortgage tools at moneyhelper.org.uk and consult a qualified independent financial adviser or mortgage broker.

0 Comments Comments