
Investing
A Dividend Strategy for the iShares Core Dividend ETF (DIVB)

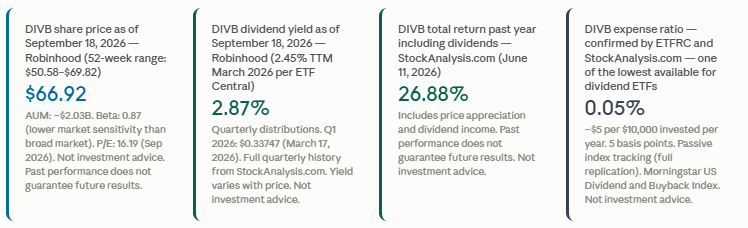
DIVB tracks the Morningstar US Dividend and Buyback Index. 385-407 holdings. 0.05% expense ratio. ~2.87% yield as of September 2026. 26.88% total return including dividends over the past year. Technology 33.38% of the portfolio. This is not your grandfather’s dividend fund. There is a version of dividend investing that is really just a defensive crouch. High yield at any price. Utilities and consumer staples stacked to the roof. Low growth, steady income, permanent underperformance in bull markets. And then there is a different version: the one that asks not just what the dividend yield is but what the total shareholder return is, and builds a portfolio around the companies most capable of sustaining it. The iShares Core Dividend ETF — ticker DIVB — is more the second version than the first. It tracks the Morningstar US Dividend and Buyback Index, which means its universe includes companies that return capital through buybacks as well as dividends. That dual criterion is why its technology allocation has reached 33.38% (Robinhood September 16, 2026) in a landscape where most traditional dividend funds have minimal tech exposure. The expense ratio is 0.05% — approximately $5 per $10,000 invested per year. The trailing yield as of September 2026 is approximately 2.87% (Robinhood). The total return including dividends over the past year was 26.88% as of June 2026 (StockAnalysis.com). The AUM is approximately $2.03 billion. This article explains what DIVB is built to do, what a practical strategy built around it looks like, and how it fits — and does not fit — into a broader investment framework.
DIVB tracks: Morningstar US Dividend and Buyback Index. Selection criterion: history of dividends AND/OR buybacks. Universe: 97% of US free-float market cap (all-cap). Holdings: 385-407 securities (various 2026 dates). Technology: 33.38% of portfolio (Robinhood September 16, 2026). Expense ratio: 0.05% (5 basis points). AUM: ~$2.03B September 2026 (Robinhood).
DIVB quarterly distribution history (StockAnalysis.com): Mar 2025 $0.31039; Jun 2025 $0.29282; Sep 2025 $0.33607; Dec 2025 $0.38887; Mar 2026 $0.33747. Trailing 12-month sum ~$1.355. Quarterly ex-dividend dates. DRIP reinvestment available through most major brokers.
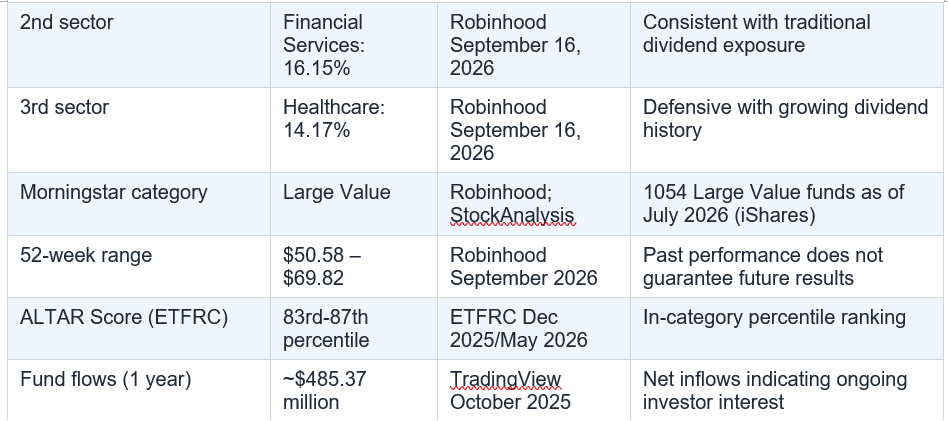
DIVB suits: broad US equity + modest income + very low cost + tech exposure + shareholder yield thesis. Does NOT suit: maximum income seekers; tech-avoidance requirements; bond substitute/capital preservation. 52-week range: $50.58-$69.82 (Robinhood Sep 2026) — illustrates equity risk.
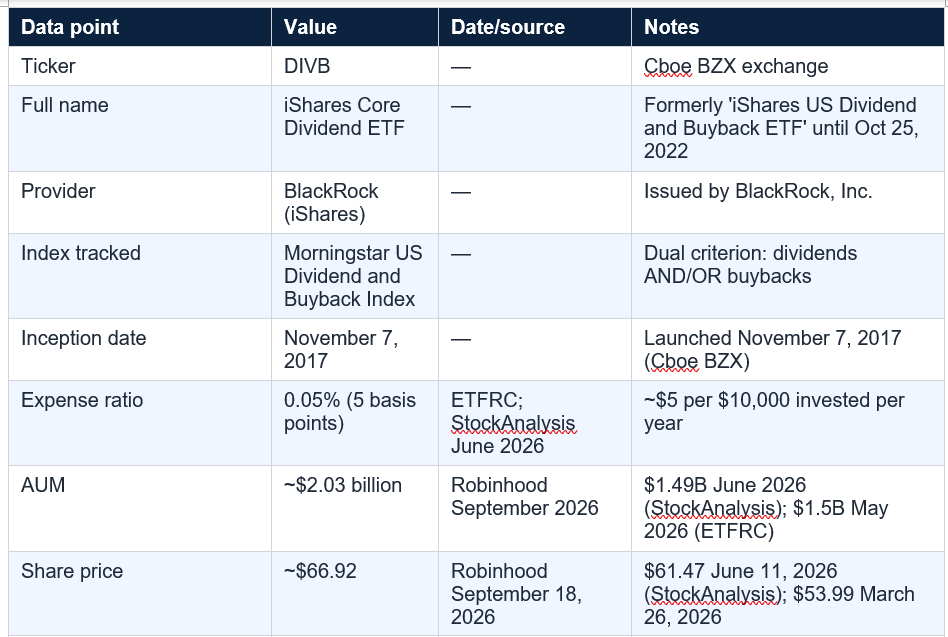
DIVB is the iShares Core Dividend ETF, issued by BlackRock. It was formerly named the iShares US Dividend and Buyback ETF until October 25, 2022. It tracks the Morningstar US Dividend and Buyback Index, which selects US stocks with a history of dividend payments and/or share buybacks. The fund was launched on November 7, 2017 and trades on the Cboe BZX exchange. As of September 2026, it holds approximately 385-407 securities, has AUM of approximately $2.03 billion, and carries an expense ratio of 0.05%. Sources: StockAnalysis.com June 2026; Robinhood September 2026; BlackRock/iShares official page.
What is DIVB's current dividend yield?
DIVB's dividend yield has ranged between approximately 2.21% and 2.87% across different dates and sources in 2026. ETF Central reported a trailing 12-month distribution yield of 2.45% as of March 11, 2026. Robinhood reported 2.87% as of September 18, 2026. StockAnalysis.com reported 2.21% on June 11, 2026. The variation reflects normal price movement — yield rises when the price falls and falls when the price rises. The fund distributes quarterly. Sources: ETF Central March 2026; Robinhood September 2026; StockAnalysis.com June 2026. Not investment advice. Always verify current yield at iShares.com or your broker.
How does DIVB differ from VYM or DGRO?
DIVB (iShares Core Dividend ETF), VYM (Vanguard High Dividend Yield Index ETF), and DGRO (iShares Core Dividend Growth ETF) are three different expressions of dividend investing. VYM overlaps approximately 59-64% with DIVB (ETFRC data), charges 0.06% (vs DIVB's 0.05%), focuses on high current yield, and has lower technology exposure. DGRO overlaps approximately 49-50% with DIVB, charges 0.08%, and focuses on companies with growing dividends rather than current yield or shareholder yield. DIVB's key differentiator is its inclusion of buyback-paying companies alongside dividend payers, which produces a higher technology allocation (33.38% as of September 2026) and a total shareholder yield orientation rather than a dividend-only focus. Sources: ETFRC May 2026 and December 2025 overlap data.
What are the main risks of investing in DIVB?
DIVB is an equity ETF and carries standard equity market risk: the value of the fund can fall as well as rise. As illustrated by the 52-week range of $50.58 to $69.82 (Robinhood September 2026), the price has experienced significant movement over the past year. The beta of 0.87 (StockAnalysis June 2026) suggests slightly lower volatility than the broad market, but this is a general tendency rather than a guarantee. Concentration risk in technology (33.38% as of September 2026) means that a significant technology sector drawdown would disproportionately affect DIVB versus a more balanced sector allocation. Dividend income is not guaranteed — distributions can vary quarter to quarter as seen in the quarterly history ($0.29 to $0.39 in 2025). Not investment advice — consult a qualified adviser for your specific risk circumstances.
Is DIVB suitable for income investors?
DIVB is suitable for investors seeking modest income combined with long-term capital growth, rather than maximum current income. Its yield of approximately 2.87% (September 2026) is higher than the broad S&P 500 but lower than dedicated high-yield alternatives like VYM. The quarterly distribution schedule provides regular income, and the 0.05% expense ratio means almost none of the income is consumed by fees. For investors who need the highest possible current yield from their portfolio, dedicated high-yield dividend ETFs typically offer higher yields at the cost of lower growth and typically less technology exposure. DIVB's design — blending dividend and buyback companies — is more oriented toward total return with an income component than maximum income generation.
Table of Contents
- What DIVB Actually Does: The Index, the Dual Criterion, and Why It Matters
- The Numbers: DIVB’s Yield, Return, and Cost Profile
- The Dividend + Buyback Strategy: What DIVB Is Built For
- A Practical Strategy Framework for DIVB
- DIVB’s Sector Mix: Why Technology at 33% Changes the Income Story
- Comparing DIVB: How It Stacks Up Against VYM, DGRO, and SCHD
- The Quarterly Distribution Schedule: Income Timing and Reinvestment
- Who DIVB Is — and Is Not — Built For
- The Complete DIVB Fact Sheet: Every Key Data Point
- Conclusion: The Shareholder Yield Thesis, Tested
- Frequently Asked Questions
What DIVB Actually Does: The Index, the Dual Criterion, and Why It Matters
Most dividend ETFs do one thing: they find companies that pay dividends. DIVB does something subtly but meaningfully different. It tracks the Morningstar US Dividend and Buyback Index, which selects companies with a history of dividend payments and/or share buybacks. That ‘and/or’ is where DIVB’s identity lives. A pure dividend ETF would exclude Amazon, Apple, or Microsoft from its universe if those companies had not historically paid dividends in the traditional sense. DIVB can include companies that return capital to shareholders primarily through buybacks rather than dividends — broadening the definition of ‘shareholder return’ to total shareholder yield rather than just dividend yield. This matters for the 2025-2026 market context because the composition of the S&P 500 has tilted heavily toward technology companies that have historically preferred buybacks to dividends. By including the buyback dimension, DIVB’s technology sector allocation reached 33.38% as of September 16, 2026 (Robinhood). That is higher than most traditional high-dividend ETFs, which are typically concentrated in financials, utilities, and consumer staples. TradingView identifies the approach explicitly: ‘Prior to October 25, 2022, the fund traded under the name iShares US Dividend and Buyback ETF’ — the name change to ‘Core Dividend’ softened the framing but the underlying strategy remained the same. The result is a fund that looks and behaves somewhat differently from a classic income-oriented dividend ETF, which has important implications for the strategy built around it.DIVB tracks: Morningstar US Dividend and Buyback Index. Selection criterion: history of dividends AND/OR buybacks. Universe: 97% of US free-float market cap (all-cap). Holdings: 385-407 securities (various 2026 dates). Technology: 33.38% of portfolio (Robinhood September 16, 2026). Expense ratio: 0.05% (5 basis points). AUM: ~$2.03B September 2026 (Robinhood).
The Numbers: DIVB's Yield, Return, and Cost Profile
The three numbers that define a dividend ETF investment case are the yield, the total return, and the cost. For DIVB as of the dates cited across 2025-2026 sources: yield has ranged from 2.21% (StockAnalysis June 2026) to 2.87% (Robinhood September 2026), reflecting normal fluctuation with the share price. On a trailing 12-month basis, ETF Central reported a 2.45% distribution yield as of March 2026. The quarterly dividend history from StockAnalysis.com shows the most recent four distributions: $0.29282 (June 2025), $0.33607 (September 2025), $0.38887 (December 2025), and $0.33747 (March 2026). The variation between quarters is normal and reflects the underlying portfolio’s dividend payments. Total return including dividends over the past year was 26.88% as of June 2026 (StockAnalysis.com) — a figure that includes both price appreciation and dividend income. The beta of 0.87 indicates that DIVB has historically moved somewhat less than the broad market, which is typical for value-tilted portfolios. The expense ratio of 0.05% — confirmed across multiple sources including ETFRC — means that on a $10,000 investment, the annual management cost is approximately $5. This is among the lowest expense ratios available for dividend-focused ETFs and is the direct result of being a passive, index-tracking product. On $100,000, the annual cost is approximately $50. Past performance does not guarantee future results. DIVB dividend yield: 2.87% (Robinhood September 2026); 2.45% trailing 12 months (ETF Central March 2026); 2.21% (StockAnalysis June 2026). Quarterly distribution history 2025-2026: $0.29 to $0.39. Total return past year: 26.88% (StockAnalysis June 2026). Beta: 0.87. Expense ratio: 0.05% (~$5 per $10,000 invested/year).The Dividend + Buyback Strategy: What DIVB Is Built For
The investment thesis for DIVB rests on a specific understanding of how modern US companies return value to shareholders. For most of the 20th century, the primary mechanism was the cash dividend: a regular payment from company earnings to shareholders, taxable in the year received. Over the past two decades, the buyback has become a parallel or in some cases dominant mechanism. A company that spends $5 billion buying back its own shares is reducing the share count, theoretically increasing earnings per share, and returning capital to shareholders — but it shows up as zero in a dividend yield calculation. DIVB’s index methodology captures this by measuring shareholder yield rather than dividend yield alone. The ETFRC database notes that DIVB ‘selects its holdings from a diversified universe that represents 97% of US free-float market capitalization’ and that ‘DIVB is one of only a few to emphasize shareholder yield.’ The strategic case for building around this ETF rather than a traditional high-yield dividend fund is threefold. First, the broader universe means less concentration in the traditionally defensive sectors (utilities, real estate, consumer staples) that dominate pure high-yield funds. Second, the technology allocation (33.38% as of September 2026) gives exposure to high-quality large-cap companies that grow earnings and return capital, even if the current yield is modest. Third, the 0.05% expense ratio means the strategy costs almost nothing to maintain over decades. The risk is that a lower dividend yield than pure high-yield alternatives means less income in the near term. DIVB dual criterion: dividends AND/OR buybacks — captures total shareholder yield (ETFRC; StockAnalysis). Universe: 97% US free-float market cap. Technology 33.38% (September 2026) reflects inclusion of buyback-paying tech. Expense ratio 0.05% — near the floor for any equity ETF.A Practical Strategy Framework for DIVB
Building a strategy around DIVB requires clarity about what role it plays in a broader portfolio and what behaviour is expected from it. DIVB is not a high-yield income fund. Its 2.87% yield as of September 2026 is higher than the S&P 500’s typical yield of approximately 1.3%, but lower than dedicated high-yield dividend ETFs like VYM (Vanguard High Dividend Yield ETF, which overlaps approximately 59-64% with DIVB per ETFRC). The appropriate strategic framework depends on the investor’s goal. For the income-growth investor — someone who wants growing income over time rather than maximum current yield — DIVB’s blend of dividend-paying and buyback-paying companies provides exposure to companies with the financial strength to sustain and grow both forms of shareholder return. The 26.88% total return over the past year (including dividends, StockAnalysis June 2026) reflects this total return orientation. For the DCA (Dollar Cost Averaging) investor, the quarterly distribution schedule aligns naturally with a reinvestment or withdrawal cadence. Contributions every month or quarter, with dividends reinvested automatically through a DRIP (Dividend Reinvestment Plan), allow compound growth to accumulate across the fund’s 385-407 holdings without concentration in any single company. For the tax-aware investor in the US: DIVB’s distributions may qualify as qualified dividends, taxed at preferential capital gains rates rather than ordinary income rates, depending on the holding period and underlying dividend sources. Consult a qualified tax adviser. DIVB yield: 2.87% (September 2026) vs S&P 500 ~1.3% typical vs VYM (Vanguard High Dividend Yield) at higher current yield. Total return 26.88% past year (StockAnalysis June 2026). Beta 0.87: somewhat less volatile than the broad market. Quarterly distributions: natural cadence for reinvestment strategy.DIVB’s Sector Mix: Why Technology at 33% Changes the Income Story
Traditional dividend ETFs tend to concentrate in sectors with historically high dividend yields: utilities, real estate investment trusts, financials, consumer staples, energy. These sectors pay reliably, but they are also among the most interest-rate-sensitive. As of September 16, 2026, DIVB’s sector allocation looked quite different: Technology 33.38%, Financial Services 16.15%, Healthcare 14.17%, Consumer Defensive 9.02% (Robinhood). Technology at one-third of the portfolio is the defining characteristic that separates DIVB from most dividend peers. The tech companies inside DIVB are not there because of high dividend yields. They are there because the Morningstar US Dividend and Buyback Index counts buybacks as shareholder return — and large-cap technology companies like Apple, Microsoft, and others run some of the largest buyback programmes in corporate history. This has two direct effects on the strategy. First, it means DIVB behaves more like a large-cap blend or value fund in market drawdowns than a high-yield income fund. The beta of 0.87 is lower than the market at 1.0 but higher than a typical utilities-heavy income fund. Second, it means the income from DIVB grows as technology companies grow their buyback programmes and gradually introduce or increase dividends. The dividend yield on tech as a sector is typically lower than financials or consumer staples, which is why DIVB’s yield (2.87% September 2026) sits below dedicated high-yield alternatives like VYM. DIVB sector allocation September 16, 2026 (Robinhood): Technology 33.38%, Financial Services 16.15%, Healthcare 14.17%, Consumer Defensive 9.02%. Beta: 0.87. Technology exposure is the key differentiator from traditional high-yield dividend ETFs.Comparing DIVB: How It Stacks Up Against VYM, DGRO, and SCHD
The dividend ETF landscape has well-established alternatives to DIVB that serve different parts of the income spectrum. The ETFRC data provides overlap analysis between DIVB and its closest peers, which is the most useful frame for comparison. VYM — Vanguard’s High Dividend Yield ETF — overlaps approximately 59-64% with DIVB (ETFRC May 2026 and December 2025 data). VYM charges 0.06% compared to DIVB’s 0.05%, focuses on high current yield rather than buyback-adjusted yield, and has lower technology exposure. Its yield is typically higher than DIVB’s but its growth characteristics are lower. DGRO — iShares’ own Core Dividend Growth ETF — overlaps approximately 49-50% with DIVB and charges 0.08%. DGRO focuses on dividend growth (companies with a consistent record of increasing dividends) rather than shareholder yield, which tends toward higher quality but also lower current yield. SPDG — State Street’s SPDR Portfolio S&P Sector Neutral Dividend ETF — overlaps approximately 53-56% with DIVB and charges the same 0 bp versus DIVB (ETFRC). The comparison reveals DIVB’s position: lower current yield than VYM, higher tech exposure than most dividend ETFs, and a shareholder yield focus that is genuinely different from growth-rate-focused alternatives like DGRO. It is not the highest-yielding option, the fastest-growing dividend option, or the most defensive option. It is the broadest total-shareholder-yield option at the lowest expense ratio. Peer comparison: VYM overlaps 59-64% with DIVB (ETFRC); expense ratio 0.06% vs DIVB 0.05%; higher current yield, lower tech exposure. DGRO overlaps 49-50%; expense ratio 0.08%; dividend growth focus. SPDG overlaps 53-56%. DIVB's 87th percentile ALTAR Score (ETFRC December 2025).The Quarterly Distribution Schedule: Income Timing and Reinvestment
DIVB distributes dividends on a quarterly schedule. The StockAnalysis.com data provides the most complete recent distribution history: $0.31039 (March 2025), $0.29282 (June 2025), $0.33607 (September 2025), $0.38887 (December 2025), and $0.33747 (March 2026). The variation between quarters — from a low of $0.29 to a high of $0.39 across this five-quarter period — is normal and reflects the timing of dividend payments from the underlying holdings, not a signal of fund quality changes. The quarterly cadence creates four natural decision points per year for income investors: whether to reinvest dividends through a DRIP, withdraw them as income, or direct them to another allocation. For investors using DIVB as a core income component within a retirement portfolio, the quarterly schedule aligns with the typical withdrawal cadence of a regular income drawdown. For investors in accumulation mode, automatic reinvestment (where available through a broker’s DRIP service) compounds the position without requiring active decisions. The trailing 12-month dividend total from the four most recent distributions ($0.29282 + $0.33607 + $0.38887 + $0.33747 = approximately $1.355) applied to the September 2026 share price of approximately $66.92 produces an approximate trailing yield of 2.02% to 2.87% depending on the exact calculation period, consistent with the range across sources.DIVB quarterly distribution history (StockAnalysis.com): Mar 2025 $0.31039; Jun 2025 $0.29282; Sep 2025 $0.33607; Dec 2025 $0.38887; Mar 2026 $0.33747. Trailing 12-month sum ~$1.355. Quarterly ex-dividend dates. DRIP reinvestment available through most major brokers.
Who DIVB Is — and Is Not — Built For
The clearest framework for understanding whether DIVB belongs in a portfolio is to identify who it actually serves, and who it does not. DIVB suits an investor who wants broad US equity exposure with a modest income component, a very low expense ratio, and higher tech exposure than typical dividend funds provide. It suits investors who believe in the shareholder yield thesis — that companies returning capital through buybacks are doing something economically equivalent to dividends even if the current yield metric looks different. It suits long-term accumulators who want quarterly distributions to reinvest, benefiting from dollar-cost averaging across 385-407 holdings. It is not well-suited to investors who need maximum current income from their investments, as dedicated high-yield alternatives like VYM typically offer a higher yield. It is not designed for investors who specifically want to avoid technology concentration — at 33.38% of the portfolio as of September 2026, that exposure is not incidental. It is not a bond substitute or a capital-preservation vehicle: it carries equity risk, as illustrated by the 52-week range of $50.58 to $69.82 (Robinhood September 2026). The Morningstar category is Large Value. The beta of 0.87 is lower than the broad market but not low. In a significant equity market drawdown, DIVB would be expected to decline — less than the broad market on average, but decline nonetheless.DIVB suits: broad US equity + modest income + very low cost + tech exposure + shareholder yield thesis. Does NOT suit: maximum income seekers; tech-avoidance requirements; bond substitute/capital preservation. 52-week range: $50.58-$69.82 (Robinhood Sep 2026) — illustrates equity risk.
The Complete DIVB Fact Sheet: Every Key Data Point
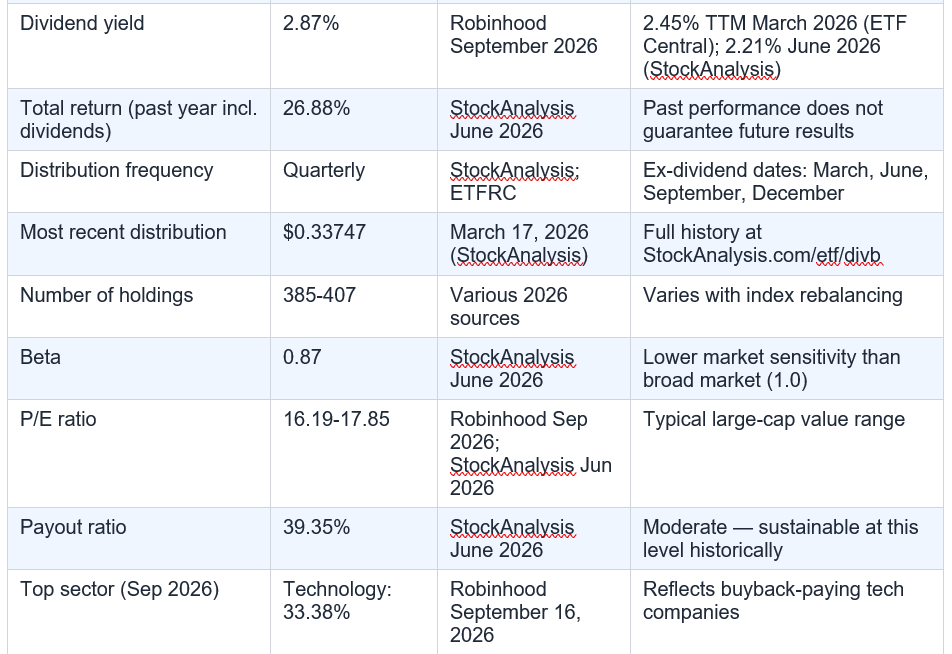
StockAnalysis.com June 2026; Robinhood September 2026; ETF Central March 2026; ETFRC May 2026; TradingView/Wisesheets October 2025; BlackRock iShares official page. All data subject to change. Verify current data at iShares.com. Not investment advice.
Conclusion
DIVB is not the right fund for every dividend investor. It is not the highest-yielding option. It is not the most defensively positioned. It is not a substitute for a bond allocation or a cash-equivalent. What it is, precisely, is a low-cost passive implementation of the shareholder yield thesis — the idea that dividends and buybacks together define how a company returns value to its owners, and that a fund capturing both is a more complete picture of that return than one capturing only dividends. The 0.05% expense ratio is the strongest single argument for DIVB as a long-term holding. At $5 per $10,000 per year, the fee is effectively negligible over a multi-decade investment horizon. The total return of 26.88% over the past year including dividends (StockAnalysis June 2026) reflects the combined contribution of price appreciation and income, which is ultimately the only number that matters for a total-return investor. The quarterly distribution schedule, the 385-407 diversified holdings, and the 33.38% technology allocation all reflect a fund that looks different from the dividend ETF category’s historical centre of gravity — and that difference is increasingly aligned with where corporate America’s capital return strategies actually sit in 2026. Not financial, investment, or tax advice. Always consult a qualified, regulated adviser before making investment decisions. Past performance does not guarantee future results.Frequently Asked Questions
What is DIVB and what index does it track?DIVB is the iShares Core Dividend ETF, issued by BlackRock. It was formerly named the iShares US Dividend and Buyback ETF until October 25, 2022. It tracks the Morningstar US Dividend and Buyback Index, which selects US stocks with a history of dividend payments and/or share buybacks. The fund was launched on November 7, 2017 and trades on the Cboe BZX exchange. As of September 2026, it holds approximately 385-407 securities, has AUM of approximately $2.03 billion, and carries an expense ratio of 0.05%. Sources: StockAnalysis.com June 2026; Robinhood September 2026; BlackRock/iShares official page.
What is DIVB's current dividend yield?
DIVB's dividend yield has ranged between approximately 2.21% and 2.87% across different dates and sources in 2026. ETF Central reported a trailing 12-month distribution yield of 2.45% as of March 11, 2026. Robinhood reported 2.87% as of September 18, 2026. StockAnalysis.com reported 2.21% on June 11, 2026. The variation reflects normal price movement — yield rises when the price falls and falls when the price rises. The fund distributes quarterly. Sources: ETF Central March 2026; Robinhood September 2026; StockAnalysis.com June 2026. Not investment advice. Always verify current yield at iShares.com or your broker.
How does DIVB differ from VYM or DGRO?
DIVB (iShares Core Dividend ETF), VYM (Vanguard High Dividend Yield Index ETF), and DGRO (iShares Core Dividend Growth ETF) are three different expressions of dividend investing. VYM overlaps approximately 59-64% with DIVB (ETFRC data), charges 0.06% (vs DIVB's 0.05%), focuses on high current yield, and has lower technology exposure. DGRO overlaps approximately 49-50% with DIVB, charges 0.08%, and focuses on companies with growing dividends rather than current yield or shareholder yield. DIVB's key differentiator is its inclusion of buyback-paying companies alongside dividend payers, which produces a higher technology allocation (33.38% as of September 2026) and a total shareholder yield orientation rather than a dividend-only focus. Sources: ETFRC May 2026 and December 2025 overlap data.
What are the main risks of investing in DIVB?
DIVB is an equity ETF and carries standard equity market risk: the value of the fund can fall as well as rise. As illustrated by the 52-week range of $50.58 to $69.82 (Robinhood September 2026), the price has experienced significant movement over the past year. The beta of 0.87 (StockAnalysis June 2026) suggests slightly lower volatility than the broad market, but this is a general tendency rather than a guarantee. Concentration risk in technology (33.38% as of September 2026) means that a significant technology sector drawdown would disproportionately affect DIVB versus a more balanced sector allocation. Dividend income is not guaranteed — distributions can vary quarter to quarter as seen in the quarterly history ($0.29 to $0.39 in 2025). Not investment advice — consult a qualified adviser for your specific risk circumstances.
Is DIVB suitable for income investors?
DIVB is suitable for investors seeking modest income combined with long-term capital growth, rather than maximum current income. Its yield of approximately 2.87% (September 2026) is higher than the broad S&P 500 but lower than dedicated high-yield alternatives like VYM. The quarterly distribution schedule provides regular income, and the 0.05% expense ratio means almost none of the income is consumed by fees. For investors who need the highest possible current yield from their portfolio, dedicated high-yield dividend ETFs typically offer higher yields at the cost of lower growth and typically less technology exposure. DIVB's design — blending dividend and buyback companies — is more oriented toward total return with an income component than maximum income generation.
0 Comments
Be the first to share your thoughts on this article.