

Finance
The Inflation Trap Costing Families Thousands Every Year Now

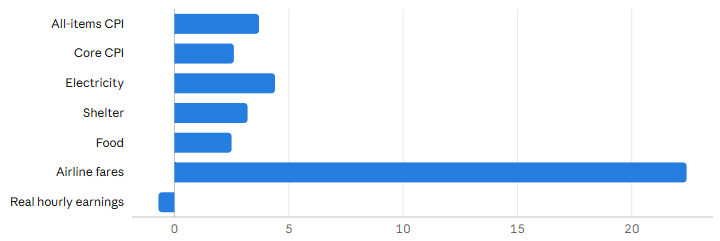
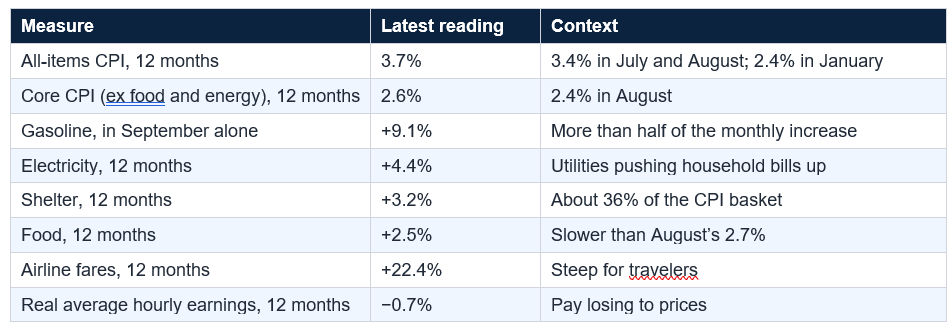
September 2026 CPI: +0.6% for the month, +3.7% over 12 months (3.4% in July and August; forecast 3.6%). Core CPI +2.6% (2.4% in August). Gasoline +9.1% in one month, over half the monthly increase; energy +5.2%. 12-month changes: electricity +4.4%, shelter +3.2%, food +2.5%, airline fares +22.4%. Real average hourly earnings −0.7% over the year (−0.5% in September); real weekly earnings −0.1%. Annual average inflation: 4.7% (2021), 8.0% (2022), 4.1% (2023), 3.0% (2024), 2.7% (2025): about 24.5% cumulative (author’s arithmetic). Made-up family budget of $6,630 a month: the same purchases cost about $235 a month, or roughly $2,825 a year, more than a year ago (author’s illustration). ash: average savings 0.38% (FDIC) vs best savings 4.34%–4.50%, 52-week T-bill 4.46%. Real return: −3.2% at 0.38%; about +0.6% to +0.7% at the top rates. Social Security COLA for 2027: 3.6%.
You have probably felt it at the pump first. Then at the grocery store, where the total keeps landing a little higher than you planned. Then in the renewal notice from your insurer, the electricity bill, the restaurant check. No single price change feels like a catastrophe. But somewhere between the first and the fifth, you notice that the same paycheck covers less of the month than it used to.
That feeling has a name, and it has numbers behind it. Inflation is the trap that closes slowly: prices rise, pay lags, and the money you set aside earns too little to keep up. In September 2026 all three were happening at once. This post puts real figures on it, shows what it can cost a family in a year, and lays out how to push back.
The more worrying detail is what happened beneath the headline. Core inflation, which strips out volatile food and energy, rose 0.3% for the second month in a row and reached 2.6% over twelve months, up from 2.4% in August. Reuters reported that the broadening of price pressures beyond energy raised concerns among economists that underlying inflation could be getting sticky. Shelter rose 0.4% in the month and 3.2% over the year.
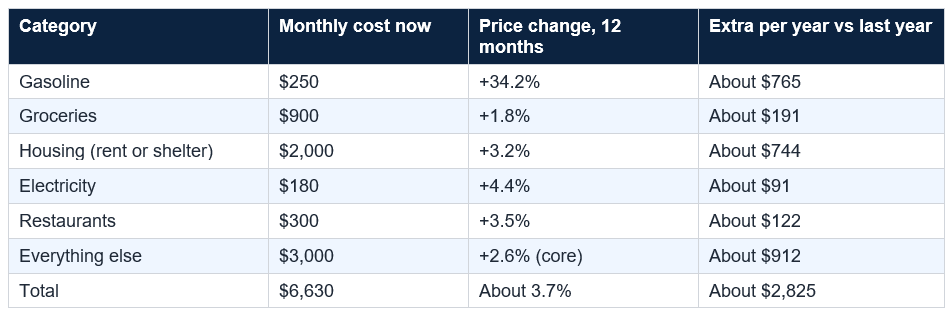
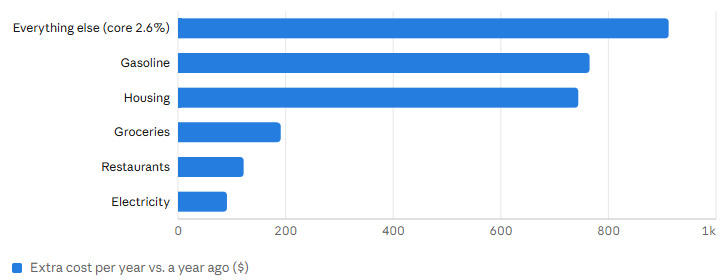
The result: the same purchases cost roughly $235 a month, or about $2,825 a year, more than they did twelve months earlier. Gasoline and housing alone account for most of it. Your own number depends on what you buy. A family that drives a lot, rents in a rising market or buys airline tickets will feel more. One that spends mainly on groceries may feel less, since food has been rising more slowly.
The numbers: Illustrative family budget of $6,630 a month: about $235 more per month, roughly $2,825 a year, for the same purchases. Gasoline about $765, housing about $744, everything else about $912. A made-up example, not a statistic.
Here is the part people miss. When inflation slows, prices do not fall. A drop from 8% to 3% only means they rise more slowly. So even a calmer year leaves you paying the higher level. That is why the trap feels so inescapable: relief means slower increases, not lower prices.
The Federal Reserve is watching too. It raised its target range to 3.75%–4.00% in September, and Reuters reported that another hike was back on the table after the September inflation data. A Fed hike can help cool prices over time, but it also raises borrowing costs for families with variable-rate debt. That is one more reason to pay attention to what kind of loans you carry.
Two dates are worth marking. The Federal Reserve meets October 27–28, where the September data will shape the debate over another hike, and the next Consumer Price Index report arrives on November 10. If gasoline prices ease, headline inflation could cool, but a core reading that keeps edging up would suggest the pressure is spreading. Either way, your household budget feels the result well before the commentary settles, which is why acting on the parts you control matters more than predicting the next number.
Retirees face a similar math problem. Social Security benefits rise by 3.6% in 2027, about $75 a month on average, according to ABC News. That is a welcome raise, but it is just below the 3.7% inflation rate in September. The adjustment is meant to keep up with prices, not to get ahead of them.
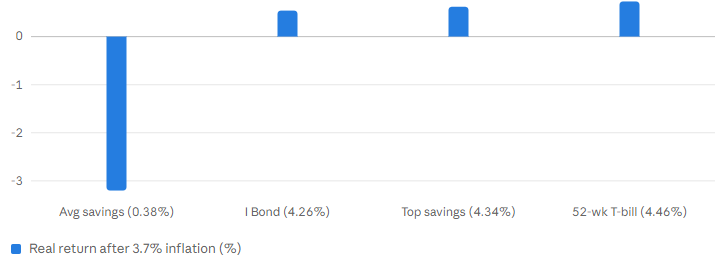
The fix is available. MyMoneyBlog’s October 12 survey found savings accounts at 4.34% to 4.50%, a 52-week Treasury bill at 4.46% and I Bonds at 4.26% for the first six months. After 3.7% inflation, those are real returns of about +0.5% to +0.7%. They are thin, but positive, and they are insured or government-backed. A family that moves its cash from 0.38% to 4.34% stops that leak.

Third, put idle cash to work, keeping an emergency fund in an insured account at a competitive rate. Fourth, be careful with variable-rate debt, and prioritize paying down balances that carry the highest interest. Fifth, work on income: if real wages are slipping, ask for a raise or look for roles that pay more, and bring evidence of your market value. Sixth, for money you will not need for many years, diversified investments have historically outpaced inflation, though with risk. Finally, check in after each monthly report. The next CPI release is November 10.
Even the best savings rates barely outpace inflation. Cash protects your principal and roughly holds its buying power. It is not designed to grow your wealth. Long-term goals need long-term investments.
The encouraging news is that several levers are in your hands. You can find where your own costs are rising, put cash where it earns more, avoid variable-rate debt, negotiate bills and aim for income that outpaces prices. None of that makes inflation disappear. But it moves you from being trapped by it to managing it. This is general education, not personalized advice, and a qualified adviser can help with your situation.
It is the squeeze that happens when prices rise faster than your income and faster than the interest on your savings. In September 2026, inflation was 3.7%, real hourly earnings were down 0.7% over the year, and the average savings account paid about 0.38%. Each pushes your purchasing power down.
How much does inflation cost a typical family?
It depends on what you spend and where you live. In the made-up family budget in this article, $6,630 a month of purchases cost about $235 more per month, roughly $2,800 a year, than the same purchases a year earlier. Your own number will differ. Housing and fuel were the biggest drivers in that example.
What is core inflation and why does it matter?
Core inflation excludes food and energy, which swing a lot, and shows underlying price pressure. It was 2.6% over the year in September, up from 2.4% in August. Economists watch it because a rising core can mean inflation is becoming harder to reverse, and it influences Federal Reserve decisions.
Do savings accounts beat inflation right now?
The best ones barely do. The top savings rate was about 4.34% to 4.50% and the 52-week Treasury bill about 4.46% in mid-October, versus inflation of 3.7%, a real return of about 0.6% to 0.7%. The average savings account, at 0.38%, loses roughly 3.2% of purchasing power a year.
Will inflation keep rising?
No one knows. September’s figure of 3.7% was up from 3.4% in July and August and above forecasts, driven by a 9.1% jump in gasoline prices in a single month. The next CPI report is due November 10, 2026. Plan for a range of outcomes rather than a forecast.
Table of Contents
- The Squeeze You Feel but Cannot Quite Name
- The Short Answer
- September’s Numbers: What the Latest Report Shows
- A Family Budget, Priced Out
- The Cumulative Damage: Five Years of Price Increases
- Jaw One: Prices That Will Not Settle
- Jaw Two: Paychecks That Lag
- Jaw Three: Savings Standing Still
- Other Places the Trap Hides
- How to Push Back, Step by Step
- Mistakes That Make It Worse
- Conclusion
- Frequently Asked Questions
September 2026: what rose, and what pay did (12-month change, %)
12-month change (%) by BLS data as reported Oct 14, 2026
Illustrative family budget ($6,630/month): extra cost per year by category ($)
Extra $ per year by Made-up budget; total about $2,825 a year
Savings vs. inflation: real return on cash (%, inflation 3.7%)
Real return (%) by Where the cash sits (nominal rate)
The Squeeze You Feel but Cannot Quite Name
You have probably felt it at the pump first. Then at the grocery store, where the total keeps landing a little higher than you planned. Then in the renewal notice from your insurer, the electricity bill, the restaurant check. No single price change feels like a catastrophe. But somewhere between the first and the fifth, you notice that the same paycheck covers less of the month than it used to.That feeling has a name, and it has numbers behind it. Inflation is the trap that closes slowly: prices rise, pay lags, and the money you set aside earns too little to keep up. In September 2026 all three were happening at once. This post puts real figures on it, shows what it can cost a family in a year, and lays out how to push back.
The Short Answer
The inflation trap is a three-sided squeeze. Prices are rising faster, with consumer prices up 3.7% over the past twelve months. Paychecks are not keeping up, with real hourly earnings down 0.7% over the year. And cash savings are often earning almost nothing, with the national average savings rate around 0.38%. Together they can cost a typical household thousands of dollars a year in lost buying power, even though nothing on your statement says so.September’s Numbers: What the Latest Report Shows
The Labor Department’s report, released October 14, 2026, showed consumer prices rising 0.6% in September, and 3.7% over the past twelve months, up from 3.4% in July and August and above the 3.6% that forecasters expected. The main culprit was fuel. Gasoline jumped 9.1% in a single month and accounted for more than half of the monthly increase, while the broader energy index climbed 5.2%.The more worrying detail is what happened beneath the headline. Core inflation, which strips out volatile food and energy, rose 0.3% for the second month in a row and reached 2.6% over twelve months, up from 2.4% in August. Reuters reported that the broadening of price pressures beyond energy raised concerns among economists that underlying inflation could be getting sticky. Shelter rose 0.4% in the month and 3.2% over the year.
A Family Budget, Priced Out
Percentages are abstract, so here is a made-up budget. Imagine a family spending $6,630 a month: $250 on gasoline, $900 on groceries, $2,000 on housing, $180 on electricity, $300 on restaurants and $3,000 on everything else. I applied the latest twelve-month price changes to each category, using the core rate of 2.6% for the rest, and worked out what the same purchases would have cost a year earlier.The result: the same purchases cost roughly $235 a month, or about $2,825 a year, more than they did twelve months earlier. Gasoline and housing alone account for most of it. Your own number depends on what you buy. A family that drives a lot, rents in a rising market or buys airline tickets will feel more. One that spends mainly on groceries may feel less, since food has been rising more slowly.
The numbers: Illustrative family budget of $6,630 a month: about $235 more per month, roughly $2,825 a year, for the same purchases. Gasoline about $765, housing about $744, everything else about $912. A made-up example, not a statistic.
The Cumulative Damage: Five Years of Price Increases
One year of 3.7% is only part of the story, because price increases stack. Annual average inflation was 4.7% in 2021, 8.0% in 2022, 4.1% in 2023, 3.0% in 2024 and 2.7% in 2025, according to figures compiled by Finder. Compounding those five years, which is my own arithmetic, a basket of goods that cost $100 before 2021 costs roughly $125 now, before counting any 2026 increase. That is a permanent step up in the cost of living.Here is the part people miss. When inflation slows, prices do not fall. A drop from 8% to 3% only means they rise more slowly. So even a calmer year leaves you paying the higher level. That is why the trap feels so inescapable: relief means slower increases, not lower prices.
Jaw One: Prices That Will Not Settle
The reason economists are nervous is the breadth. When one thing, such as gasoline, spikes, it can reverse. When shelter, services and airfares all keep climbing, the pressure lasts longer. Airline fares have risen 22.4% in a year, according to First Trust. Electricity is up 4.4%. Housing, the single largest part of the CPI basket at about 36%, is still rising at 3.2%.The Federal Reserve is watching too. It raised its target range to 3.75%–4.00% in September, and Reuters reported that another hike was back on the table after the September inflation data. A Fed hike can help cool prices over time, but it also raises borrowing costs for families with variable-rate debt. That is one more reason to pay attention to what kind of loans you carry.
Two dates are worth marking. The Federal Reserve meets October 27–28, where the September data will shape the debate over another hike, and the next Consumer Price Index report arrives on November 10. If gasoline prices ease, headline inflation could cool, but a core reading that keeps edging up would suggest the pressure is spreading. Either way, your household budget feels the result well before the commentary settles, which is why acting on the parts you control matters more than predicting the next number.
Jaw Two: Paychecks That Lag
A price increase hurts less if your income rises at least as fast. Right now it is not. Real average hourly earnings, which adjust pay for inflation, fell 0.5% in September and are down 0.7% over the past twelve months, according to First Trust. Real weekly earnings are down 0.1%. In plain terms, a worker earning $60,000 has lost about $420 of purchasing power over the year, on my arithmetic, even if the nominal paycheck did not shrink.Retirees face a similar math problem. Social Security benefits rise by 3.6% in 2027, about $75 a month on average, according to ABC News. That is a welcome raise, but it is just below the 3.7% inflation rate in September. The adjustment is meant to keep up with prices, not to get ahead of them.
Jaw Three: Savings Standing Still
Savings are the third jaw, and the one most within your control. The FDIC’s national average savings rate was 0.38% in mid-2026, according to Experian. At 3.7% inflation, that is a real return of about negative 3.2% a year. Keep $20,000 there for a year, and you lose around $640 of purchasing power, even though the balance has grown by $76.The fix is available. MyMoneyBlog’s October 12 survey found savings accounts at 4.34% to 4.50%, a 52-week Treasury bill at 4.46% and I Bonds at 4.26% for the first six months. After 3.7% inflation, those are real returns of about +0.5% to +0.7%. They are thin, but positive, and they are insured or government-backed. A family that moves its cash from 0.38% to 4.34% stops that leak.
Other Places the Trap Hides
Watch for the quieter versions. Variable-rate debt, such as credit cards and some loans, gets more expensive when the Fed hikes. Fixed payments, such as a long-term lease or a fixed income, lose real value as prices rise. Subscriptions and insurance renewals often creep up without drawing attention. And cash held in checking at 0.07%, the national average for interest checking, may be the quietest leak of all, particularly when account fees apply.How to Push Back, Step by Step
First, measure your own inflation. List your five biggest monthly costs, compare them with a year ago and see where your personal rate is highest. Second, attack the big ones. For housing, ask about renewal terms before accepting an increase. For insurance, get competing quotes at each renewal. For gasoline, plan trips and compare prices. For electricity, check whether you can switch plans or reduce peak-hour use.Third, put idle cash to work, keeping an emergency fund in an insured account at a competitive rate. Fourth, be careful with variable-rate debt, and prioritize paying down balances that carry the highest interest. Fifth, work on income: if real wages are slipping, ask for a raise or look for roles that pay more, and bring evidence of your market value. Sixth, for money you will not need for many years, diversified investments have historically outpaced inflation, though with risk. Finally, check in after each monthly report. The next CPI release is November 10.
Mistakes That Make It Worse
The first mistake is waiting for prices to fall. They usually do not; they just rise more slowly. The second is leaving all your cash in checking or a low-rate savings account because it feels safe. The third is panic-buying or panic-selling investments because of an inflation headline. The fourth is cutting the wrong things, such as health or insurance coverage, to save a little now at a large potential cost. And the fifth is ignoring fees, which compound the problem.Even the best savings rates barely outpace inflation. Cash protects your principal and roughly holds its buying power. It is not designed to grow your wealth. Long-term goals need long-term investments.
Conclusion
The inflation trap is not one big event. It is a thousand small ones that add up: 9.1% more at the pump in a single month, shelter up 3.2%, electricity up 4.4%, real wages down 0.7% and a savings account paying 0.38%. In a made-up but realistic family budget, that can mean around $2,800 a year more for the same life, and permanently higher prices even when inflation slows.The encouraging news is that several levers are in your hands. You can find where your own costs are rising, put cash where it earns more, avoid variable-rate debt, negotiate bills and aim for income that outpaces prices. None of that makes inflation disappear. But it moves you from being trapped by it to managing it. This is general education, not personalized advice, and a qualified adviser can help with your situation.
Frequently Asked Questions
What is the inflation trap?It is the squeeze that happens when prices rise faster than your income and faster than the interest on your savings. In September 2026, inflation was 3.7%, real hourly earnings were down 0.7% over the year, and the average savings account paid about 0.38%. Each pushes your purchasing power down.
How much does inflation cost a typical family?
It depends on what you spend and where you live. In the made-up family budget in this article, $6,630 a month of purchases cost about $235 more per month, roughly $2,800 a year, than the same purchases a year earlier. Your own number will differ. Housing and fuel were the biggest drivers in that example.
What is core inflation and why does it matter?
Core inflation excludes food and energy, which swing a lot, and shows underlying price pressure. It was 2.6% over the year in September, up from 2.4% in August. Economists watch it because a rising core can mean inflation is becoming harder to reverse, and it influences Federal Reserve decisions.
Do savings accounts beat inflation right now?
The best ones barely do. The top savings rate was about 4.34% to 4.50% and the 52-week Treasury bill about 4.46% in mid-October, versus inflation of 3.7%, a real return of about 0.6% to 0.7%. The average savings account, at 0.38%, loses roughly 3.2% of purchasing power a year.
Will inflation keep rising?
No one knows. September’s figure of 3.7% was up from 3.4% in July and August and above forecasts, driven by a 9.1% jump in gasoline prices in a single month. The next CPI report is due November 10, 2026. Plan for a range of outcomes rather than a forecast.
0 Comments
Be the first to share your thoughts on this article.