

Investing
Top 10 Stocks to Buy Now: Analyst Favorites and Their Risks!

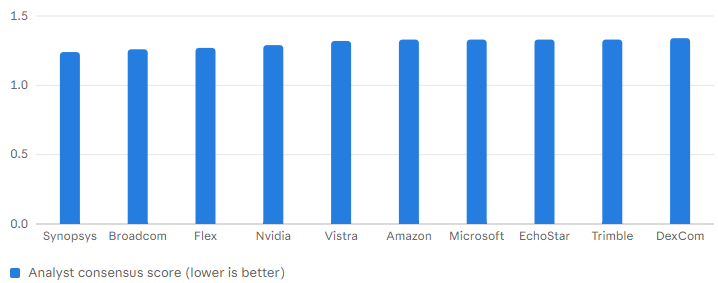
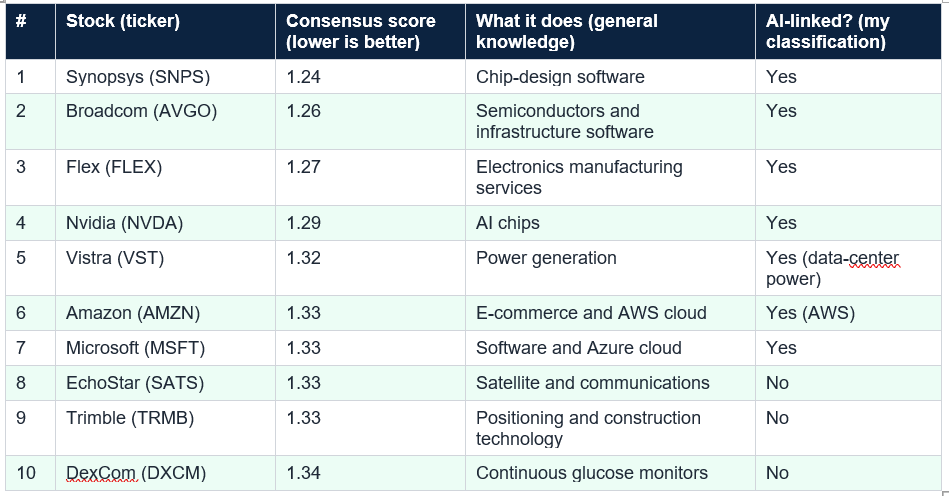
Analyst consensus (S&P Global Market Intelligence, October): 59 S&P 500 stocks score Strong Buy and one a consensus Sell; best scores (lower is better): Synopsys 1.24, Broadcom 1.26, Flex 1.27, Nvidia 1.29, Vistra 1.32, Amazon, Microsoft, EchoStar and Trimble 1.33, DexCom 1.34. Targets and valuations (various dates, early November): Nvidia closed near $200 with a consensus target of $327 (about 63% upside) and a forward P/E of 17.1x, with earnings due November 17; Broadcom target about $527–$530 (about 62%–64%) at 19.1x; Microsoft 25.1x; Amazon 25.3x; the Shiller CAPE is above 41. My arithmetic: seven of the ten are tied to AI in my classification; if those seven fell 40% and the other three rose 10%, an equal-weight portfolio would lose about 25%; SPY’s 11% a year turns $1,000 into about $8,060 in 20 years, so a 4x edge would need roughly 18%–19% a year.
What is knowable is what Wall Street analysts think. The S&P 500 with S&P Global Market Intelligence data that ranks stocks by analyst consensus, and this article walks through the ten with the strongest scores, with the price targets and valuations that go with them and, just as important, the risks. Think of it as a map of where professional opinion is concentrated, not a set of instructions.
I took the ten best scores, so the selection is mechanical rather than my judgment. I then added price targets and valuation measures from several outlets. Those come from different dates and providers, and they conflict in places: Flex’s implied upside is 87% in one source and 128% in another, and Nvidia’s price appears at $200 in one article and $218 in another. I attribute each figure and treat them as indications. A consensus score tells you what analysts think. It does not tell you what the price already assumes.
Next, the cloud giants. Microsoft scores 1.33; Argus has a buy rating and a $620 target against a $521.08 close on October 22, an implied 19%, and it trades near 25.1 times forward earnings. It was pressured early in 2026 by concerns that AI could disrupt software, according to Argus. Amazon scores 1.33 and trades near 25.3 times forward earnings, but it just reported $77.3 billion of quarterly capex and negative free cash flow, even with AWS growing 39%. Alphabet, at 1.38, just misses the ten and fell 12% on October 29 after reporting its own capex surge. The cloud trade is a bet that today’s spending becomes tomorrow’s profit.
The rest are less AI-centered. Vistra, at 1.32, is a power producer that analysts like partly for the electricity demand of data centers, in my understanding, which makes it AI-adjacent. EchoStar at 1.33 is a satellite and communications company, Trimble at 1.33 makes positioning technology for construction and other industries and DexCom at 1.34 makes glucose monitors, with Argus seeing about 23% implied upside. I retrieved little detail on these four, so you would need to research each before buying. That a stock appears on a list is a reason to look, not a reason to buy.
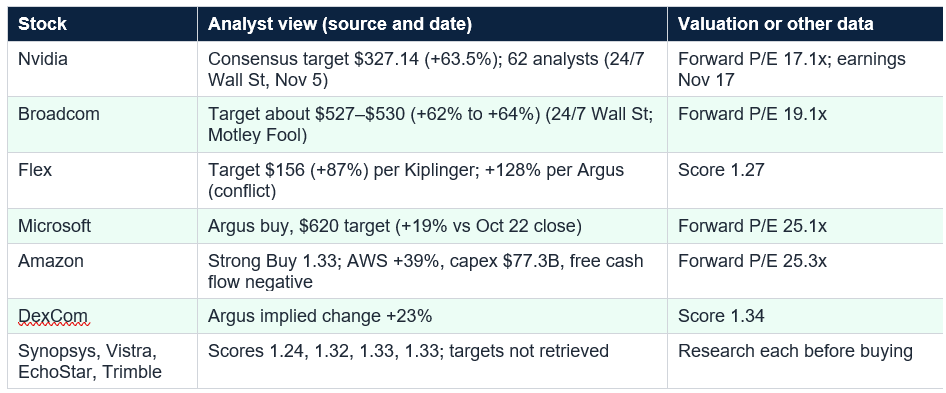
S&P Global MI (October): 59 Strong Buy S&P 500 stocks, one consensus Sell. Top scores: Synopsys 1.24, Broadcom 1.26, Flex 1.27, Nvidia 1.29, Vistra 1.32, Amazon/Microsoft/EchoStar/Trimble 1.33, DexCom 1.34. Nvidia: $200.13 close, $327.14 consensus target (+63.5%), forward P/E 17.1x, earnings November 17.
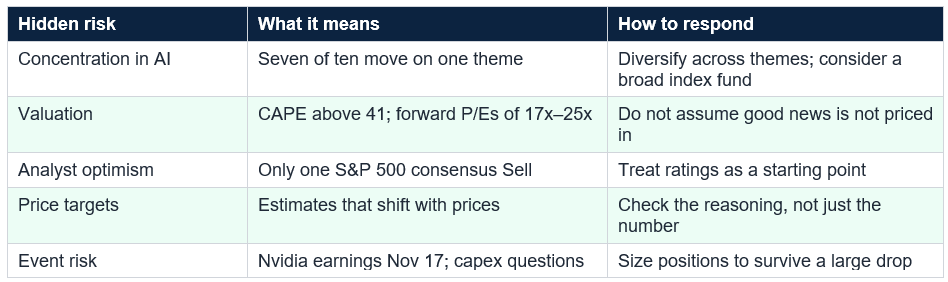
The second is valuation. The Shiller CAPE recently rose above 41, its highest since the dot-com era, according to US News, so even stocks analysts love can be expensive. Forward P/E ratios range from about 17 for Nvidia to 25 for Microsoft and Amazon, which are not extreme but leave little room for error. The third is the nature of price targets: they are one-year estimates that assume things go right, and they change when prices move. A target implying 63% upside tells you how optimistic the analysts are, not how likely the outcome is.
Such claims can still be technically true, because they depend on choices: which picks are counted, what dates are used, whether returns are averaged across recommendations rather than measured for an actual portfolio, whether losing picks are dropped and whether subscribers actually bought at the same prices. I cannot verify any service’s claim, and I am not endorsing one. If you consider a paid service, ask how the track record is calculated, whether it is audited and what it would have meant for an investor who followed every recommendation in order. Past performance does not guarantee future results.
Then decide how it fits your portfolio. For most people, a broad low-cost index fund is the core, and individual stocks are a small slice. Hendrik Bessembinder found the best 4.3% of stocks created all the market’s net wealth, which means picking the winners is hard, and a fund captures them without choosing. If you do buy individual stocks, build positions gradually rather than all at once, particularly around events such as Nvidia’s November 17 earnings, and keep an emergency fund so you are never forced to sell at a bad time.
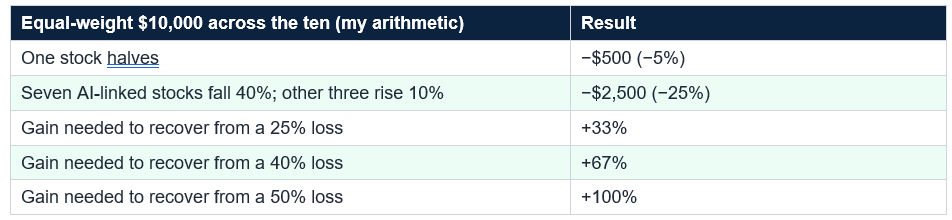
The lesson is that the number of stocks matters less than how different they are. Ten stocks in one theme behave like one big stock. A more resilient approach would spread across sectors and asset types, keep individual stocks to a small share of your investments and use an index fund for the rest. This is general education, not advice, and the right size for you depends on your goals and nerves. If you would panic at a 25% drop, own less of these, whatever the analysts say.
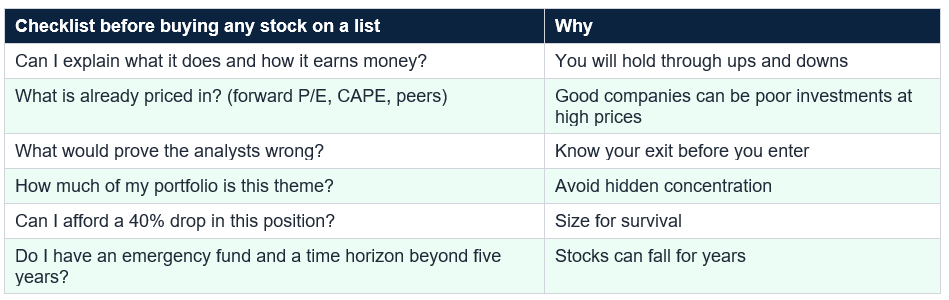
Analysts can be wrong, and a Strong Buy rating is not a guarantee. Treat the list as a place to start research, not a reason to buy, and never invest money you may need within five years.
Common mistakes include buying a stock because it appears on a list, confusing analyst enthusiasm with value, putting too much money in one theme, ignoring valuation, chasing a stock after a big run, buying all at once before a major earnings report, trusting performance claims you cannot verify and investing money you will need soon. Another is forgetting that many investors underperform the index: DALBAR found the average investor earned 6.8% a year over 30 years against 10.2% for the S&P 500, largely because of badly timed trades.
So treat this as a research list, not a recommendation. Understand each business, check what is priced in, size positions so a 25% to 40% loss would not hurt and keep a broad index fund as your core. And be skeptical of any promise to beat the market by a multiple: in my arithmetic a 4x edge over SPY would take roughly 18% to 19% a year for 20 years. Nvidia’s November 17 earnings will be the next big test. This is general education, not personalized investment advice, and a qualified adviser can help you decide.
They are the ten S&P 500 stocks with the best analyst consensus scores in a using S&P Global Market Intelligence data, as of October. That is a measure of what analysts think, not a prediction or a recommendation from me. Analyst ratings can be wrong, are usually optimistic and can change quickly, and the stocks may already reflect good news in their prices.
What does a Strong Buy consensus mean?
It means analysts, on average, rate the stock close to the top of the scale. In Erneroy’s screen, a lower score is better, and 59 S&P 500 stocks scored as Strong Buy, while only one carried a consensus Sell. The score summarizes opinions from many analysts, and it says nothing about how much of the good news is already priced in.
Why are so many of the ten linked to AI?
Because analysts are bullish on companies tied to the AI buildout, and several of these names sell chips, design software, electronics manufacturing or cloud capacity. In my own classification, seven of the ten have a meaningful AI link. That concentration is a risk: if AI spending disappoints, many of them could fall together, as the late-October selloff showed.
Should I buy all ten?
Not necessarily. Buying all ten is not diversification if most depend on the same theme. A broad index fund spreads risk across the market, and 79% of active large-cap funds trailed the S&P 500 in 2025. If you do pick individual stocks, size each position so a large loss would not derail your plan. This is general education, not personal advice.
Can a stock-picking method really beat the market by 4x?
Be skeptical. In my arithmetic, SPY’s roughly 11% a year over 20 years turned $1,000 into about $8,060, so beating that by 4x would take roughly 18% to 19% a year for 20 years. Such claims often depend on how returns are measured, which picks and dates are chosen and survivorship. I cannot verify any particular service’s claim, and past performance does not guarantee future results.
Table of Contents
- The Fine Print Behind “Top 10 Stocks”
- The Short Answer: The List
- How This List Was Built
- The Ten, One by One
- What the Numbers Hide
- A Word About “Beat the Market by 4x” Claims
- How to Use a List Like This
- Position Sizing: A Simple Illustration
- Common Mistakes
- Conclusion
- Frequently Asked Questions
The ten S&P 500 stocks with the best analyst consensus scores (lower is better)
Consensus score (1 = Strong Buy) by Erneroy screen using S&P Global Market Intelligence data (October 2026); 59 S&P 500 stocks score Strong Buy and one a consensus Sell; consensus is opinion, not performance
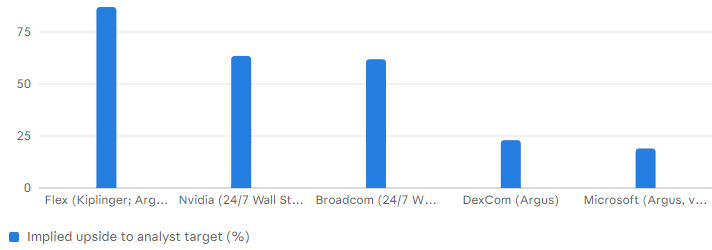
What analyst price targets imply: reported upside for five of the ten (%)
Implied upside (%) by Different sources and dates; targets are optimistic one-year estimates, not forecasts; targets for the other five were not retrieved
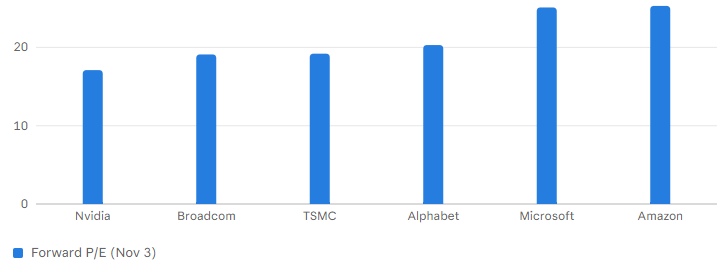
What you pay for the growth: forward P/E ratios of six analyst favorites (Nov 3)
Forward P/E (times) by EBC (secondary source), November 3, 2026; the Shiller CAPE for the S&P 500 is above 41; valuations move daily
The Fine Print Behind “Top 10 Stocks”
Every few weeks, someone publishes a list of the best stocks to buy now, often with a promise that the method behind it has beaten the market by a wide margin for decades. It is an appealing pitch. It is also one you cannot easily check, and the people writing it usually sell something. I am not going to make that pitch. I do not have a secret method, I cannot verify anyone else’s record and I would rather show you what is knowable.What is knowable is what Wall Street analysts think. The S&P 500 with S&P Global Market Intelligence data that ranks stocks by analyst consensus, and this article walks through the ten with the strongest scores, with the price targets and valuations that go with them and, just as important, the risks. Think of it as a map of where professional opinion is concentrated, not a set of instructions.
The Short Answer: The List
The S&P 500 stocks with the strongest analyst consensus are Synopsys, Broadcom, Flex, Nvidia, Vistra, Amazon, Microsoft, EchoStar, Trimble and DexCom, with scores from 1.24 to 1.34, where lower is better. Analysts rate only 59 of the 500 as Strong Buy, and only one as a Sell. But the list is heavy with AI-linked companies: seven of the ten, in my classification, and that concentration means these stocks may rise or fall together. Analyst enthusiasm is also not the same as a bargain, with the Shiller CAPE above 41.
How This List Was Built
The S&P 500 and ranks each stock by the consensus recommendation of the analysts covering it, using a numerical score in which lower is better, with scores near 1 meaning Strong Buy. It found that analysts assign a consensus Sell to only one stock and a Strong Buy to 59, so the list is a selection from a market in which analysts are generally positive. That is a well-known feature of analyst ratings, which in my general knowledge skew optimistic, a point I did not retrieve from these sources.I took the ten best scores, so the selection is mechanical rather than my judgment. I then added price targets and valuation measures from several outlets. Those come from different dates and providers, and they conflict in places: Flex’s implied upside is 87% in one source and 128% in another, and Nvidia’s price appears at $200 in one article and $218 in another. I attribute each figure and treat them as indications. A consensus score tells you what analysts think. It does not tell you what the price already assumes.
The Ten, One by One
Start with the semiconductor and AI infrastructure group. Nvidia is the poster child: 62 analysts cover it, with 10 Strong Buy, 49 Buy, 2 Hold and 1 Sell, and a consensus target of $327.14, about 63.5% above its $200.13 close, according to 24/7 Wall St. It trades at about 17.1 times forward earnings per EBC, and its earnings on November 17 are the next test. Broadcom scores 1.26, with targets around $527 to $530, or 62% to 64% upside, and a forward P/E of about 19.1. Synopsys has the best score, 1.24, but I did not retrieve a target for it. Flex, an electronics manufacturer tied to data-center build-outs, scores 1.27 with a Kiplinger target of $156, an implied gain of 87%.Next, the cloud giants. Microsoft scores 1.33; Argus has a buy rating and a $620 target against a $521.08 close on October 22, an implied 19%, and it trades near 25.1 times forward earnings. It was pressured early in 2026 by concerns that AI could disrupt software, according to Argus. Amazon scores 1.33 and trades near 25.3 times forward earnings, but it just reported $77.3 billion of quarterly capex and negative free cash flow, even with AWS growing 39%. Alphabet, at 1.38, just misses the ten and fell 12% on October 29 after reporting its own capex surge. The cloud trade is a bet that today’s spending becomes tomorrow’s profit.
The rest are less AI-centered. Vistra, at 1.32, is a power producer that analysts like partly for the electricity demand of data centers, in my understanding, which makes it AI-adjacent. EchoStar at 1.33 is a satellite and communications company, Trimble at 1.33 makes positioning technology for construction and other industries and DexCom at 1.34 makes glucose monitors, with Argus seeing about 23% implied upside. I retrieved little detail on these four, so you would need to research each before buying. That a stock appears on a list is a reason to look, not a reason to buy.
S&P Global MI (October): 59 Strong Buy S&P 500 stocks, one consensus Sell. Top scores: Synopsys 1.24, Broadcom 1.26, Flex 1.27, Nvidia 1.29, Vistra 1.32, Amazon/Microsoft/EchoStar/Trimble 1.33, DexCom 1.34. Nvidia: $200.13 close, $327.14 consensus target (+63.5%), forward P/E 17.1x, earnings November 17.
What the Numbers Hide
The biggest hidden risk is concentration. Seven of the ten are tied to AI in my classification, and they share exposure to the same question that rattled markets in late October: will the hundreds of billions of dollars being spent on AI infrastructure earn adequate returns? The four largest US tech companies plan more than $740 billion of capex this year, and Alphabet and Amazon both reported negative free cash flow. If the answer disappoints, a portfolio of these stocks would not be diversified. In my illustration, if the seven AI-linked stocks fell 40% and the other three rose 10%, an equal-weight portfolio would lose about 25%.The second is valuation. The Shiller CAPE recently rose above 41, its highest since the dot-com era, according to US News, so even stocks analysts love can be expensive. Forward P/E ratios range from about 17 for Nvidia to 25 for Microsoft and Amazon, which are not extreme but leave little room for error. The third is the nature of price targets: they are one-year estimates that assume things go right, and they change when prices move. A target implying 63% upside tells you how optimistic the analysts are, not how likely the outcome is.
A Word About “Beat the Market by 4x” Claims
Stock-picking services often advertise that their method has beaten the S&P 500 by a multiple over 20 years or more. Consider the scale. In my arithmetic, SPY’s roughly 11% a year over the past 20 years turned $1,000 into about $8,060. Beating that by four times would mean about $32,000, which is roughly 19% a year for 20 years, or 18% a year if measured on cumulative return. Very few strategies have ever managed that, and S&P Dow Jones Indices found 79% of active large-cap funds trailed the S&P 500 in 2025.Such claims can still be technically true, because they depend on choices: which picks are counted, what dates are used, whether returns are averaged across recommendations rather than measured for an actual portfolio, whether losing picks are dropped and whether subscribers actually bought at the same prices. I cannot verify any service’s claim, and I am not endorsing one. If you consider a paid service, ask how the track record is calculated, whether it is audited and what it would have meant for an investor who followed every recommendation in order. Past performance does not guarantee future results.
How to Use a List Like This
A list like this is best used as a research starting point. For each stock you find interesting, ask what the company sells, how it makes money, what has to go right for the analysts to be correct and what is already in the price. Read the latest earnings report, check the valuation against peers and history and understand the main risks. Do not buy something you cannot explain in two sentences. And decide in advance what would make you sell, because the time to think about a loss is before you have one.Then decide how it fits your portfolio. For most people, a broad low-cost index fund is the core, and individual stocks are a small slice. Hendrik Bessembinder found the best 4.3% of stocks created all the market’s net wealth, which means picking the winners is hard, and a fund captures them without choosing. If you do buy individual stocks, build positions gradually rather than all at once, particularly around events such as Nvidia’s November 17 earnings, and keep an emergency fund so you are never forced to sell at a bad time.
Position Sizing: A Simple Illustration
Suppose you put $10,000 equally across the ten stocks, $1,000 each. If one halves, you lose $500, or 5%. That sounds tolerable. But if the seven AI-linked names fall 40% together, the portfolio loses $2,800 on those seven, and if the other three rise 10% you gain $300, for a net loss of $2,500, or 25%. Recovering from a 25% loss needs a 33% gain, and the arithmetic gets harsher: a 30% loss needs 43%, a 40% loss needs 67% and a 50% loss needs 100%.The lesson is that the number of stocks matters less than how different they are. Ten stocks in one theme behave like one big stock. A more resilient approach would spread across sectors and asset types, keep individual stocks to a small share of your investments and use an index fund for the rest. This is general education, not advice, and the right size for you depends on your goals and nerves. If you would panic at a 25% drop, own less of these, whatever the analysts say.
Analysts can be wrong, and a Strong Buy rating is not a guarantee. Treat the list as a place to start research, not a reason to buy, and never invest money you may need within five years.
Common mistakes include buying a stock because it appears on a list, confusing analyst enthusiasm with value, putting too much money in one theme, ignoring valuation, chasing a stock after a big run, buying all at once before a major earnings report, trusting performance claims you cannot verify and investing money you will need soon. Another is forgetting that many investors underperform the index: DALBAR found the average investor earned 6.8% a year over 30 years against 10.2% for the S&P 500, largely because of badly timed trades.
Conclusion
The ten S&P 500 stocks with the best analyst consensus in Erneroy’s October screen are Synopsys, Broadcom, Flex, Nvidia, Vistra, Amazon, Microsoft, EchoStar, Trimble and DexCom, with scores from 1.24 to 1.34, out of 59 Strong Buys and a single Sell. Analysts see large upside in several, with consensus targets implying about 63% for Nvidia and 62% to 64% for Broadcom. But seven of the ten are tied to AI, valuations are elevated with the Shiller CAPE above 41 and the late-October selloff showed how quickly sentiment can turn.So treat this as a research list, not a recommendation. Understand each business, check what is priced in, size positions so a 25% to 40% loss would not hurt and keep a broad index fund as your core. And be skeptical of any promise to beat the market by a multiple: in my arithmetic a 4x edge over SPY would take roughly 18% to 19% a year for 20 years. Nvidia’s November 17 earnings will be the next big test. This is general education, not personalized investment advice, and a qualified adviser can help you decide.
Frequently Asked Questions
Are these the best stocks to buy now?They are the ten S&P 500 stocks with the best analyst consensus scores in a using S&P Global Market Intelligence data, as of October. That is a measure of what analysts think, not a prediction or a recommendation from me. Analyst ratings can be wrong, are usually optimistic and can change quickly, and the stocks may already reflect good news in their prices.
What does a Strong Buy consensus mean?
It means analysts, on average, rate the stock close to the top of the scale. In Erneroy’s screen, a lower score is better, and 59 S&P 500 stocks scored as Strong Buy, while only one carried a consensus Sell. The score summarizes opinions from many analysts, and it says nothing about how much of the good news is already priced in.
Why are so many of the ten linked to AI?
Because analysts are bullish on companies tied to the AI buildout, and several of these names sell chips, design software, electronics manufacturing or cloud capacity. In my own classification, seven of the ten have a meaningful AI link. That concentration is a risk: if AI spending disappoints, many of them could fall together, as the late-October selloff showed.
Should I buy all ten?
Not necessarily. Buying all ten is not diversification if most depend on the same theme. A broad index fund spreads risk across the market, and 79% of active large-cap funds trailed the S&P 500 in 2025. If you do pick individual stocks, size each position so a large loss would not derail your plan. This is general education, not personal advice.
Can a stock-picking method really beat the market by 4x?
Be skeptical. In my arithmetic, SPY’s roughly 11% a year over 20 years turned $1,000 into about $8,060, so beating that by 4x would take roughly 18% to 19% a year for 20 years. Such claims often depend on how returns are measured, which picks and dates are chosen and survivorship. I cannot verify any particular service’s claim, and past performance does not guarantee future results.
0 Comments
Be the first to share your thoughts on this article.