

What Is a Price Target in Trading? Complete Guide


Table of Contents
- The Most Quoted Number in Financial Media
- What Is a Price Target?
- Two Distinct Uses: Fundamental Analyst vs Technical Trader
- How Price Targets Are Calculated: The Six Methods
- Worked Examples: How Analysts Build a Price Target
- Example 1 — P/E Multiple Method (most common)
- Example 2 — Technical Price Target (Head and Shoulders Pattern)
- How to Read and Interpret Analyst Price Targets
- How Accurate Are Analyst Price Targets? The Research
- What Upgrades and Downgrades Signal — and Why They Move Prices
- Technical Price Targets: How Traders Set Their Own
- Common Methods for Technical Price Targets
- Conclusion
- Frequently Asked Questions (FAQ)
- External References
The Most Quoted Number in Financial Media
Open a financial news article about any publicly traded company and you will almost certainly find a reference to a price target within the first few paragraphs. 'Goldman Sachs raised its price target on Microsoft to $520.' 'Morgan Stanley downgraded Tesla with a new price target of $180.' 'The consensus analyst price target for Nvidia implies 23% upside from current levels.' Price targets are among the most widely quoted and most frequently misunderstood figures in financial markets.A price target is an analyst's projection of where a stock's price will trade at a specific future point — most commonly 12 months from the publication date, though some analysts use 6-month or 18-month horizons. It is not a guarantee, a floor, a ceiling, or a certainty of any kind. It is an educated estimate derived from financial modelling, valuation analysis, and judgement about company and market conditions, produced by a professional whose job is to understand the company better than most investors do. It accompanies — and is inseparable from — an analyst's qualitative rating: typically Buy, Hold, or Sell (with variations in terminology across different banks).
This guide explains everything about price targets: what they are and what they are not, the two distinct contexts in which the term is used (fundamental analyst targets and technical trader targets), the methodologies analysts use to calculate them, what the research shows about how accurate they actually are, how to read and interpret consensus targets versus individual ones, what upgrades and downgrades signal, and how to use price targets as one informed input in investment decisions without over-relying on them. The honest accuracy data — more than 70% of analyst 12-month price targets are missed — makes that last discipline particularly important.
What Is a Price Target?
A price target is an analyst's explicit estimate of where a security's market price will trade at a specified future date, typically 12 to 18 months from the date of publication. For stock analysts working at investment banks, brokerage houses, and independent research firms, the standard horizon is 12 months. The price target is not the analyst's view of what the stock is worth today — it is their projection of what the market will pay for it in approximately one year, based on their forecast of the company's future earnings, growth rate, and the valuation multiple they expect the market to apply.Price targets are always published alongside qualitative recommendations. A Buy recommendation signals that the analyst believes the stock will rise to or above the target price — that there is material upside from the current price. A Hold recommendation (also called Neutral or Market Perform) typically accompanies a target price close to the current price — limited upside, limited downside. A Sell or Underperform recommendation accompanies a target below the current price, suggesting the analyst expects a decline. These ratings and targets together form the analyst's 'call' on the stock.
The practice of publicly disclosing price targets is relatively recent. As the ScienceDirect academic review notes, 'Although the disclosure of price targets was not common practice prior to the 1990s, most of the stock research reports issued by analysts nowadays include target price forecasting along with their stock recommendations.' The widespread availability of analyst targets on retail platforms — Yahoo Finance, Bloomberg, brokerage apps — has made them one of the most accessed pieces of financial data for individual investors.
Two Distinct Uses: Fundamental Analyst vs Technical Trader
The term 'price target' is used in two distinct contexts that should not be confused:-
Fundamental analyst price targets: Produced by professional equity analysts using financial valuation models (DCF, P/E multiples, EV/EBITDA, etc.) to estimate what a stock should be worth in 12-18 months. These are published by Wall Street investment banks, independent research firms, and brokerage houses. They represent an assessment of intrinsic value translated into a future price forecast.
-
Technical trader price targets: Calculated by traders using price chart patterns, Fibonacci levels, ATR (Average True Range) multiples, and measured move techniques. A technical trader identifies a chart pattern — a head and shoulders, a rectangle, or a flag — and calculates the implied 'measured move' from the pattern as their price target for the trade. These have nothing to do with fundamental valuation and apply to any asset class over any timeframe from hours to weeks.
This guide covers both. The fundamental analyst context is more widely discussed in financial media; the technical context is more directly actionable for active traders. Understanding which type of price target is being referred to in any given context prevents significant confusion.
The accuracy reality: Analysts miss 12-month price targets more than 70% of the time on average — overall accuracy rate approximately 30% — AnaChart's March 2026 data-driven analysis confirms: 'Research consistently shows analysts miss their 12-month price targets more than 70% of the time on average.' Wall Street Rank's independent analysis cites an overall historical accuracy rate of roughly 30%. This data is not an argument against using price targets but an essential calibration for how much weight to assign them (AnaChart March 2026 / Wall Street Rank).
How Price Targets Are Calculated: The Six Methods
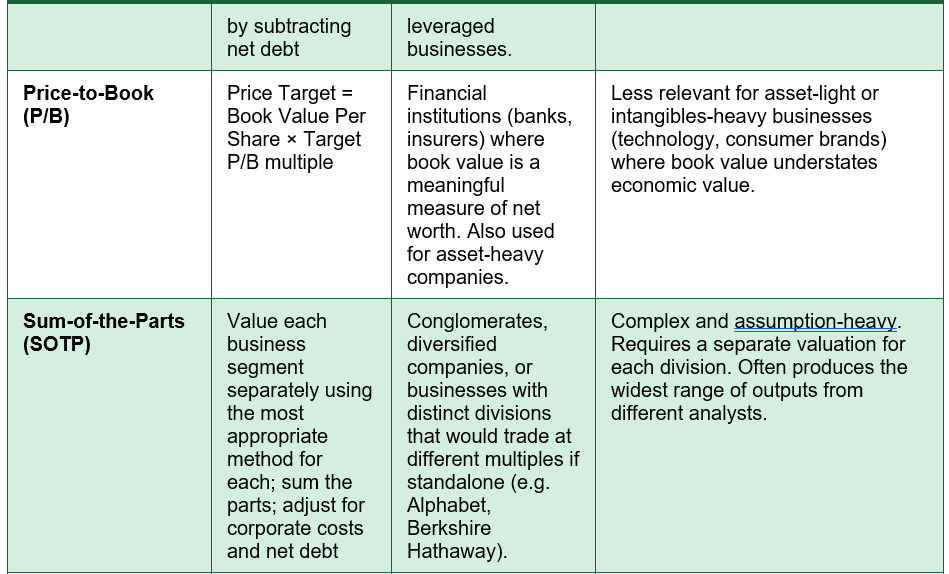
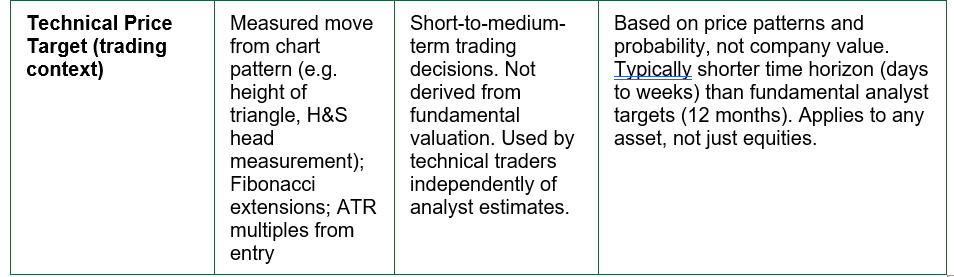
Price targets are not arbitrary numbers — they are outputs of systematic financial models. Different analysts use different methods depending on the company's industry, growth stage, and financial characteristics. The table below explains every major valuation method used to derive price targets, with the formula, best application, and key limitations of each: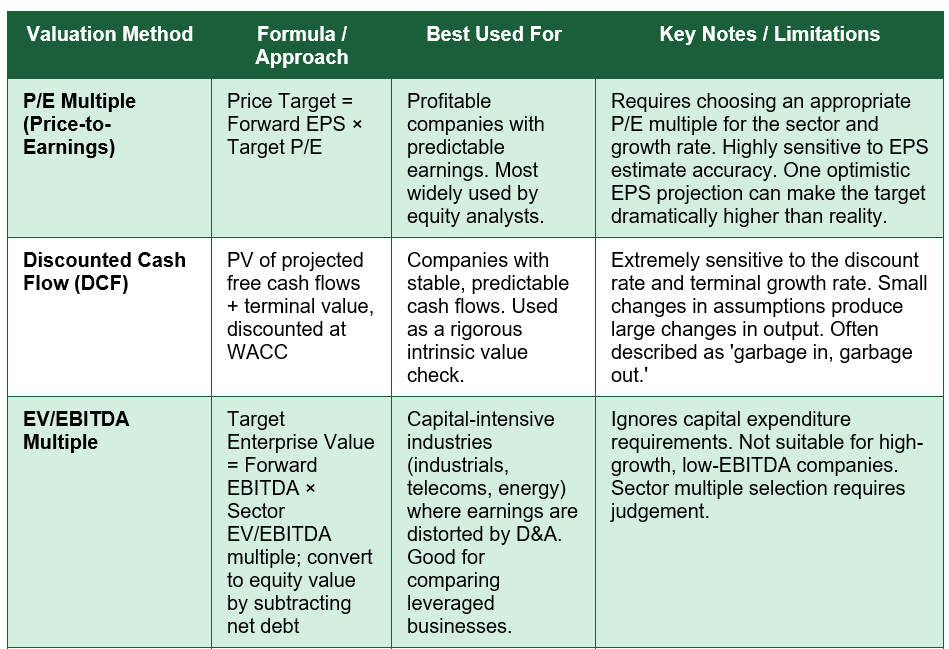
Worked Examples: How Analysts Build a Price Target
Example 1 — P/E Multiple Method (most common)
A software company currently trades at $85 per share. The analyst forecasts earnings per share (EPS) of $5.00 for the next 12 months and believes the stock should trade at 20x earnings given its growth rate and peer group multiples.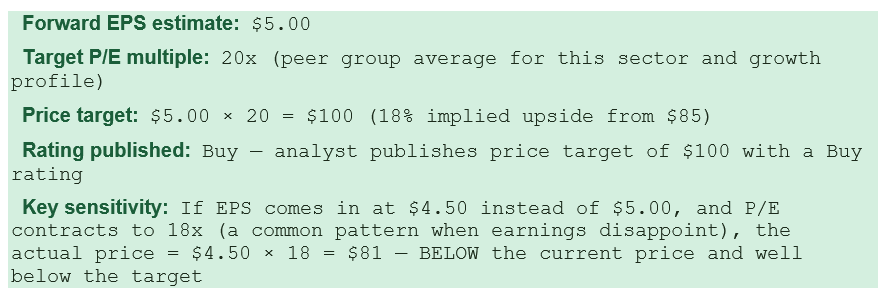
Example 2 — Technical Price Target (Head and Shoulders Pattern)
A trader identifies a Head and Shoulders pattern forming on a stock chart. The head (highest peak) is at $120, the neckline (connecting the two troughs) is at $100.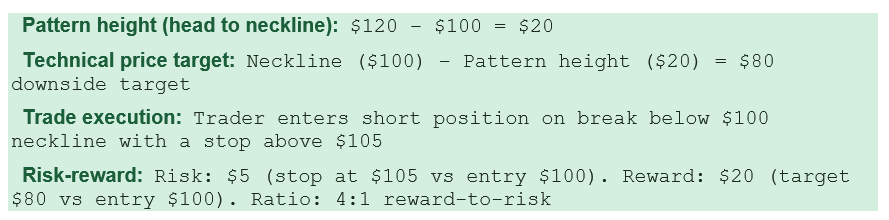
Why the P/E method is so sensitive to assumptions: The P/E multiple method looks simple but hides compounding uncertainty. The analyst must forecast EPS correctly (which depends on revenue growth, margins, and tax rates, each with their own uncertainty), AND correctly choose the P/E multiple the market will apply (which depends on investor sentiment, interest rates, sector rotation, and company-specific events). A 10% EPS miss combined with a P/E multiple contraction from 20x to 16x converts a 18% upside target into a 29% downside reality. This 'double compression' effect is one of the primary reasons analyst targets are missed so frequently — both inputs move, often in the same direction during earnings disappointments.
How to Read and Interpret Analyst Price Targets
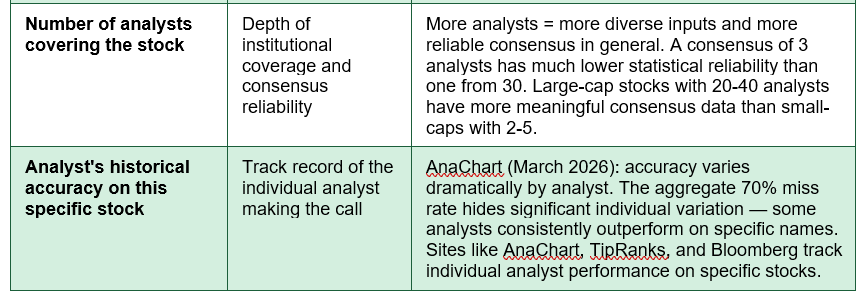
Understanding what each component of analyst price target data tells you — and what it does not — is the essential skill for using this information without being misled by it. The table below maps the key data points available on any stock to their meaning and correct interpretation: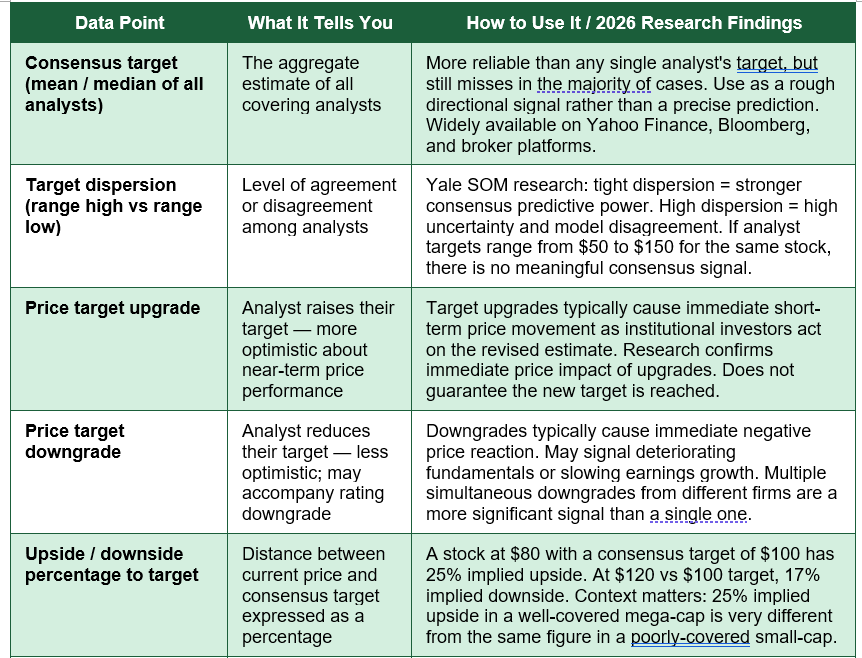
How Accurate Are Analyst Price Targets? The Research
The headline finding from multiple independent sources is consistent: analyst 12-month price targets are missed more than 70% of the time. AnaChart's March 2026 data-driven analysis, which tracks verified analyst accuracy on a stock-by-stock basis, confirms this directly: 'Research consistently shows analysts miss their 12-month price targets more than 70% of the time on average.' Wall Street Rank's independent assessment cites an overall historical accuracy rate of roughly 30%.These numbers require careful interpretation. They do not mean that analyst targets are worthless — they mean that treating a specific numeric target as a reliable prediction of where a stock will trade in exactly 12 months is not justified. The value of price targets lies not in the precision of the number but in the directional signal, the assumptions embedded in the model, and — particularly — the consensus trend across multiple analysts over time.
Several factors explain why the accuracy rate is structurally low. First, as AnaChart notes, 'analysts also face institutional pressures: maintaining relationships with covered companies can bias their outlook toward optimism.' The ScienceDirect academic review confirms this pattern: 'Analysts tend to issue more favored targets when prevailing targets are optimistic, however, such targets often end up incurring greater forecasting errors. The clustering tendency among analysts is possibly because they employ similar pricing methodologies or herd towards consensus.' Second, price targets are 12-month projections built on assumptions — earnings estimates, interest rate expectations, competitive dynamics, and macroeconomic conditions — all of which shift continuously in ways that are genuinely difficult to predict. Third, markets are dynamic: a target set when interest rates were 3% may be entirely wrong when interest rates move to 5%, regardless of how accurate the earnings forecast was.
THE OPTIMISM BIAS IN ANALYST TARGETS: Analyst research consistently skews toward optimism. The ratio of Buy to Sell ratings from major Wall Street banks has historically run at approximately 5:1 or higher — far more than would be expected if stocks were as likely to fall as to rise. This bias exists because analysts are embedded in institutional relationships with the companies they cover, because negative coverage risks losing investment banking relationships, and because covering analysts want access to management. The practical consequence: individual analyst Buy ratings are much more common than their actual hit rate justifies. Treat individual analyst targets with healthy scepticism and look for where multiple independent analysts converge on a directional view, not where a single analyst sets an unusually bullish target.
What Upgrades and Downgrades Signal — and Why They Move Prices
When an analyst revises their price target — upward (an upgrade) or downward (a downgrade) — the stock often moves immediately in the same direction, even if the actual information conveyed by the target change is minimal. This market reaction reflects the role of analyst coverage in transmitting information between companies and institutional investors.Target upgrades tend to cause positive price reactions because they signal that a professional with deep company knowledge has revised their expectations upward. Large institutional investors — mutual funds, pension funds, and hedge funds — who may not have the capacity to model every stock themselves use analyst ratings as input signals. When a major bank upgrades a stock or raises its target, funds that include the stock in their coverage universe may act on that signal. This concentrated buying creates the immediate price impact.
Target downgrades — particularly when accompanied by a rating change to Sell or Underperform — typically cause sharper and faster price reactions than upgrades, because negative analyst opinions are rarer (given the structural Buy bias), and therefore carry more information content when they do occur. Multiple simultaneous downgrades from different banks — a reduction in the consensus target — is generally a more significant signal than any single analyst's action.
The research by Bitget/academic sources confirms: 'Immediate price impact: target upgrades/downgrades cause immediate reactions as institutional investors act on the revised estimate.' The short-term market impact of analyst actions is one of the most reliably documented phenomena in finance — though the long-term predictive value of the specific target number is the dimension that is more frequently disappointed.
Technical Price Targets: How Traders Set Their Own
For active traders who use technical analysis, the price target concept is independent of what Wall Street analysts publish. A technical price target is a level that a trader calculates as their expected exit point for a trade, based on the characteristics of the chart pattern or technical setup that generated the entry signal. Technical price targets have several important advantages over fundamental analyst targets for short-to-medium-term trading: they are updated continuously as new price data arrives, they are derived from objective market data rather than model assumptions, and they apply to any instrument — stocks, currencies, commodities, cryptocurrency, index futures — not just equities covered by research analysts.Common Methods for Technical Price Targets
- Measured move (chart patterns): The most widely used technique. A chart pattern's height — measured from key high to low — is projected from the breakout point to derive the target. A head and shoulders pattern with a head 20 points above the neckline has a 20-point measured move target below the neckline. Rectangle, triangle, and flag patterns use the same principle.
- Fibonacci extensions: After identifying a significant price swing (low to high or high to low), Fibonacci extension ratios — 127.2%, 161.8%, 200%, 261.8% — are applied to project potential future price targets beyond the original swing. The 161.8% extension is the most commonly cited Fibonacci target level.
- ATR (Average True Range) multiple: A stock with an ATR of $2 might have a price target set at 2× or 3× ATR from the entry point ($4 or $6 of potential profit), with a stop loss at 1× ATR ($2 of potential loss). This method scales targets to current volatility, making them more realistic in high-volatility and low-volatility environments alike.
- Previous highs / lows and support-resistance levels: Identify a key previous high or resistance level and use it as the profit target — the point where the analysis suggests price is likely to stall. This is the simplest and most intuitive approach and is often the most reliable in strongly trending markets.
HOW TO USE PRICE TARGETS PRACTICALLY: The most informed approach to analyst price targets is to treat them as inputs, not answers. Use the consensus target as a rough directional signal — does the weight of professional opinion believe there is upside or downside from here? Use dispersion to assess conviction — a tight cluster of targets suggests stronger analyst agreement, a wide range signals high uncertainty. Check the individual analyst's track record on this specific stock through tools like AnaChart or TipRanks rather than relying on their firm's reputation. And always verify the key assumptions — the EPS estimate and the P/E multiple — before accepting the target number as meaningful.
Conclusion
A price target is one of the most widely quoted numbers in financial markets and one of the most frequently misunderstood. In its fundamental analyst context, it is a 12-month projection of where a stock will trade, derived from financial valuation models that most commonly apply a P/E multiple to a forward EPS estimate, though DCF, EV/EBITDA, sum-of-the-parts, and other methods are also used. In its technical trading context, it is a calculated exit level derived from chart pattern measurements, Fibonacci extensions, or ATR multiples — independent of any fundamental assessment of value.The accuracy data should be treated as essential context for anyone using analyst price targets: research consistently shows analysts miss their 12-month targets more than 70% of the time. The overall accuracy rate is approximately 30%. This reflects the compounding of EPS forecast uncertainty with valuation multiple uncertainty, the structural optimism bias in analyst research, analyst herding toward consensus, and the reality that markets in 12 months may be facing an entirely different interest rate or macroeconomic environment than when the target was set. The ScienceDirect academic research confirms that brokerage industry knowledge and experience with specific stocks improve accuracy — meaning that individual analyst track records on specific names are more informative than aggregate accuracy statistics.
Used correctly, price targets — particularly consensus data with attention to dispersion, upgrade/downgrade trends, and individual analyst track records — provide genuine informational value as one input in a multi-factor investment process. Used incorrectly — treated as precise predictions, accepted without scrutiny of the underlying assumptions, or followed from analysts with documented optimism bias — they can generate significant misplaced confidence. The right relationship with a price target is neither dismissal nor deference. It is calibrated, contextual, and always accompanied by your own independent assessment of the underlying case.
Frequently Asked Questions (FAQ)
What does a stock price target mean?
A stock price target is an analyst's estimate of where a stock's share price will trade at a specific future date — most commonly 12 months from the date the target is published. It is an educated projection derived from financial modelling and valuation analysis, not a guarantee. The target is always published alongside a qualitative rating (Buy, Hold, or Sell) that provides the directional judgement behind the number. A price target above the current price, accompanied by a Buy rating, means the analyst expects the stock to rise to that level within the year. A target below the current price, with a Sell or Underperform rating, means the analyst expects a decline. Importantly, price targets are missed more than 70% of the time, meaning they should be treated as rough directional indicators rather than precise predictions.How do analysts calculate a price target?
The most common method is the P/E multiple approach: the analyst forecasts the company's earnings per share (EPS) for the next 12 months, then multiplies that figure by the P/E ratio they believe the market will apply to the stock. For example, $5.00 EPS × 20x P/E = $100 price target. Other methods include Discounted Cash Flow analysis (projecting future free cash flows and discounting them to present value), EV/EBITDA multiples (more common for capital-intensive businesses), Price-to-Book ratios (more common for financial companies), and sum-of-the-parts analysis (for diversified conglomerates). Most analysts use multiple methods and triangulate between them. The final target also incorporates qualitative judgements about growth opportunities, competitive dynamics, and macro conditions that numerical models cannot fully capture.How accurate are analyst price targets?
Analyst 12-month price targets are missed more than 70% of the time according to research reviewed by AnaChart (March 2026). The overall historical accuracy rate is approximately 30% (Wall Street Rank). However, accuracy varies significantly by analyst, by sector, and by the specific company being covered. Academic research (ScienceDirect) finds that accuracy is higher for analysts with deeper industry expertise in the specific sector and longer experience covering the specific stock. Consensus targets — the aggregation of many analysts' targets — tend to be more reliable than any individual analyst's target. Tight consensus dispersion (analysts clustered near the same number) correlates with better predictive power than wide dispersion. Individual analyst track records on specific stocks, available through tools like AnaChart and TipRanks, are more informative than aggregate figures.What happens to a stock price when an analyst changes their target?
When an analyst upgrades their price target (raises it) or issues a fresh Buy rating, stocks typically experience an immediate positive price reaction as institutional investors who follow that analyst's coverage act on the revised estimate. When an analyst downgrades a target (lowers it) or moves to a Sell or Underperform rating, stocks typically fall immediately. Research confirms this immediate price impact is a robust and reliably documented phenomenon. The size of the reaction depends on the analyst's reputation, the size of the change, how many other analysts make simultaneous similar moves, and how far the current market consensus was from the new target. Multiple simultaneous target cuts from different analysts are significantly more impactful than a single analyst's action. Note that the immediate reaction does not confirm that the analyst's target is correct — only that market participants are responding to the information signal.What is a price target in technical trading?
In technical trading, a price target is a specific price level that a trader calculates as their expected exit point for a trade, based on the characteristics of the chart pattern or technical setup that generated the entry signal. It has nothing to do with fundamental analyst valuation. The most common method is the measured move: a chart pattern's height is projected from the breakout point to determine the target. For example, a head and shoulders pattern with the head 20 points above the neckline has a 20-point target below the neckline breakout. Other technical price target methods include Fibonacci extensions (applying standard ratios like 161.8% to price swings), ATR multiples (setting targets at 2× or 3× the average daily range), and projecting to previous significant support or resistance levels. Technical price targets apply to any tradable asset — stocks, currencies, commodities, cryptocurrency — not just equities with analyst coverage.External References
1. AnaChart — How Accurate Are Analyst Price Targets? A Data-Driven Look (March 2026)https://anachart.com/how-accurate-are-analyst-price-targets/
2. SmartInvestorsDaily — Stock Price Targets Explained: How to Use Analyst Targets (April 2026)
https://smartinvestorsdaily.com/guides/stock-price-target-guide/
3. Public.com — What Are Price Targets? How to Interpret and Calculate Them (updated 6 days ago)
https://public.com/learn/what-are-price-targets
4. Wall Street Rank — What Are Analyst Price Targets and How Are They Useful?
https://www.wallstrank.com/learn/analyst-price-targets-and-how-they-are-determined
5. Bitget — How Accurate Are Stock Price Targets: Evidence (January 2026)
https://www.bitget.com/wiki/how-accurate-are-stock-price-targets
6. ScienceDirect — A Multi-Dimensional Assessment of the Accuracy of Analyst Target Prices (peer-reviewed academic research)
https://www.sciencedirect.com/science/article/abs/pii/S1059056024000960
7. The Motley Fool — What Is a Price Target? (July 2025)
https://www.fool.com/terms/p/price-target/
8. Investopedia — Price Target: Definition, Methods, and Examples
https://www.investopedia.com/terms/p/pricetarget.asp
0 Comments
Be the first to share your thoughts on this article.