

Investing
What Is Overbought in Trading? Accountant Explains


Table of Contents
- What Overbought Really Means in Practice
- What Does Overbought Mean in Trading?
- How Overbought Is Measured: The Key Indicators
- The RSI: The Most Widely Used Overbought Indicator
- RSI Divergence: The Most Powerful Overbought Signal
- The Stochastic Oscillator: Overbought Threshold at 80
- The ADX: The Context Filter That Changes Everything
- Overbought in Trending vs Ranging Markets: How to Interpret
- Worked Examples: Overbought in Action
- Example 1 — Nvidia June-July 2025: When Overbought Is a Buy Signal
- Example 2 — Range-Bound Market: When RSI 70 Is a Valid Exit Signal
- Bollinger Bands as an Overbought Tool: Upper Band and %B
- Limitations of Overbought Signals: What They Cannot Tell You
- Conclusion
- Frequently Asked Questions (FAQ)
What Overbought Really Means in Practice
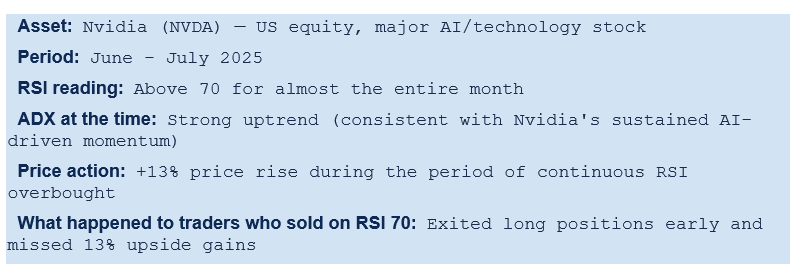
One of the most common phrases in trading is 'this stock is overbought — time to sell.' Millions of retail traders look at an RSI reading above 70, see the word 'overbought,' and take it as a straightforward instruction to exit or short the position. What happened to Nvidia in June-July 2025 is the most current and most instructive illustration of why that interpretation can be dangerously wrong. According to Charles Schwab's October 2025 analysis, Nvidia's RSI spent an entire month almost entirely above 70 during that period. Meanwhile, the stock price rose 13%. Anyone who exited on the first overbought reading missed those gains entirely. Anyone who shorted the stock on the RSI 70 signal lost money.Overbought is a technical analysis condition that describes a market or security whose price has risen so rapidly and so far in a short period that momentum indicators — most commonly the Relative Strength Index (RSI), the Stochastic Oscillator, or the Stochastic RSI — have moved into their upper extreme zones. It signals that buying pressure has been exceptionally strong and that prices may have risen further and faster than fundamentals or recent historical patterns can sustain. But it does not — and this is the critical and frequently misunderstood distinction — automatically mean the price is about to fall.
This guide explains everything about overbought conditions in trading: the precise definition, the six major indicators that measure overbought conditions and exactly what each threshold means, why overbought signals are reliable in ranging markets and unreliable in trending markets, how ADX changes the interpretation entirely, what bearish divergence is and why it is the most powerful overbought signal, the Nvidia 2025 real-world case study, and the practical rules for trading overbought conditions responsibly. By the end of this guide, you will understand overbought not as a binary instruction but as a contextual signal whose meaning depends critically on the market environment in which it appears.
What Does Overbought Mean in Trading?
Overbought is a technical analysis description of an asset whose price has increased rapidly to a level that appears unsustainable based on recent price history, as measured by momentum indicators. The term 'overbought' reflects the idea that buyers have been so dominant — purchasing with such intensity and consistency — that the buying energy has become temporarily exhausted, potentially leaving the asset vulnerable to a pullback, consolidation, or reversal as profit-taking and new selling pressure emerge.Investopedia's definition captures the standard interpretation: 'Overbought refers to a security or other asset that traders and analysts believe is priced above its true value and that will likely experience a corrective pullback. It is not the same as overvalued, which is a term used in fundamental analysis.' This distinction between overbought (a technical analysis term based on price momentum) and overvalued (a fundamental analysis term based on intrinsic value) is important. A stock can be technically overbought by momentum indicators while being genuinely undervalued on a fundamental basis, and vice versa. The two concepts measure completely different things and should not be conflated.
The measurement of overbought conditions relies on momentum oscillators — mathematical indicators that quantify the speed and magnitude of recent price changes and plot that calculation within a fixed range (usually 0 to 100). When the calculation reaches the upper extreme of its range, the indicator signals that the upward price momentum is at an unusual extreme. These indicators do not forecast the future directly; they describe the current state of momentum and, in certain market contexts, suggest that the immediate momentum may not be sustainable.
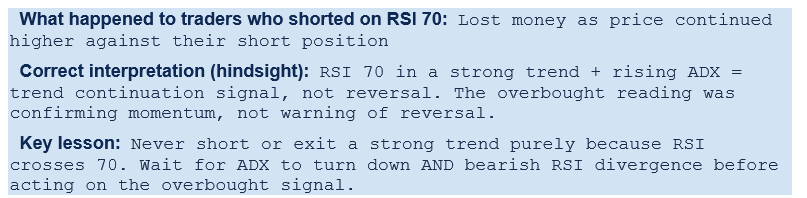
The Nvidia 2025 overbought trap: RSI above 70 for a full month in June-July 2025 — while Nvidia stock rose 13% — Charles Schwab's analysis (October 2025) documents the definitive 2025 overbought trap: 'Consider the RSI in the Nvidia (NVDA) chart below. It spent a month almost entirely above 70 in June and July 2025. Meanwhile, the price rose 13%. Obviously, anyone who exited on the first overbought reading would have missed out on those gains, and anyone who took 70, or the first cross below 70, as a short signal would have lost money.' This is the most powerful real-world 2025 illustration of why context — specifically trend strength — determines whether an overbought reading is actionable
How Overbought Is Measured: The Key Indicators
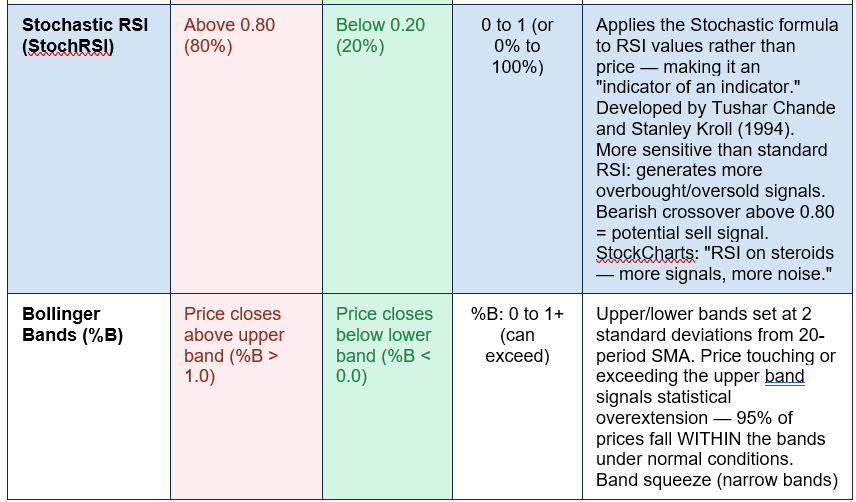
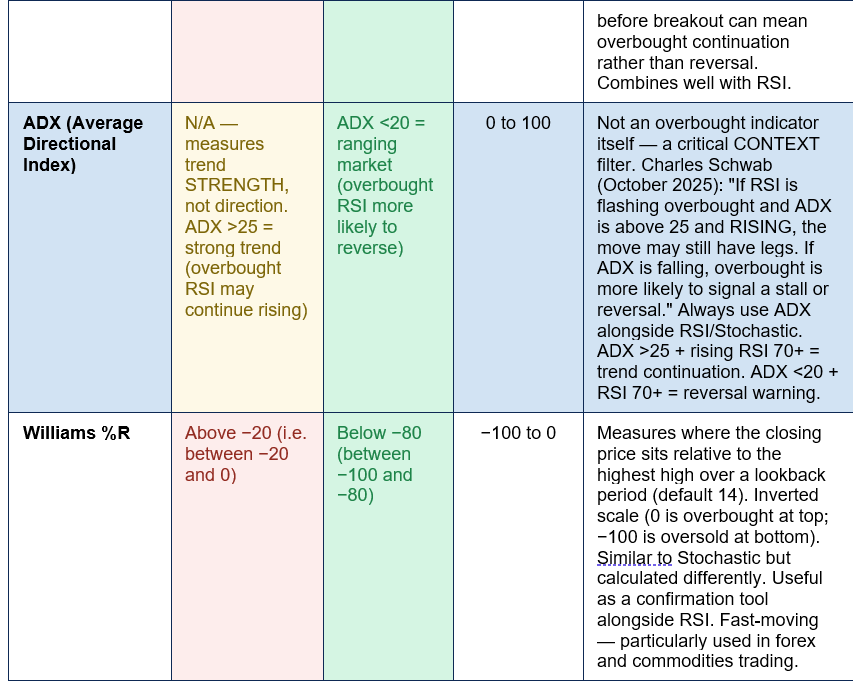
Overbought conditions are measured using momentum oscillators — indicators that move within a bounded range and identify extremes of price momentum. Different indicators use different mathematical approaches and different threshold levels to define overbought conditions. The six most important are compared in detail in the reference table below: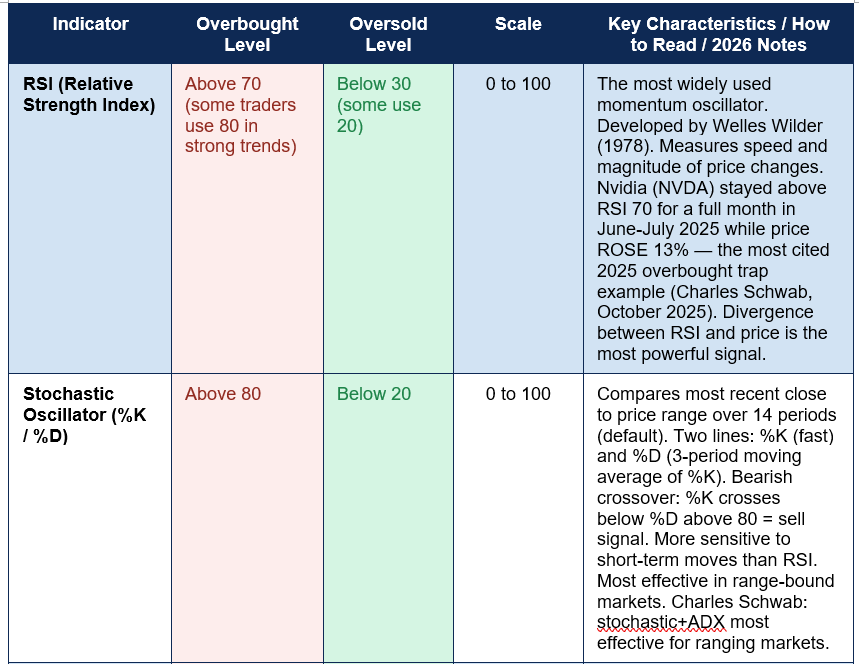
The RSI: The Most Widely Used Overbought Indicator
The Relative Strength Index (RSI) was developed by J. Welles Wilder Jr. and published in his 1978 book 'New Concepts in Technical Trading Systems.' It remains, nearly 50 years later, the most widely used momentum indicator in technical analysis. Its formula measures the average gain in up periods divided by the average loss in down periods over a specified lookback period (default 14 days or 14 candles), and plots the result on a scale from 0 to 100.The traditional interpretation assigns overbought status to readings above 70 and oversold status to readings below 30. But Welles Wilder himself, and subsequent researchers, recognised that these thresholds are not universal rules. During strong sustained uptrends, the RSI can remain above 70 for weeks — even months — without the price reversing. Chande and Kroll's 1994 book 'The New Technical Trader' specifically documented this: 'RSI can oscillate between 80 and 20 for extended periods without reaching extreme levels. Traders looking to enter a stock based on an overbought or oversold reading in RSI might find themselves continuously on the sidelines.' This observation led them to develop the StochRSI to generate more frequent signals.
Charles Schwab's guidance (October 2025) reflects the current best practice: 'In fact, some traders adjust their RSI thresholds to 80 and 20 when the trend is strong.' This means treating RSI 70 as a preliminary alert — a reason to watch closely — rather than an automatic exit signal. In a strong trend (confirmed by an ADX above 25 and rising), RSI 70+ may simply indicate that strong buying momentum is sustaining the trend. Only when RSI begins to weaken — through bearish divergence or the combination of a declining ADX and an RSI cross back below 70 — does the overbought reading become a more reliable sell signal.
RSI Divergence: The Most Powerful Overbought Signal
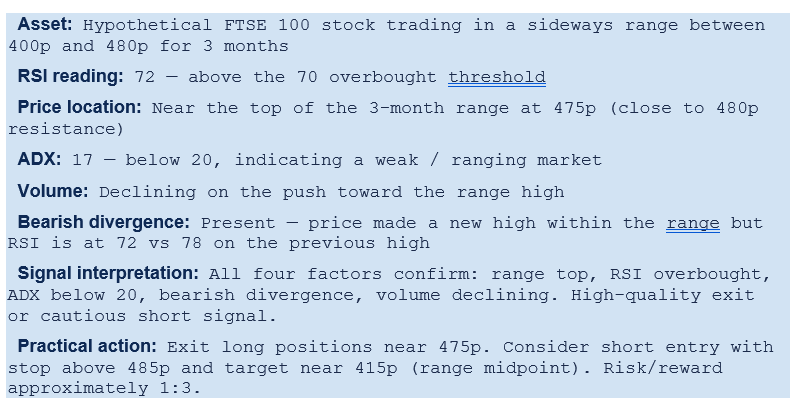
Of all the signals that overbought RSI can generate, bearish divergence is consistently identified as the most reliable by technical analysts. Bearish divergence occurs when: the price makes a new high (a higher price peak than the previous peak), but the RSI simultaneously makes a lower high (a lower RSI reading at the second price peak than at the first). This divergence between price and momentum indicates that although buyers managed to push the price to a new high, the rate and intensity of buying momentum required to do so was weaker than during the previous high. Fewer buyers are participating, or existing buyers are less committed — the engine driving the price higher is losing power even as the price reaches new peaks.Charles Schwab's October 2025 guide describes how professionals use this: 'Many traders who are already in the market use momentum divergence, along with a cross below overbought, as a sign to exit the trend.' The sequence is critical: divergence alone is a warning, not a trigger. The confirmation trigger is usually the subsequent RSI cross back below 70 — at which point the divergence is confirmed by actual momentum reversal, and the exit or short entry becomes more defensible.
The RSI 14 vs RSI 9 settings decision: The default RSI period is 14, but shorter-period RSI settings (RSI 9 or RSI 7) are more sensitive and generate overbought/oversold signals more frequently. Stockgro's January 2026 StochRSI guide confirms this principle: 'Shorter periods make the indicator react faster and provide overbought/oversold signals for short-term trading, for catching early momentum shifts on lower timeframes. Longer periods slow down the indicator, which is helpful when trading daily or weekly charts.' Day traders typically use shorter periods (RSI 7 or 9) to catch intraday overbought extremes. Swing traders and position traders typically use the standard RSI 14 to avoid excessive false signals. The period should match the trading timeframe.
The Stochastic Oscillator: Overbought Threshold at 80
The Stochastic Oscillator, developed by George Lane in the 1950s and 1960s, measures momentum by comparing an asset's most recent closing price to its price range over a set number of trading periods (default 14). The resulting calculation shows where the current price sits within its recent high-low range — at the top of the range (indicating buyers have been dominant), at the bottom (sellers have been dominant), or somewhere in between.The Stochastic Oscillator produces two lines: the %K line, which reflects the current position of the close within the recent range; and the %D line, which is a three-period moving average of %K and acts as a signal line. The overbought threshold for the Stochastic is above 80 (not 70 as in RSI). Charles Schwab's guidance distinguishes this clearly: 'Like the RSI, it swings between 0 and 100, but extremes are viewed differently, as readings above 80 are considered overbought and below 20 oversold.'
The primary trading signal from the Stochastic Oscillator in overbought territory is the bearish crossover: when the faster %K line crosses below the slower %D line while both are above 80. This crossover indicates that the short-term momentum reading (%K) has turned negative relative to its own average (%D), suggesting that the buying intensity within the recent range is beginning to fade. Charles Schwab identifies the ideal context for Stochastic signals: 'Both the RSI and stochastic indicators are more effective at identifying potential turning points in range-bound markets than trending ones.'
The ADX: The Context Filter That Changes Everything
The Average Directional Index (ADX), also developed by Welles Wilder, does not measure overbought conditions directly — it measures the strength of the prevailing trend, regardless of direction. This makes it the most important context indicator for interpreting any overbought or oversold reading from RSI, Stochastic, or StochRSI.ADX readings above 25 indicate a strong trending market. ADX readings below 20 indicate a ranging or trendless market. The direction of the ADX line also matters: a rising ADX means the trend is strengthening; a falling ADX means it is weakening, even if still above 25. Charles Schwab's October 2025 guidance provides the most concise formulation of how to combine ADX with overbought readings: 'So if the RSI is flashing overbought and the ADX is above 25 and rising, the move may still have legs. If the ADX is falling, an overbought reading is more likely to signal a stall or reversal. Both the numerical reading and direction of the ADX line are important. A falling ADX that's still at, say, 45, could mean the trend, though weakening, remains strong and the move could still have legs.'
The practical trading framework that emerges from combining RSI and ADX is simple and powerful: RSI above 70 + ADX above 25 and rising = ignore or hold the overbought signal, the trend may continue. RSI above 70 + ADX below 20 or ADX falling = take the overbought signal seriously as a potential reversal or consolidation warning. This framework immediately addresses the most common overbought trading mistake — treating RSI 70 as an unconditional sell signal without regard to the underlying trend strength.
THE RSI + ADX COMBINATION RULE: Before acting on any RSI overbought signal above 70, check the ADX. If ADX is above 25 and trending upward, the overbought condition is likely a feature of a strong trend — not a reversal signal. Hold your long position or wait for confirmation of reversal before exiting. If ADX is below 20 or declining, the overbought condition carries more weight as a reversal warning and deserves closer attention. This two-indicator check (RSI + ADX) is the most practically valuable overbought interpretation framework available to traders. Charles Schwab (October 2025): "ADX readings above 25 suggest a strong trend, while readings below 20 indicate a weak trend or sideways market."
Overbought in Trending vs Ranging Markets: How to Interpret
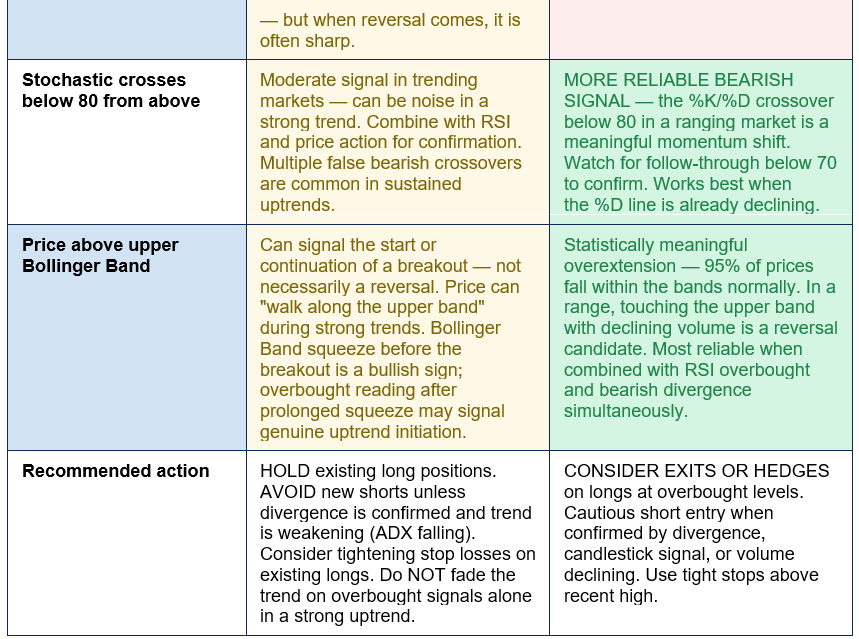
The most important practical skill in overbought analysis is correctly interpreting the signal based on the market environment. The same RSI reading of 75 means something completely different in a strong trend than in a sideways, range-bound market. The table below maps every key overbought scenario to the appropriate interpretation and recommended action: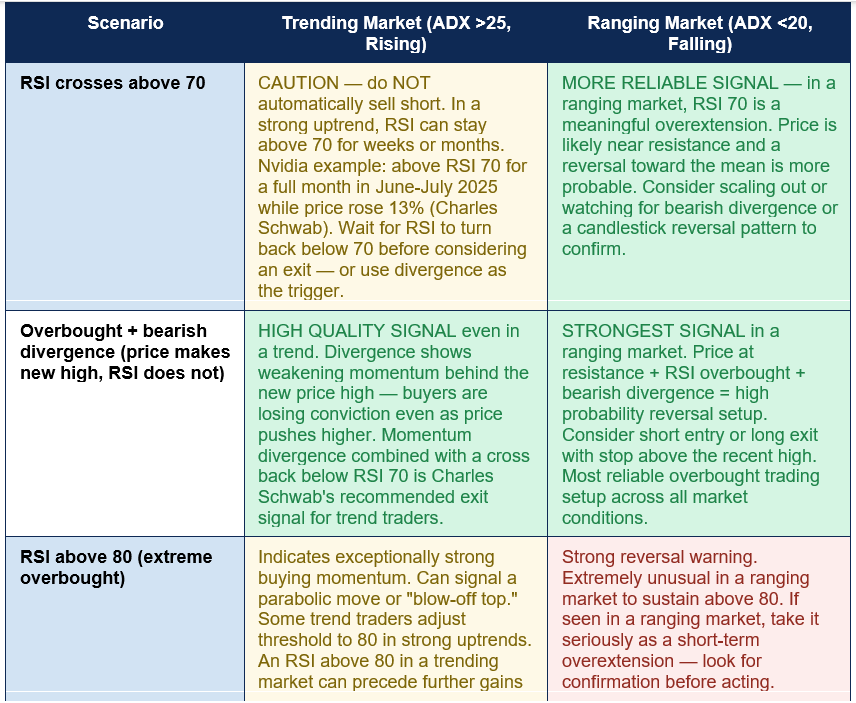
Worked Examples: Overbought in Action
Example 1 — Nvidia June-July 2025: When Overbought Is a Buy Signal
Example 2 — Range-Bound Market: When RSI 70 Is a Valid Exit Signal
Bollinger Bands as an Overbought Tool: Upper Band and %B
Bollinger Bands, developed by John Bollinger in the 1980s, offer a volatility-based measure of overbought conditions that differs from the pure momentum approach of RSI and Stochastic. The bands consist of a middle 20-period simple moving average and upper and lower bands set two standard deviations above and below the middle line. Under normal statistical conditions, approximately 95% of prices should fall within the bands. When price closes above the upper band, it has moved into the 5% statistical extreme — an unusually extended position relative to recent volatility.The %B indicator (a companion to Bollinger Bands) quantifies where the price sits relative to the bands on a scale, with 1.0 representing the upper band and 0 representing the lower band. A %B reading above 1.0 means the price has closed above the upper band — the clearest overbought signal in the Bollinger Band framework. However, as with RSI, context matters critically. In a strong uptrend, price can 'walk along the upper band' — consistently closing near or above the upper band for extended periods as the trend sustains. This walking behaviour is actually a bullish continuation signal, not a reversal warning.
The most reliable overbought reversal signal from Bollinger Bands combines the upper band touch with RSI overbought and declining volume — three confirming signals that together produce a higher-probability reversal scenario than any single indicator alone. The Bollinger Band squeeze — a period of unusually narrow bands, indicating low volatility consolidation — followed by a breakout above the upper band is often the beginning of a sustained trend move, not the end of one. Traders who sell the initial upper band touch after a squeeze typically miss the entire new trend.
Limitations of Overbought Signals: What They Cannot Tell You
Overbought indicators are among the most misused tools in retail trading precisely because their apparent simplicity obscures significant limitations that are critical to understand:- They do not predict the timing or size of any reversal: An overbought RSI reading tells you that momentum has been extreme. It does not tell you when — or whether — the momentum will reverse, by how much prices will fall, or whether the overbought condition will persist for days, weeks, or months before any pullback begins. Stockgro (January 2026): 'The readings above 80 signal overbought conditions, where the price may be stretched and prone to a pullback, even though strong trends can keep the indicator higher.'
- They generate significantly more false signals in trending markets: Charles Schwab (October 2025) and StockCharts both confirm that overbought/oversold readings from RSI and Stochastic 'are more effective at identifying potential turning points in range-bound markets than trending ones.' In a sustained uptrend, RSI can generate dozens of overbought readings without a meaningful reversal. Each reading that does not produce a reversal is a false signal that could cause a trader to exit too early or lose money on a short position.
- They are lagging indicators by definition: Momentum indicators react to price — they do not predict it. By the time RSI reaches 70 or 80, the price move that caused those readings has already happened. The indicator is describing what has already occurred, not what will occur next. This inherent lag means that overbought signals always arrive after the momentum event that generated them.
- Multiple overbought indicators can all give the same false signal simultaneously: Using RSI above 70, Stochastic above 80, and StochRSI above 0.80 all simultaneously does not triple the reliability of the signal — all three are measuring the same underlying price momentum from slightly different mathematical angles. They will all generate false signals during strong trends at the same time. StockCharts: 'There will be more overbought/oversold readings, more centerline crosses, more good signals and more bad signals' with higher-sensitivity indicators like StochRSI.
- They do not incorporate fundamental information: An overbought RSI provides no information about whether the price is rising for good fundamental reasons (strong earnings, competitive advantage, industry tailwinds) or speculative excess. A stock can be technically overbought while being fundamentally undervalued — and the technical overbought reading would lead a momentum trader to sell precisely the wrong stock.
THE MOST COMMON OVERBOUGHT MISTAKE — SHORTING STRONG TRENDS: The single most costly application of overbought signals is using RSI 70 as a trigger to short a stock in a strong uptrend. In a trending market, an overbought RSI reading confirms that strong buying momentum is present — it does not mean the buyers are exhausted. Short positions against strong trends face unlimited upside pressure and the risk of a short squeeze if the trend accelerates. Charles Schwab (October 2025): 'During strong trends (up or down), a move can have plenty of legs left long after the RSI has crossed 70 or 30.' Never short solely on the basis of an overbought indicator reading. Always require confirmation from ADX (falling or below 25), bearish divergence, deteriorating volume, and preferably a candlestick reversal pattern before taking a short position against an established uptrend.
Conclusion
Overbought is one of the most frequently referenced and most frequently misapplied concepts in trading. It describes a condition where momentum indicators — RSI, Stochastic, StochRSI, Bollinger Bands — have reached their upper extreme zones, indicating that buying pressure has been unusually intense and that prices may have extended beyond a level sustainable by normal buying demand. What it does not mean — and this distinction is the most practically important in this entire guide — is that the price is about to fall.The Nvidia case study from June-July 2025 makes this as clearly as any historical example can: a full month above RSI 70, and the stock rose 13% during that period. Selling on the RSI overbought signal cost traders those gains. Shorting on the signal cost them money. The reason the signal failed is that Nvidia was in a strong trend — confirmed by ADX — and in strong trends, overbought conditions reflect and confirm momentum rather than warn of its exhaustion. The same RSI reading of 72 that is a high-quality reversal warning in a range-bound market is a dangerous short signal in a sustained uptrend.
The correct framework for overbought trading has two components: the indicator and the context. RSI above 70 is the indicator — a starting point, not a conclusion. The context is provided by the ADX (is this a trending or ranging market?), by divergence (is price making new highs while RSI is not?), by volume (is buying pressure actually declining?), and by price action (is the price approaching a significant resistance level?). When all four contextual factors confirm the overbought signal — ADX below 25 and falling, bearish RSI divergence, declining volume, price at resistance — the overbought reading becomes the most reliable short-term reversal signal in technical analysis. When they contradict it — particularly when ADX is above 25 and rising — the overbought signal is best ignored or watched rather than acted upon.
0 Comments
Be the first to share your thoughts on this article.