

Vehicles & Cars
Why Your Car Is the Number 1 Wealth Killer

The average UK driver of a new financed car is spending over £900 a month to keep it on the road. A $35,000 car loses $18,000–$20,000 of its value in five years — silently, without a single bill arriving in the post. Nine in ten new cars in the UK are bought on PCP finance at rates of 6–9%. And the monthly payment is the smallest part of the true cost. Cars are the largest discretionary drain on the personal balance sheet in most households — and they are the only one where the scale of the damage almost never appears in a single, visible number. This article is that number.
Simon England, founder and MD of ALA Insurance (UK, 2026), identifies the gap directly: ‘Most people buying a new car are handed a monthly payment and told that is the cost, but it isn’t that simple. Once you account for depreciation, fuel, insurance and tax, the average new car driver is spending well over £900 a month to keep it on the road.’ On a take-home salary of £3,000 per month — approximately the UK median — that is 30% of net income going to a single depreciating asset. Housing, the other major expense, at least stays still or goes up in value. The car goes only in one direction: down.
This article does not argue that nobody should own a car. Many people have a genuine, unavoidable transport requirement that a car alone can meet. What it does argue is that the financial cost of the car choice most commonly made — new or near-new, on PCP finance, upgraded every three to four years — is dramatically and consistently underestimated, and that the compound wealth cost of that underestimation is one of the primary reasons why people who earn reasonable incomes fail to build meaningful wealth. The car is the wealth killer that sits on the driveway and smiles. Not financial advice.
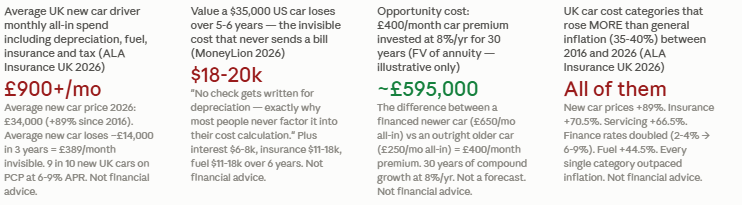
Average new car price UK 2026: £34,000 (+89% since 2016). Average new car driver spending >£900/month all-in (ALA Insurance UK 2026). Nine in ten new cars bought on PCP finance at 6-9% APR (ALA Insurance UK 2026). Average new car loses ~£14,000 in value in three years (ALA Insurance UK 2026). US: average new car price crossing $50,000; auto loan payments >$745/month (Graham Stephan Substack 2025). $35,000 car loses $18,000-$20,000 in value over 5-6 years (MoneyLion 2026). Cars, housing, and taxes are the three biggest expenses most people face. Sources: ALA Insurance UK 2026; Carsa.co.uk 2026; ExchangeMyCar 2026; Graham Stephan 2025; MoneyLion 2026. Not financial advice.
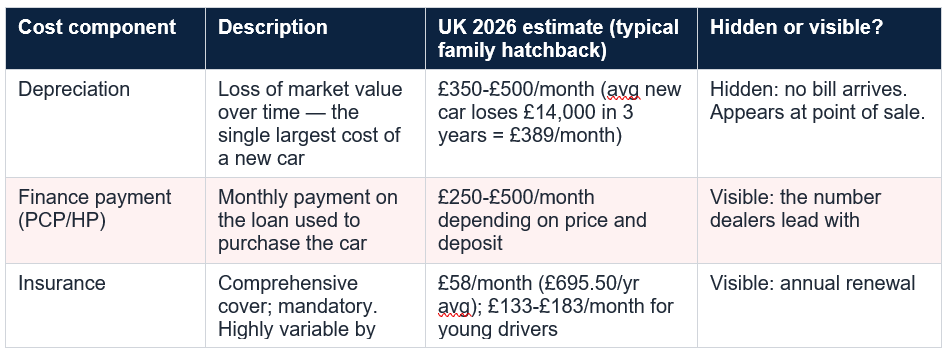
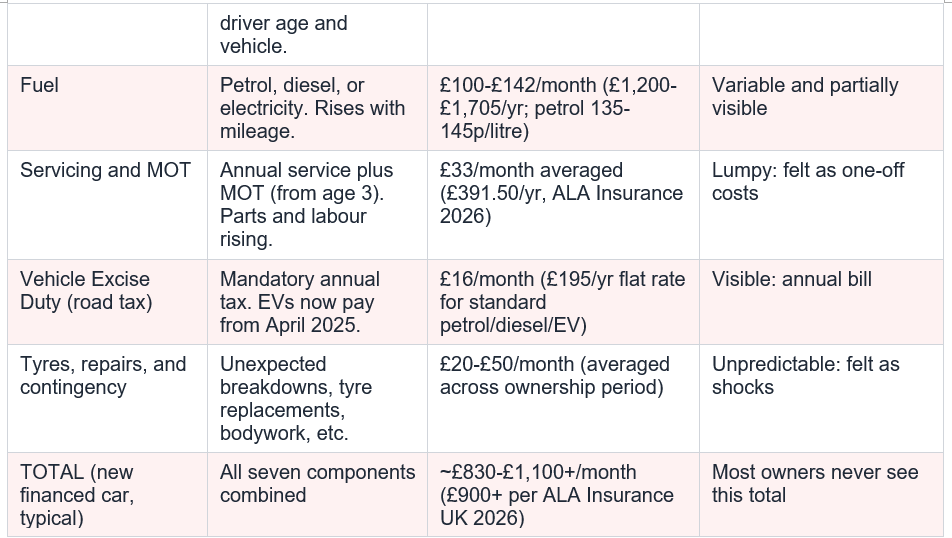
The mechanics of new car depreciation are well-established. A new car loses approximately 10% of its value the moment it is driven off the forecourt — because it is now a used car. From there, it continues to depreciate at approximately 15–35% per year in the first three years. In the UK, ALA Insurance (2026) found that the average new car loses approximately £14,000 in value over three years. On a £34,000 average new car, that is approximately £389 per month in pure value destruction — not paid to anyone, not usable for anything, simply gone. A UK driver with a new £34,000 car on PCP finance might be paying £450/month in finance payments and believe that is the cost. In reality, the depreciation alone is adding a further £389/month in invisible loss.
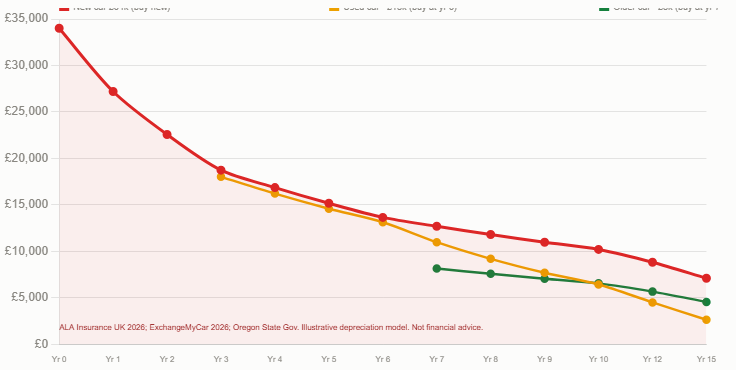
The depreciation curve is not linear. It is steepest in the first three years, then flattens significantly. A four-to-six year old car of the same model depreciates far more slowly, because the steepest part of the curve has already been absorbed by the first owner. This is the financial logic behind buying a used car: you pay a lower price, absorb the flat part of the curve, and sell with less value destruction. Not financial advice.
The depreciation trap: the average new UK car (£34,000) loses approximately £14,000 in three years = £389/month in invisible value destruction (ALA Insurance UK 2026). The finance payment on the same car: approximately £400-£500/month. Combined: the car is costing £789-£889/month before fuel, insurance, or road tax. The typical buyer sees only the finance payment. The depreciation is the silent co-payment that appears only at trade-in. In the US: a $35,000 car loses $18,000-$20,000 over 5-6 years (MoneyLion 2026). 'No check gets written for depreciation, which is exactly why most people never factor it into their cost calculation.' Not financial advice.
PCP finance rates in the UK have increased from approximately 2–4% in 2016 to 6–9% in 2026, according to ALA Insurance. On a £22,000 used car financed over 48 months at 8% APR with a £2,200 deposit, the monthly payment is approximately £520. Over 48 months, the total paid is approximately £24,960 plus the deposit — £27,160 — on a car worth approximately £12,000–£13,000 at the end of the term. The car’s residual value at the end of a PCP term is typically set as the ‘guaranteed minimum future value’ (GMFV) — the amount the manufacturer guarantees the car will be worth. Most buyers who hand back the car at the end of the term have paid substantially for three to four years of use and have zero equity to show for it.
The upgrade cycle that PCP encourages — hand back, start again, always have a new-ish car — is a permanent subscription to the steepest part of the depreciation curve. Every three to four years, the buyer re-enters a new car with a new set of front-loaded interest charges and a new round of 15–35% annual depreciation on a higher purchase price. The wealth cost is not in any single cycle; it is in the perpetual motion of the cycle itself. Not financial advice.
Simon England, founder and MD of ALA Insurance (UK, 2026): 'Most people buying a new car are handed a monthly payment and told that is the cost, but it isn't that simple. Once you account for depreciation, fuel, insurance and tax, the average new car driver is spending well over £900 a month to keep it on the road.' PCP finance rates increased from 2-4% in 2016 to 6-9% in 2026. Around nine in ten new cars are now purchased using finance agreements. Source: ALA Insurance / ala.co.uk, 2026. Not financial advice.
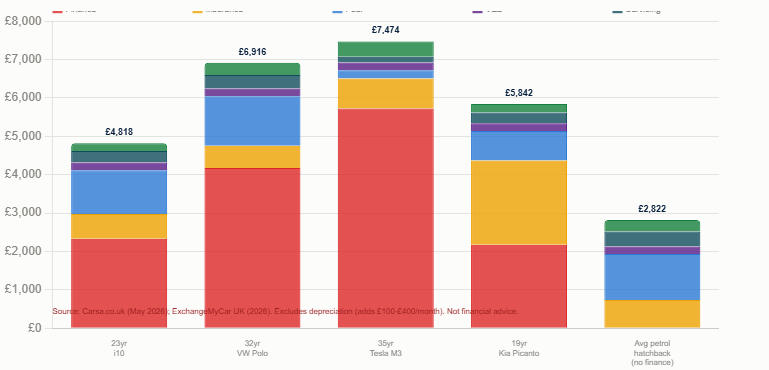
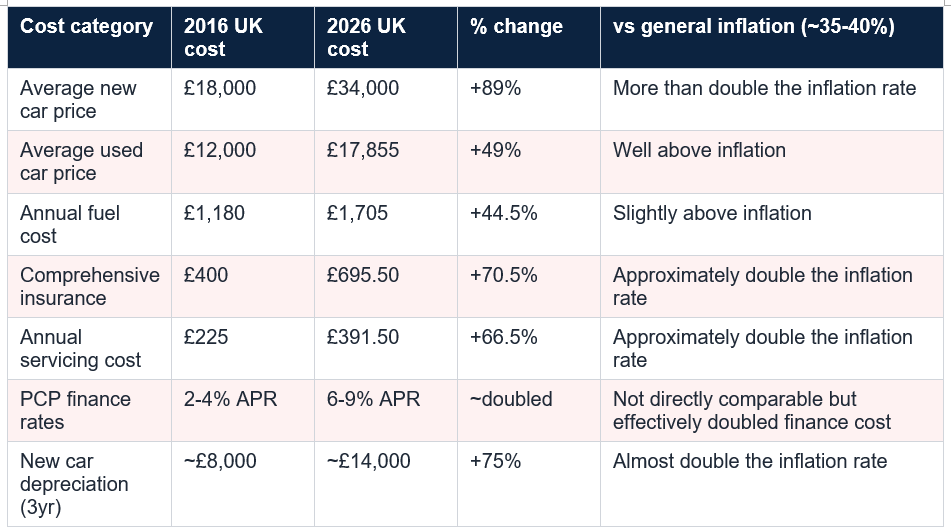
The practical consequence: a car that was financially manageable in 2016 is materially more expensive in 2026, even for the same type of vehicle. The 32-year-old who financed a comparable Volkswagen Polo in 2016 and paid approximately £380/month all-in is now paying approximately £576/month for an equivalent car — a 52% real-terms increase against 35–40% general inflation (Carsa.co.uk, May 2026). The take-home salary growth for most workers over the same period has not kept pace with this specific cost increase.
For young drivers, the situation is even more extreme. A 19-year-old with a 2020 Kia Picanto and telematics insurance is paying approximately £487/month all-in (Carsa.co.uk, 2026), of which £183/month is insurance alone — more than some older drivers pay in total monthly finance. Insurance for new drivers (17–19) ranges from £1,600 to £2,200+ per year. For young people trying to build an emergency fund, save for a deposit, or invest for the first time, the car is often the single most damaging financial commitment they make in their twenties. Not financial advice.
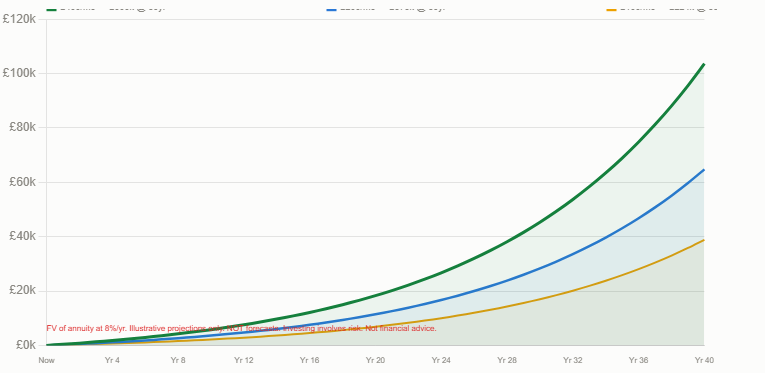
Consider a 28-year-old who upgrades from a £4,000 car bought outright (costing approximately £250/month all-in for running costs, no finance) to a financed £22,000 car (costing approximately £650/month all-in). The premium — the additional monthly cost of the upgrade — is approximately £400/month. That £400/month, invested in a Stocks and Shares ISA at 8% annual return from age 28 to 65, produces approximately £878,000 in compound wealth (FV of annuity formula; illustrative; not a forecast). Not because of anything unusual — simply because of the compound growth of money not spent on a car that was not needed at that specification.
The reverse calculation is equally striking. A 28-year-old who decides at 28 to keep buying older, outright cars for life and invest the difference is not sacrificing their mobility; they are sacrificing a slightly newer dashboard and a slightly more recent number plate, in exchange for potential retirement security. The car is a transport device. Its primary function is identical whether it was registered three years ago or seven years ago. The difference in function is zero. The difference in cost — and in compound wealth — is enormous. Not financial advice.
The wealth cost of the 'upgrade': difference between £250/month (older outright car) and £650/month (financed newer car) = £400/month premium. At 8%/yr for 30 years: approximately £595,000 in foregone compound wealth. At 8%/yr for 37 years (age 28 to 65): approximately £878,000. The car is costing not just the monthly payment but the compounding future value of everything that monthly payment could have become. All projections use FV of annuity formula at stated rate. Not forecasts. Investing involves risk. Not financial advice.
Each new PCP cycle restarts the depreciation clock on a new vehicle, ensuring the buyer permanently occupies the steepest part of the depreciation curve (years 1–3). Each new cycle resets the interest amortisation schedule, meaning interest charges are front-loaded into every new agreement. Each new cycle incurs arrangement fees, optional extras added at the point of purchase (GAP insurance, paint protection, extended warranty), and the psychological pressure of the showroom environment.
A household that runs two cars on permanent PCP cycles — both replaced every three to four years — is likely spending £1,200–£1,800 per month between the two vehicles, including all costs. That is £14,400–£21,600 per year — equivalent to a significant fraction of many households’ post-tax income, committed entirely to assets that are simultaneously depreciating and generating running costs. Not financial advice.
The PCP cycle: hand back → restart = permanent residency on the steepest depreciation slope. Each new car absorbs year 1-3 losses (heaviest depreciation). Interest is front-loaded into each new agreement. Transaction costs (arrangement fees, GAP insurance, extras) repeat every 3-4 years. The 'always have a new car' lifestyle requires a permanent monthly commitment equal to approximately £450-£600/month per vehicle. A household with two PCP cycles running simultaneously is spending £900-£1,200/month in finance payments alone — before fuel, insurance, or road tax. Not financial advice.
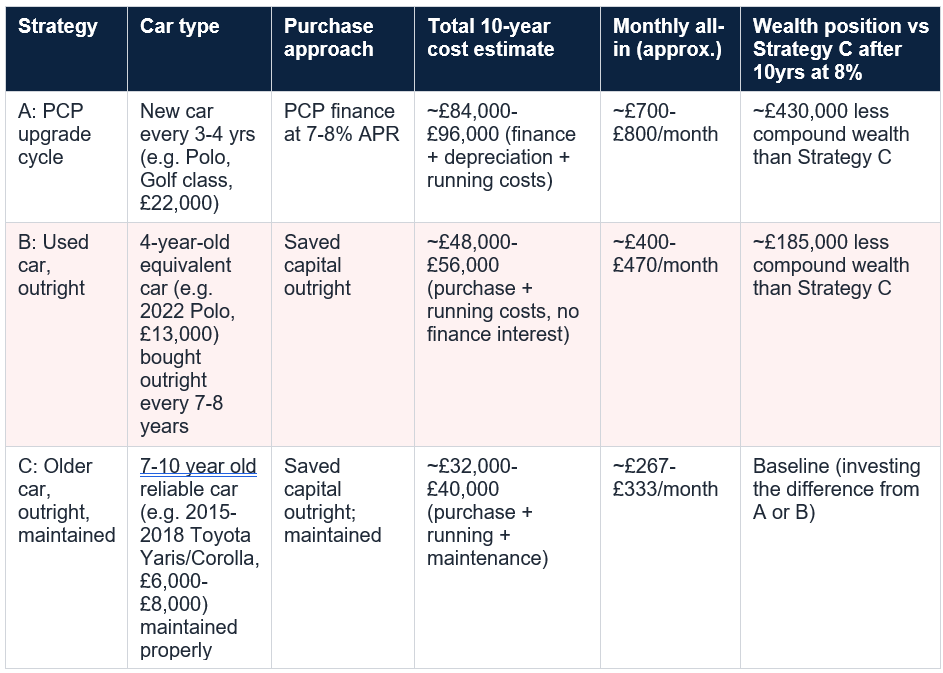
All figures are illustrative estimates. Actual costs vary by vehicle, driver, insurer, and market conditions. The compound wealth comparison assumes the difference between each strategy and Strategy C is invested at 8%/yr for 10 years. Not forecasts. Investing involves risk. Not financial advice. Individual circumstances vary.
The social pressure around car ownership is real and documented. Three of the biggest expenses most people face are housing, cars, and taxes (VoiceTube/financial education summary). While housing and taxes are largely fixed or location-determined, the car choice is almost entirely discretionary — which means it is almost entirely susceptible to social comparison and lifestyle inflation pressure. The person who drives a seven-year-old Toyota Corolla is making a financially rational choice; the peer pressure to upgrade is making a psychologically motivated argument dressed in financial language.
The genuinely wealthy — as distinct from the visibly high-income — are disproportionately likely to own modest, reliable cars outright. The financial biography of high-net-worth individuals consistently shows frugality on transport and investment on assets that appreciate. The car on the driveway is a signal of what was spent, not of what was saved. Not financial advice.
MoneyLion (2026) breaks down the cost of a $35,000 car over six years: depreciation alone is $18,000–$20,000 (50–60% of the purchase price); interest adds $6,000–$8,000 on a financed purchase; insurance adds $11,000–$18,000; fuel adds $11,000–$18,000. Total six-year cost: approximately $46,000–$64,000 on a car that cost $35,000 and is now worth approximately $14,000–$18,000. The key insight MoneyLion identifies: ‘No check gets written for depreciation, which is exactly why most people never factor it into their cost calculation.’
The pattern is structurally identical to the UK model but at higher absolute numbers. The American who chooses a modest, reliable used car — a 2018 Toyota Camry at $12,000 paid outright — over a $50,000 financed truck or SUV is making a decision worth, in compound terms, several hundred thousand dollars over a working career. Not financial advice.
US car wealth calculation: $745/month auto loan payment. If $400/month of that (the premium over a minimal-transport alternative at $345/month running costs) were invested at 8%/yr for 30 years: approximately $595,000 in foregone compound wealth. The full $745/month invested at 8%/yr for 30 years: approximately $1.1 million. For context: the average US Social Security benefit in 2026 is approximately $15,000-$20,000/year. The car payments over a career, invested instead, could fund a retirement. All projections use FV of annuity at stated rate. Not forecasts. Investing involves risk. Not financial advice.
The average UK new car driver is spending over £900 per month, according to ALA Insurance (2026). At that rate, over a 35-year career, the cumulative spend is approximately £378,000 — on assets that are worth a small fraction of that total by the time the last one is sold. The compound wealth cost of the same money invested at 8%/yr for 35 years is approximately £1.85 million (FV of annuity formula; illustrative; not a forecast). The car is not just a monthly cost. It is a lifetime wealth allocation decision, made repeatedly and mostly without full information.
The information in this article is the full picture. With it, the decision about what to drive and how to finance it becomes what it always should have been: an informed calculation rather than a monthly payment comparison. Not financial, investment, or consumer advice. Individual circumstances vary. Always consult a qualified independent financial adviser before making major financial decisions.
Cars are considered the number 1 wealth killer because they combine the worst financial characteristics of any major expenditure: they are large in cost, mandatory in running expenses, guaranteed to fall in value (depreciate), and typically financed with interest on top. The housing cost comparison: a house can appreciate in value while you live in it. The pension comparison: pension contributions compound and grow. The car is the only major household expenditure that is guaranteed to be worth less next year than it is today while simultaneously generating significant ongoing costs. The ALA Insurance UK 2026 data shows the average new car driver spending over £900/month once all costs are included — on an asset losing approximately £14,000 in value over three years. In the US, a $35,000 car loses $18,000-$20,000 in value over 5-6 years (MoneyLion 2026). The opportunity cost — what the same monthly expenditure, invested at market rates, would produce over a career — is in the hundreds of thousands of pounds or dollars. Not financial advice.
How much does a car really cost per month in the UK in 2026?
The true monthly cost of car ownership in the UK in 2026 depends on the car and the driver, but ALA Insurance (2026) found that the average new car driver is spending 'well over £900 a month' once depreciation, fuel, insurance and tax are included. Carsa.co.uk (May 2026) provides real examples: a 32-year-old driving a financed VW Polo pays approximately £576/month all-in; a 35-year-old with a Tesla Model 3 pays approximately £623/month; a 19-year-old new driver pays approximately £487/month (with insurance being the dominant cost at £2,200/year with telematics). ExchangeMyCar UK (2026) estimates a typical petrol hatchback costs £3,500-£4,000/year (approximately £300/month) excluding finance. Including finance: small city cars around £400-£550/month; family hatchbacks £550-£750/month; premium vehicles £900+/month (MotorEasy/bobatoo 2026). Not financial advice. Individual costs vary significantly.
Is it better to buy a new or used car for your finances?
Financially, a used car is almost always better than a new car for the same transport function. The reason is depreciation: a new car loses approximately 10% of its value immediately when driven off the forecourt, then 15-35% per year in the first three years. A 3-4 year old car of the same model is available at approximately 55-70% of the new car price, because the steepest part of the depreciation curve has already been absorbed by the first owner. ALA Insurance UK (2026) data confirms: average new car £34,000 vs average used car £17,855 — the used car is 47% cheaper at purchase, with slower subsequent depreciation. For most people with a genuine transport need rather than a status need, a 3-6 year old car bought outright or with a minimal loan, maintained properly and kept for 7-10 years, represents the most financially rational car ownership model. Not financial advice.
What is PCP finance and why is it financially risky?
PCP (Personal Contract Purchase) is a finance agreement where the buyer pays a monthly charge over 2-4 years, then either makes a large 'balloon payment' to own the car outright or hands the car back and starts a new agreement. Around nine in ten new cars sold in the UK in 2026 are bought on PCP (ALA Insurance 2026). PCP rates in 2026 are approximately 6-9% APR (up from 2-4% in 2016). PCP is financially risky because: (1) it encourages constant upgrading, keeping the buyer permanently on the steepest part of the depreciation curve; (2) at the end of a PCP term, buyers who hand the car back have paid for 3-4 years of depreciation and interest with nothing to show for it; (3) the arrangement strongly benefits the finance provider and manufacturer (who maximises new car sales), not the buyer; (4) finance charges have doubled while vehicle prices have risen 89% since 2016 (ALA Insurance UK 2026). The monthly payment is the most visible and the least informative measure of the true cost. Not financial advice.
How much wealth could I build if I spent less on a car?
The compound wealth calculation depends on the monthly saving and the time horizon, but the figures are substantial. The difference between a financed newer car at £650/month all-in and an outright older car at £250/month all-in is £400/month. That £400/month invested at 8%/yr in a Stocks and Shares ISA for 30 years produces approximately £595,000 (FV of annuity formula; illustrative; not a forecast). For 37 years (a full career): approximately £878,000. In the US, $400/month invested at 8%/yr for 30 years = approximately $595,000. The point is not that everyone should drive a 15-year-old car; it is that the car specification decision is simultaneously a financial decision of enormous long-term consequence, and most people make it based only on the monthly payment. Investing involves risk including possible loss of principal. Not financial advice. Past performance does not predict future results.
Table of Contents
- The Expense Nobody Totals Up
- What a Car Actually Costs: The Seven Components
- Depreciation: The Invisible Drain That Never Sends a Bill
- The PCP Finance Trap: Nine in Ten New UK Cars
- UK Running Costs 2026: The Real Annual Figures
- The Opportunity Cost: What Your Car Payments Could Build
- The ‘Upgrade Cycle’ Trap: Why PCP Every 3–4 Years Destroys Wealth
- The Three-Car Universe: A Cost Comparison
- Cars as Status Signals vs Cars as Transport
- The US Picture: $50,000 Average New Car, $745/Month Payments
- When a Car IS Worth the Money
- The Smarter Approach: Four Strategies That Preserve Wealth
- Conclusion: The Most Expensive Thing You Own That Falls in Value
- Frequently Asked Questions
Depreciation curve — the invisible wealth drain
True monthly costs — UK 2026 breakdown by driver
Opportunity cost — what car money could build
The Expense Nobody Totals Up
Ask someone what their car costs, and they will almost always give you the monthly finance payment. This is the figure the dealership leads with, the figure that appears in the advertising, and the figure around which most car-buying decisions are made. It is also the smallest component of the true monthly cost of owning a car.Simon England, founder and MD of ALA Insurance (UK, 2026), identifies the gap directly: ‘Most people buying a new car are handed a monthly payment and told that is the cost, but it isn’t that simple. Once you account for depreciation, fuel, insurance and tax, the average new car driver is spending well over £900 a month to keep it on the road.’ On a take-home salary of £3,000 per month — approximately the UK median — that is 30% of net income going to a single depreciating asset. Housing, the other major expense, at least stays still or goes up in value. The car goes only in one direction: down.
This article does not argue that nobody should own a car. Many people have a genuine, unavoidable transport requirement that a car alone can meet. What it does argue is that the financial cost of the car choice most commonly made — new or near-new, on PCP finance, upgraded every three to four years — is dramatically and consistently underestimated, and that the compound wealth cost of that underestimation is one of the primary reasons why people who earn reasonable incomes fail to build meaningful wealth. The car is the wealth killer that sits on the driveway and smiles. Not financial advice.
Average new car price UK 2026: £34,000 (+89% since 2016). Average new car driver spending >£900/month all-in (ALA Insurance UK 2026). Nine in ten new cars bought on PCP finance at 6-9% APR (ALA Insurance UK 2026). Average new car loses ~£14,000 in value in three years (ALA Insurance UK 2026). US: average new car price crossing $50,000; auto loan payments >$745/month (Graham Stephan Substack 2025). $35,000 car loses $18,000-$20,000 in value over 5-6 years (MoneyLion 2026). Cars, housing, and taxes are the three biggest expenses most people face. Sources: ALA Insurance UK 2026; Carsa.co.uk 2026; ExchangeMyCar 2026; Graham Stephan 2025; MoneyLion 2026. Not financial advice.
What a Car Actually Costs: The Seven Components
The true monthly cost of owning a car has seven components. The finance payment is the only one most buyers consider fully. The others — depreciation, insurance, fuel, servicing, road tax, and tyres and repairs — accumulate invisibly in the background and, in aggregate, often exceed the finance payment itself.
Depreciation: The Invisible Drain That Never Sends a Bill
Depreciation is the largest single cost of car ownership and the one that most completely disappears from the monthly calculation. No bill arrives in the post for depreciation. No direct debit processes. No app notification flags it. It accumulates silently in the background, and then it appears — all at once, brutally — at the moment of sale, when the trade-in or private-sale valuation is £14,000 lower than the purchase price three years earlier.The mechanics of new car depreciation are well-established. A new car loses approximately 10% of its value the moment it is driven off the forecourt — because it is now a used car. From there, it continues to depreciate at approximately 15–35% per year in the first three years. In the UK, ALA Insurance (2026) found that the average new car loses approximately £14,000 in value over three years. On a £34,000 average new car, that is approximately £389 per month in pure value destruction — not paid to anyone, not usable for anything, simply gone. A UK driver with a new £34,000 car on PCP finance might be paying £450/month in finance payments and believe that is the cost. In reality, the depreciation alone is adding a further £389/month in invisible loss.
The depreciation curve is not linear. It is steepest in the first three years, then flattens significantly. A four-to-six year old car of the same model depreciates far more slowly, because the steepest part of the curve has already been absorbed by the first owner. This is the financial logic behind buying a used car: you pay a lower price, absorb the flat part of the curve, and sell with less value destruction. Not financial advice.
The depreciation trap: the average new UK car (£34,000) loses approximately £14,000 in three years = £389/month in invisible value destruction (ALA Insurance UK 2026). The finance payment on the same car: approximately £400-£500/month. Combined: the car is costing £789-£889/month before fuel, insurance, or road tax. The typical buyer sees only the finance payment. The depreciation is the silent co-payment that appears only at trade-in. In the US: a $35,000 car loses $18,000-$20,000 over 5-6 years (MoneyLion 2026). 'No check gets written for depreciation, which is exactly why most people never factor it into their cost calculation.' Not financial advice.
The PCP Finance Trap: Nine in Ten New UK Cars
Nine in ten new cars sold in the UK in 2026 are purchased using a PCP (Personal Contract Purchase) finance agreement, according to ALA Insurance. PCP is a product in which the buyer pays a monthly charge over a two-to-four year term, then faces a ‘balloon payment’ at the end to own the car outright, or hands the car back and starts a new agreement on a new car. PCP is structured specifically to encourage the second option — and the second option is the financially catastrophic one.PCP finance rates in the UK have increased from approximately 2–4% in 2016 to 6–9% in 2026, according to ALA Insurance. On a £22,000 used car financed over 48 months at 8% APR with a £2,200 deposit, the monthly payment is approximately £520. Over 48 months, the total paid is approximately £24,960 plus the deposit — £27,160 — on a car worth approximately £12,000–£13,000 at the end of the term. The car’s residual value at the end of a PCP term is typically set as the ‘guaranteed minimum future value’ (GMFV) — the amount the manufacturer guarantees the car will be worth. Most buyers who hand back the car at the end of the term have paid substantially for three to four years of use and have zero equity to show for it.
The upgrade cycle that PCP encourages — hand back, start again, always have a new-ish car — is a permanent subscription to the steepest part of the depreciation curve. Every three to four years, the buyer re-enters a new car with a new set of front-loaded interest charges and a new round of 15–35% annual depreciation on a higher purchase price. The wealth cost is not in any single cycle; it is in the perpetual motion of the cycle itself. Not financial advice.
Simon England, founder and MD of ALA Insurance (UK, 2026): 'Most people buying a new car are handed a monthly payment and told that is the cost, but it isn't that simple. Once you account for depreciation, fuel, insurance and tax, the average new car driver is spending well over £900 a month to keep it on the road.' PCP finance rates increased from 2-4% in 2016 to 6-9% in 2026. Around nine in ten new cars are now purchased using finance agreements. Source: ALA Insurance / ala.co.uk, 2026. Not financial advice.
UK Running Costs 2026: The Real Annual Figures
The ALA Insurance 2026 decade comparison provides the most useful dataset for understanding how car costs have moved relative to general inflation. General inflation in the UK between 2016 and 2026 was approximately 35–40%. Over the same period: new car prices rose 89%, insurance premiums rose 70.5%, servicing costs rose 66.5%, and finance costs approximately doubled (rates from 2–4% to 6–9%). Every major cost category of car ownership has risen at two to three times the rate of general inflation.The practical consequence: a car that was financially manageable in 2016 is materially more expensive in 2026, even for the same type of vehicle. The 32-year-old who financed a comparable Volkswagen Polo in 2016 and paid approximately £380/month all-in is now paying approximately £576/month for an equivalent car — a 52% real-terms increase against 35–40% general inflation (Carsa.co.uk, May 2026). The take-home salary growth for most workers over the same period has not kept pace with this specific cost increase.
For young drivers, the situation is even more extreme. A 19-year-old with a 2020 Kia Picanto and telematics insurance is paying approximately £487/month all-in (Carsa.co.uk, 2026), of which £183/month is insurance alone — more than some older drivers pay in total monthly finance. Insurance for new drivers (17–19) ranges from £1,600 to £2,200+ per year. For young people trying to build an emergency fund, save for a deposit, or invest for the first time, the car is often the single most damaging financial commitment they make in their twenties. Not financial advice.
The Opportunity Cost: What Your Car Payments Could Build
The most devastating financial argument against the typical UK car ownership model is not the headline cost figure — it is what that same money, redirected to investment, would build over time. This is the opportunity cost: the wealth not accumulated because the money was committed to a depreciating asset instead.Consider a 28-year-old who upgrades from a £4,000 car bought outright (costing approximately £250/month all-in for running costs, no finance) to a financed £22,000 car (costing approximately £650/month all-in). The premium — the additional monthly cost of the upgrade — is approximately £400/month. That £400/month, invested in a Stocks and Shares ISA at 8% annual return from age 28 to 65, produces approximately £878,000 in compound wealth (FV of annuity formula; illustrative; not a forecast). Not because of anything unusual — simply because of the compound growth of money not spent on a car that was not needed at that specification.
The reverse calculation is equally striking. A 28-year-old who decides at 28 to keep buying older, outright cars for life and invest the difference is not sacrificing their mobility; they are sacrificing a slightly newer dashboard and a slightly more recent number plate, in exchange for potential retirement security. The car is a transport device. Its primary function is identical whether it was registered three years ago or seven years ago. The difference in function is zero. The difference in cost — and in compound wealth — is enormous. Not financial advice.
The wealth cost of the 'upgrade': difference between £250/month (older outright car) and £650/month (financed newer car) = £400/month premium. At 8%/yr for 30 years: approximately £595,000 in foregone compound wealth. At 8%/yr for 37 years (age 28 to 65): approximately £878,000. The car is costing not just the monthly payment but the compounding future value of everything that monthly payment could have become. All projections use FV of annuity formula at stated rate. Not forecasts. Investing involves risk. Not financial advice.
The ‘Upgrade Cycle’ Trap: Why PCP Every 3–4 Years Destroys Wealth
The PCP upgrade cycle — hand back the car after three to four years, start a new agreement on a new car, always have a vehicle with fewer than four years of age on the clock — is the most expensive car ownership model available. It combines every financial disadvantage of car ownership into a single, perpetual structure.Each new PCP cycle restarts the depreciation clock on a new vehicle, ensuring the buyer permanently occupies the steepest part of the depreciation curve (years 1–3). Each new cycle resets the interest amortisation schedule, meaning interest charges are front-loaded into every new agreement. Each new cycle incurs arrangement fees, optional extras added at the point of purchase (GAP insurance, paint protection, extended warranty), and the psychological pressure of the showroom environment.
A household that runs two cars on permanent PCP cycles — both replaced every three to four years — is likely spending £1,200–£1,800 per month between the two vehicles, including all costs. That is £14,400–£21,600 per year — equivalent to a significant fraction of many households’ post-tax income, committed entirely to assets that are simultaneously depreciating and generating running costs. Not financial advice.
The PCP cycle: hand back → restart = permanent residency on the steepest depreciation slope. Each new car absorbs year 1-3 losses (heaviest depreciation). Interest is front-loaded into each new agreement. Transaction costs (arrangement fees, GAP insurance, extras) repeat every 3-4 years. The 'always have a new car' lifestyle requires a permanent monthly commitment equal to approximately £450-£600/month per vehicle. A household with two PCP cycles running simultaneously is spending £900-£1,200/month in finance payments alone — before fuel, insurance, or road tax. Not financial advice.
The Three-Car Universe: A Cost Comparison
The wealth impact of different car ownership strategies becomes most visible when compared side by side across a 10-year period. The three-car universe sets three approaches against each other: the PCP upgrade cycle, the four-year-old used car bought outright, and the older car bought outright and maintained.All figures are illustrative estimates. Actual costs vary by vehicle, driver, insurer, and market conditions. The compound wealth comparison assumes the difference between each strategy and Strategy C is invested at 8%/yr for 10 years. Not forecasts. Investing involves risk. Not financial advice. Individual circumstances vary.
Cars as Status Signals vs Cars as Transport
The financial cost of cars in the UK and US is so high partly because cars do not function purely as transport devices. They function as status signals — communicating income, taste, success, and social position to an audience of peers, colleagues, and strangers. The financial conversation in a car dealership is rarely ‘what is the cheapest way to get from A to B?’ It is almost always ‘what is the best car I can afford on my monthly budget?’ — and ‘afford’ means ‘can service the PCP payment,’ not ‘can purchase outright without financial strain.’The social pressure around car ownership is real and documented. Three of the biggest expenses most people face are housing, cars, and taxes (VoiceTube/financial education summary). While housing and taxes are largely fixed or location-determined, the car choice is almost entirely discretionary — which means it is almost entirely susceptible to social comparison and lifestyle inflation pressure. The person who drives a seven-year-old Toyota Corolla is making a financially rational choice; the peer pressure to upgrade is making a psychologically motivated argument dressed in financial language.
The genuinely wealthy — as distinct from the visibly high-income — are disproportionately likely to own modest, reliable cars outright. The financial biography of high-net-worth individuals consistently shows frugality on transport and investment on assets that appreciate. The car on the driveway is a signal of what was spent, not of what was saved. Not financial advice.
The US Picture: $50,000 Average New Car, $745 Monthly Payments
In the United States, the wealth-killing dynamic of car ownership has reached an extreme that is beginning to produce measurable financial distress at a systemic level. Graham Stephan (Substack, 2025) documents the conditions: the average price of a new car is set to cross $50,000; auto loan payments are exceeding $745 per month; and Americans are falling behind on car payments at levels of repossession not seen since the 2008 financial crisis.MoneyLion (2026) breaks down the cost of a $35,000 car over six years: depreciation alone is $18,000–$20,000 (50–60% of the purchase price); interest adds $6,000–$8,000 on a financed purchase; insurance adds $11,000–$18,000; fuel adds $11,000–$18,000. Total six-year cost: approximately $46,000–$64,000 on a car that cost $35,000 and is now worth approximately $14,000–$18,000. The key insight MoneyLion identifies: ‘No check gets written for depreciation, which is exactly why most people never factor it into their cost calculation.’
The pattern is structurally identical to the UK model but at higher absolute numbers. The American who chooses a modest, reliable used car — a 2018 Toyota Camry at $12,000 paid outright — over a $50,000 financed truck or SUV is making a decision worth, in compound terms, several hundred thousand dollars over a working career. Not financial advice.
US car wealth calculation: $745/month auto loan payment. If $400/month of that (the premium over a minimal-transport alternative at $345/month running costs) were invested at 8%/yr for 30 years: approximately $595,000 in foregone compound wealth. The full $745/month invested at 8%/yr for 30 years: approximately $1.1 million. For context: the average US Social Security benefit in 2026 is approximately $15,000-$20,000/year. The car payments over a career, invested instead, could fund a retirement. All projections use FV of annuity at stated rate. Not forecasts. Investing involves risk. Not financial advice.
When a Car IS Worth the Money
The argument that cars destroy wealth does not mean every car purchase is irrational or that everyone should cycle everywhere. There are genuine circumstances in which specific car ownership choices make financial and practical sense.- Essential transport: for people in rural areas without public transport infrastructure, for trades and professions that require a vehicle, and for families with specific mobility requirements, a car is a genuine necessity. The argument is not against the car; it is against the specification and financing method of the car.
- A reliable, outright-purchased used car: buying a 3–6 year old car outright with savings, keeping it for 7–10 years, maintaining it properly, and selling it when major costs begin to exceed its value is the financially rational version of car ownership. The depreciation curve is flat, there is no interest cost, and the total expenditure is a fraction of the PCP cycle.
- Genuine professional need for a newer vehicle: some roles require a car that presents professionally — client-facing sales, estate agency, certain medical roles. In these cases, the car has a genuine income-generating function that justifies a higher specification. The cost is still worth knowing precisely.
- A company car or salary sacrifice scheme: employer-provided vehicles or salary sacrifice schemes (particularly for EVs in the UK, which attract low benefit-in-kind rates) can provide genuinely cost-effective vehicle access. These are worth modelling against the private ownership alternative. Not financial advice.
The Smarter Approach: Four Strategies That Preserve Wealth
The goal is not to eliminate car ownership. It is to make the car choice with full knowledge of the true cost, and to optimise the decision within the genuine transport requirement. Four strategies consistently reduce the wealth damage of car ownership.- Buy outright, not on finance. The interest cost of PCP or HP finance at 6–9% APR on a car that is simultaneously depreciating at 15–35% per year is a double drain: the car gets cheaper while the money gets more expensive. Saving for a car purchase and buying outright removes the interest cost entirely. The psychological discipline required to save is the cost of this approach; the financial outcome is significantly better.
- Buy used, at year 3–4. The steepest depreciation on most cars occurs in years 1–3. A car bought at year 3–4 — when the original owner has absorbed the steepest losses — provides the same mechanical function at 55–70% of the new price. ALA Insurance (2026) confirms the average used car price is £17,855 vs £34,000 for new: the used car is 47% cheaper at the point of purchase, with far less subsequent depreciation.
- Keep the car for longer. Every additional year a car is held, the annual depreciation cost falls. A car held for ten years has a dramatically lower average annual depreciation than one held for three. Maintenance costs may rise, but they rise slowly and are fully visible; depreciation falls and falls. A well-maintained seven-year-old car is almost always cheaper per mile than a new one.
- Right-size the car to the need. The difference between a £8,000 reliable small car and a £25,000 aspirational SUV is not primarily one of transport function. It is primarily one of status signalling. The smaller car arrives at the destination in the same amount of time. The compound wealth cost of the difference is, over a career, substantial. Not financial advice.
Conclusion
A car is, for most households in the UK and US, the largest discretionary expense they make — and the only major one that is guaranteed to be worth less next year than it is today. Housing is expensive but can appreciate. A pension is expensive but accumulates. An ISA is expensive but compounds. A car is expensive and depreciates, generates running costs on top of the depreciation, and is typically financed at interest rates that add a further layer of cost to an already deteriorating asset.The average UK new car driver is spending over £900 per month, according to ALA Insurance (2026). At that rate, over a 35-year career, the cumulative spend is approximately £378,000 — on assets that are worth a small fraction of that total by the time the last one is sold. The compound wealth cost of the same money invested at 8%/yr for 35 years is approximately £1.85 million (FV of annuity formula; illustrative; not a forecast). The car is not just a monthly cost. It is a lifetime wealth allocation decision, made repeatedly and mostly without full information.
The information in this article is the full picture. With it, the decision about what to drive and how to finance it becomes what it always should have been: an informed calculation rather than a monthly payment comparison. Not financial, investment, or consumer advice. Individual circumstances vary. Always consult a qualified independent financial adviser before making major financial decisions.
Frequently Asked Questions
Why is a car considered the number 1 wealth killer?Cars are considered the number 1 wealth killer because they combine the worst financial characteristics of any major expenditure: they are large in cost, mandatory in running expenses, guaranteed to fall in value (depreciate), and typically financed with interest on top. The housing cost comparison: a house can appreciate in value while you live in it. The pension comparison: pension contributions compound and grow. The car is the only major household expenditure that is guaranteed to be worth less next year than it is today while simultaneously generating significant ongoing costs. The ALA Insurance UK 2026 data shows the average new car driver spending over £900/month once all costs are included — on an asset losing approximately £14,000 in value over three years. In the US, a $35,000 car loses $18,000-$20,000 in value over 5-6 years (MoneyLion 2026). The opportunity cost — what the same monthly expenditure, invested at market rates, would produce over a career — is in the hundreds of thousands of pounds or dollars. Not financial advice.
How much does a car really cost per month in the UK in 2026?
The true monthly cost of car ownership in the UK in 2026 depends on the car and the driver, but ALA Insurance (2026) found that the average new car driver is spending 'well over £900 a month' once depreciation, fuel, insurance and tax are included. Carsa.co.uk (May 2026) provides real examples: a 32-year-old driving a financed VW Polo pays approximately £576/month all-in; a 35-year-old with a Tesla Model 3 pays approximately £623/month; a 19-year-old new driver pays approximately £487/month (with insurance being the dominant cost at £2,200/year with telematics). ExchangeMyCar UK (2026) estimates a typical petrol hatchback costs £3,500-£4,000/year (approximately £300/month) excluding finance. Including finance: small city cars around £400-£550/month; family hatchbacks £550-£750/month; premium vehicles £900+/month (MotorEasy/bobatoo 2026). Not financial advice. Individual costs vary significantly.
Is it better to buy a new or used car for your finances?
Financially, a used car is almost always better than a new car for the same transport function. The reason is depreciation: a new car loses approximately 10% of its value immediately when driven off the forecourt, then 15-35% per year in the first three years. A 3-4 year old car of the same model is available at approximately 55-70% of the new car price, because the steepest part of the depreciation curve has already been absorbed by the first owner. ALA Insurance UK (2026) data confirms: average new car £34,000 vs average used car £17,855 — the used car is 47% cheaper at purchase, with slower subsequent depreciation. For most people with a genuine transport need rather than a status need, a 3-6 year old car bought outright or with a minimal loan, maintained properly and kept for 7-10 years, represents the most financially rational car ownership model. Not financial advice.
What is PCP finance and why is it financially risky?
PCP (Personal Contract Purchase) is a finance agreement where the buyer pays a monthly charge over 2-4 years, then either makes a large 'balloon payment' to own the car outright or hands the car back and starts a new agreement. Around nine in ten new cars sold in the UK in 2026 are bought on PCP (ALA Insurance 2026). PCP rates in 2026 are approximately 6-9% APR (up from 2-4% in 2016). PCP is financially risky because: (1) it encourages constant upgrading, keeping the buyer permanently on the steepest part of the depreciation curve; (2) at the end of a PCP term, buyers who hand the car back have paid for 3-4 years of depreciation and interest with nothing to show for it; (3) the arrangement strongly benefits the finance provider and manufacturer (who maximises new car sales), not the buyer; (4) finance charges have doubled while vehicle prices have risen 89% since 2016 (ALA Insurance UK 2026). The monthly payment is the most visible and the least informative measure of the true cost. Not financial advice.
How much wealth could I build if I spent less on a car?
The compound wealth calculation depends on the monthly saving and the time horizon, but the figures are substantial. The difference between a financed newer car at £650/month all-in and an outright older car at £250/month all-in is £400/month. That £400/month invested at 8%/yr in a Stocks and Shares ISA for 30 years produces approximately £595,000 (FV of annuity formula; illustrative; not a forecast). For 37 years (a full career): approximately £878,000. In the US, $400/month invested at 8%/yr for 30 years = approximately $595,000. The point is not that everyone should drive a 15-year-old car; it is that the car specification decision is simultaneously a financial decision of enormous long-term consequence, and most people make it based only on the monthly payment. Investing involves risk including possible loss of principal. Not financial advice. Past performance does not predict future results.
0 Comments
Be the first to share your thoughts on this article.