
Vehicles & Cars
Most Pothole-Ridden UK Cities Ranked: 2026 Guide
The UK's road repair backlog has hit a record £18.62 billion. The RAC received more pothole breakdown reports in February 2026 alone than in the whole of 2025 combined. Road condition is now the number one motoring concern for UK drivers, ahead of fuel prices and insurance. And in some parts of the country, drivers are nearly 50 times more likely to hit a reported pothole than in others. This guide ranks the worst cities and counties, names the improvement stories, and explains how to claim when your car takes the hit.
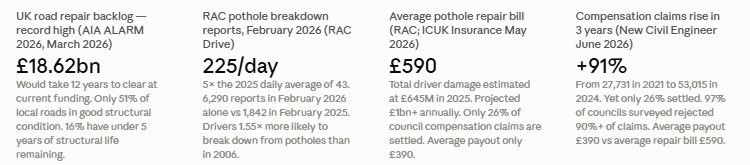
Table of Contents
- Britain's Roads and the £18.62 Billion Crisis
- How We Ranked: Methodology and Data Sources
- #1 Aberdeen — The UK's Pothole Capital
- #2 Nottingham — The City with the Most Deteriorating Roads
- #3 Newcastle — 33,274 Potholes and 88% Growth Since 2020
- #4 Cardiff — Wales's Worst Road Network
- #5 Peterborough — Top of the Compensation Claims Table Every Year Since 2020
- #6 Edinburgh — Scotland's Pothole Problem
- #7 Brighton and Hove — The South Coast's Crumbling Roads
- #8 Lancashire — Highest Repair Intensity in England
- #9 Stoke-on-Trent — £71 Million Spent and Still in the Top Ten
- #10 Belfast — Over Half of Residents Report Vehicle Damage
- County Hotspots: Devon, Surrey and the Worst Areas by Total Volume
- The Improvement Stories: Where Things Are Getting Better
- What Potholes Actually Cost UK Drivers
- How to Claim Compensation for Pothole Damage
- Conclusion: The Roads Crisis Is Getting Worse Before It Gets Better
- Frequently Asked Questions
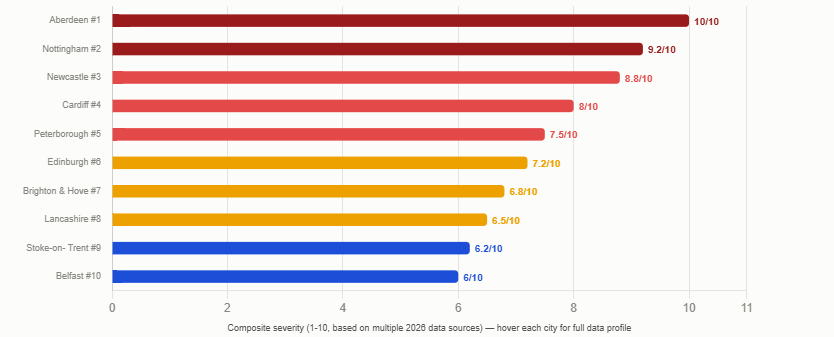
Top 10 worst cities: pothole density per 100km
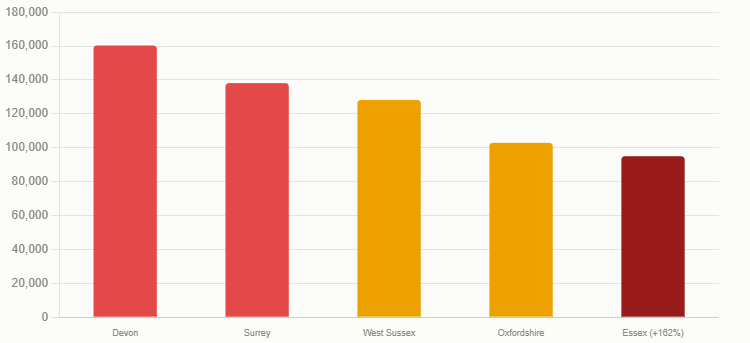
Worst counties: total potholes and budget vs outcome
Driver costs and compensation claims: the money story
Britain's Roads and the £18.62 Billion Crisis
The Asphalt Industry Alliance's (AIA) Chair David Giles said it plainly when releasing the ALARM 2026 survey in March: 'There's no polite way to put it: the condition of our local roads has become a national disgrace.' The numbers behind that statement are extraordinary even by recent British road standards.The repair backlog for local roads in England and Wales now stands at a record £18.62 billion, according to the AIA's annual ALARM survey — the most comprehensive assessment of UK road conditions available. At current funding levels, it would take 12 years to clear. The government has allocated £1.6 billion for pothole repair in 2025-26 and committed £7.3 billion over four years — welcome investment, but the RAC's head of policy Simon Williams was measured in response: 'It will be some time before drivers notice a real difference.'
The human and financial impact is immediate and significant. The RAC attended 26,048 pothole-related breakdowns in 2025, up 15% on the year before. In February 2026 alone, the organisation received 6,290 member reports of pothole-related breakdowns — nearly the same total as the entire month of February 2025 had produced, but compressed into a single extreme month. The daily average of 225 reports in February 2026 was more than five times the 43-a-day recorded across all of 2025. The AA separately attended 137,000 pothole-related incidents in just January and February 2026 combined — 25,000 more than the same two months the year before.
Road condition is now the number one motoring concern for UK drivers in 2026, with 47% citing it as their top issue — ahead of fuel prices, insurance costs, and congestion, according to the AIA. This guide ranks the worst cities and towns, profiles each one with specific data, and explains what drivers can do when they become victims of this very visible and very costly national problem.
£18.62 billion repair backlog — record high (AIA ALARM 2026 Survey, March 2026). 12 years to clear at current funding levels. 26,048 RAC pothole breakdowns in 2025 (+15% year-on-year). 225 pothole breakdown reports per day in February 2026 — 5x the 2025 daily average. 1.2 million potholes reported across UK (2021-2025, Blackcircles 2026). Only 51% of local road network in good structural condition. 47% of UK drivers cite road condition as their #1 motoring concern. Average repair bill: £590. Pothole damage costs British drivers estimated £645 million per year.
How We Ranked: Methodology and Data Sources
This ranking draws on multiple published 2025-2026 data sources, each measuring the pothole problem from a different angle. No single metric captures every dimension of a city's pothole problem, so the ranking combines rate-adjusted data, absolute volume, driver experience surveys, insurance claims data, and road condition assessments from government inspection.The primary source for rate-adjusted pothole data is the Blackcircles Pothole Report 2026, which covers the period 2021 to 2025 and measures potholes reported per 100 kilometres of road — the most meaningful comparison because it normalises for city size. A city with a large road network but few potholes per kilometre is less problematic for drivers than a smaller city with a high rate per kilometre. The Carwow / Blackcircles data from April 2025 adds total absolute pothole counts and repair rates.
The June 2026 study reported by Nottingham World used a composite scoring methodology combining percentage of A roads in poor condition, percentage of B and C roads in poor condition, and pothole repair intensity per 100 kilometres of road — producing an overall road deterioration score. The Which? report from August 14, 2026, adds the insurance claims dimension, using Tesco Insurance's analysis of pothole damage claims from January to May 2026 across UK cities and towns. The Brumble Pothole Postcode Index 2026 (April 2026) adds a nation-level comparison of road condition, claims rate, and compensation success rate.
Different datasets produce different rankings because they measure different things. Blackcircles measures reported defect rate per 100km — how dense the pothole problem is relative to road length. Tesco Insurance measures compensation claims — how often drivers are actually suffering car damage. The DfT traffic light system measures overall road condition and maintenance investment efficiency. A city can score badly on all three — or badly on one while performing reasonably on another. This guide uses the primary dataset most specific to each city and notes which ranking it comes from.
#1 Aberdeen — The UK's Pothole Capital
Aberdeen holds the unenviable distinction of recording the highest pothole rate of any city in the UK, with 10,396 defect reports per 100 kilometres of road between 2021 and 2025 — nearly 4,000 more per 100km than the next-highest area, according to the Blackcircles Pothole Report 2026. The scale of the problem reflects a combination of Scotland's more extreme freeze-thaw weather cycles, the age of much of Aberdeen's road infrastructure, and several years of constrained council maintenance budgets.The 10,396-per-100km figure is not just the highest in the Blackcircles study — it represents a rate that is in some comparisons nearly 50 times higher than the lowest-ranking areas in the same study. For Aberdeen drivers, this translates to daily encounters with road surface damage that is among the most severe in the country. The type of damage produced by Aberdeen's road conditions ranges from tyre punctures and buckled alloy wheels to more severe suspension and steering rack damage — the category of repairs that can exceed £1,000 per incident.
Aberdeen: #1 in the UK for pothole density rate (10,396 per 100km, 2021-2025, Blackcircles 2026). Notable: defect reports did fall between 2024 and 2025 following council investment in repair works, indicating recent improvement. The trajectory is in the right direction, but Aberdeen remains the benchmark for UK urban pothole density. Drivers in Aberdeen are also dealing with Scotland's extreme weather — the freeze-thaw cycle that creates potholes is more severe in the northeast than in most of England. Positive development: Aberdeen repaired 2,130 potholes per 62 miles in 2024 (third highest repair rate nationally), indicating active mitigation.
#2 Nottingham — The City with the Most Deteriorating Roads
Nottingham topped a June 2026 composite ranking of UK cities struggling most with poor roads and potholes, published by Nottingham World and drawing on government road condition assessments and repair activity data. The city recorded 19% of its A roads and 21% of its B and C roads in poor condition — one of the highest dual-category failure rates in the study. Combined with a pothole repair intensity of 16.83 per 100 kilometres of road, Nottingham placed first overall in this composite assessment.The Nottingham road problem is not simply about the number of potholes — it is about the rate at which the underlying road infrastructure is deteriorating. The classification of 19% of A roads as in poor condition signals structural issues that go beyond surface patching: roads where the base layer is compromised and which will require significantly more expensive remediation than pothole-by-pothole repair. Nottingham is also included in the Blackcircles 2026 data as recording more than 6,400 potholes per 100km — placing it in the top tier alongside Cardiff and Edinburgh.
Nottingham: ranked #1 in June 2026 composite road deterioration study (Nottingham World / government data). 19% of A roads in poor condition; 21% of B/C roads poor. 16.83 repair intensity per 100km. Also top-tier in Blackcircles 2026 per-100km rate. The combination of structural road deterioration and high surface defect density makes Nottingham one of the most comprehensively challenging driving environments in England. The city's position reflects years of local authority budget pressure and a road network that carries significant freight and commuter traffic through its central area.
#3 Newcastle — 33,274 Potholes and 88% Growth Since 2020
Newcastle recorded 33,274 potholes across its 600 miles of roads in 2024 — the highest absolute count of any UK city in that year's data, according to Carwow's April 2025 report drawing on Blackcircles data. The city's pothole total has increased by over 88% since 2020, making it one of the fastest-deteriorating major urban road networks in the country.The northeast of England has been particularly hard-hit by the combination of factors driving the national pothole crisis: harsh winters with pronounced freeze-thaw cycles, heavy industrial and commercial vehicle traffic, and local authority maintenance budgets that have not kept pace with the rate of road deterioration. Newcastle's 88% growth in pothole numbers since 2020 — against a national 5.5% increase across the same period — indicates a problem that is accelerating faster than the national trend.
Newcastle does have one distinction that partially mitigates the severity of its absolute ranking: the city also repairs potholes at one of the highest rates in the country, with 3,001 potholes repaired per 62 miles of road. The volume of repairs is a response to the volume of defects, but it also indicates an active council posture toward the problem — one that contrasts with cities like Liverpool and Sheffield, where repair rates have been significantly slower.
Newcastle: 33,274 total potholes in 2024 (highest absolute count, Carwow/Blackcircles data). +88% growth since 2020 (vs 5.5% national average). Active repair programme: 3,001 per 62 miles repaired. The scale of the absolute problem places Newcastle firmly in the UK's worst-affected tier, even as its repair activity is among the most intensive nationally.
#4 Cardiff — Wales's Worst Road Network
Cardiff recorded 17,536 potholes overall in 2024, making it the third-highest absolute total among UK cities in the Carwow/Blackcircles dataset. The Welsh capital also places in the Blackcircles 2026 per-100km ranking with more than 6,400 reported per 100 kilometres — alongside Nottingham and Edinburgh in the high-density tier below Aberdeen.Cardiff's pothole growth rate is more moderate than Newcastle's at approximately 5% over recent years, suggesting a problem that is worsening but not accelerating as rapidly as some other cities. The city did record the second-highest number of pothole repairs per 62 miles nationally — 1,588 — indicating that Cardiff Council has maintained an active repair programme. The repair rate is, however, far exceeded by the rate of new defect creation, which is the central challenge facing every city on this list.
Wales as a nation scores poorly in the Brumble Pothole Postcode Index 2026, which rates Wales on road condition, claims per mile, and compensation success rate. Carmarthenshire attracted specific criticism for rejecting 99% of pothole compensation claims in 2024 — the highest rejection rate in Wales and one of the worst in Britain, according to Brumble's April 2026 analysis.
Cardiff: 17,536 total potholes 2024 (3rd highest UK city); 6,400+ per 100km (top tier, Blackcircles 2026); second-highest repair rate in the country. Cardiff's combination of high defect density and active repair response positions it as a city fighting a difficult battle against its road network's rate of deterioration.
#5 Peterborough — Top of the Compensation Claims Table Every Year Since 2020
Peterborough leads the UK in a category that says as much about driver experience as any pothole count: it has topped Tesco Insurance's pothole damage claims table every year since 2020, according to Which?'s August 14, 2026 investigation. The Tesco Insurance analysis covered January to May 2026 and ranked UK towns and cities by the concentration of pothole damage insurance claims — making Peterborough the most consistently damaging city for drivers' vehicles in the country by this metric.The Which? report noted that the Department for Transport's 2025-2026 traffic light assessment rated the county of Suffolk (home to Ipswich, the worst in the Tesco claims table after Peterborough) as red — one of only 13 authorities in England to receive that designation, indicating roads that are in poor condition and where the authority is not making adequate progress. The contrast between the insurance claims data and the DfT ratings is instructive: some areas with high claims volumes do not appear in official poor-condition assessments, and vice versa, suggesting that official road condition surveys and driver-experienced damage are not always measuring the same thing.
Peterborough: #1 in UK for pothole damage insurance claims every year since 2020 (Tesco Insurance data, cited Which? August 14, 2026). The insurance claims metric is arguably the most direct measure of actual driver impact — it reflects real vehicle damage requiring repair, not just reported surface defects that may or may not be actioned. Peterborough's consistent leadership of this table for six consecutive years makes it arguably the most impactful city for drivers encountering pothole damage in practice.
#6 Edinburgh — Scotland's Pothole Problem
Edinburgh records more than 6,400 potholes per 100 kilometres in the Blackcircles 2026 data, placing it in the top tier of UK cities for defect density alongside Nottingham and Cardiff, below Aberdeen's extreme outlier figure. Scotland as a whole scores poorly in the Brumble Pothole Postcode Index 2026, with the DfT equivalent — Transport Scotland — reporting significantly worse average road conditions than England.Historical data adds context: Edinburgh had less than a quarter of its 5,538 reported potholes filled since 2007, according to figures cited in a 2024 Sunday Telegraph analysis, suggesting a chronic repair deficit that has accumulated over nearly two decades. Glasgow, meanwhile, was described in the same analysis as 'the worst city in Britain for unrepaired streets' — a designation based on the ratio of reports to completed repairs.
Scotland's road infrastructure faces a specific challenge: the combination of colder winters, higher rainfall, and significant rural road network alongside the urban core means that the freeze-thaw pothole creation mechanism operates more intensively and for longer each year than in most of England. Edinburgh's position in the second tier of UK cities reflects the structural challenge of Scotland's climate as much as council policy decisions.
Edinburgh: 6,400+ potholes per 100km (Blackcircles 2026, top tier). Historical repair deficit: less than 25% of reported potholes filled since 2007. Scotland scores poorly nationally in the Brumble 2026 Pothole Postcode Index. Edinburgh is the sixth worst city overall in this ranking, with a combination of high defect density and a documented long-term repair backlog.
#7 Brighton and Hove — The South Coast's Crumbling Roads
Brighton and Hove featured prominently in the June 2026 composite road deterioration ranking, with 18% of A roads classed as being in poor condition — close to Nottingham's leading figure — and a repair intensity rate of 9.90 per 100 kilometres. The combination of high A-road failure rate and active repair demand makes Brighton one of the most challenged road environments on the South Coast.The Brighton and Hove road problem has specific geographic drivers. The city's coastal exposure means its roads experience the salt air corrosion that accelerates asphalt deterioration. The South Downs geography concentrates significant HGV traffic on routes that were not designed for modern freight volumes. And the city's tourist economy means that roads in the central and seafront areas experience traffic loads that are dramatically higher in summer than winter, creating stress patterns that accelerate surface deterioration.
Brighton and Hove: 18% of A roads in poor condition; repair intensity 9.90 per 100km (June 2026 composite ranking, Nottingham World). Not included in the Blackcircles per-100km top tier, but the combination of high A-road failure rate and coastal road stress factors makes Brighton one of the South of England's most problematic driving environments.
#8 Lancashire — Highest Repair Intensity in England
Lancashire stood out in the June 2026 road condition study for an unusual distinction: it recorded the highest pothole repair activity in the entire study, at 21.94 per 100 kilometres — meaning councils across the county are filling more potholes per kilometre than any other area examined. More than a quarter of Lancashire's unclassified roads (residential streets, neighbourhood routes) were also rated poorly.The high repair intensity in Lancashire reflects the scale of the underlying problem as much as council efficiency. An area with fewer potholes might record fewer repairs per kilometre simply because fewer are needed. Lancashire's high repair rate combined with a high unclassified-road failure rate indicates a road network under constant pressure — one where the repair programme is reactive to an accelerating defect creation rate rather than proactive in preventing deterioration.
The unclassified road problem is particularly significant for Lancashire residents. While motorists notice A-road potholes most visibly, it is the residential streets and neighbourhood routes — the roads outside homes, schools, and local businesses — that affect daily life most directly and that typically have the lowest maintenance priority in council budgets.
Lancashire: 21.94 pothole repairs per 100km (highest repair intensity in June 2026 study). 25%+ of unclassified roads in poor condition. The county's profile reflects a road network under sustained pressure, with repair activity struggling to match the rate of road surface deterioration across its extensive rural and suburban network.
#9 Stoke-on-Trent — £71 Million Spent and Still in the Top Ten
Stoke-on-Trent represents one of the most instructive cases in this ranking: a city that has spent very substantially on road maintenance and still appears among the UK's worst-affected areas. Stoke-on-Trent has spent £71 million on road maintenance since 2021, averaging almost £8 million per 100 kilometres — one of the highest spend rates of any council in the Blackcircles 2026 dataset. Yet the city remains in the top tier of the UK's most pothole-affected areas.The Stoke example illustrates the scale of the systemic problem: high levels of investment are necessary but not sufficient to resolve road networks that have experienced decades of underinvestment. When the underlying road structure — the base layer beneath the visible surface — has deteriorated beyond a threshold, surface repairs are reactive rather than curative. Each patched pothole has a limited lifespan before the same defect or a new one appears nearby. Structural repair is more expensive but more durable; the political and budget incentive is usually toward surface patching, which produces more visible short-term results per pound spent.
Stoke-on-Trent: £71 million spent on road maintenance since 2021 (~£8M per 100km average); still among UK's worst pothole areas (Blackcircles 2026). The Stoke case is a cautionary illustration of the gap between investment in reactive repair and structural road improvement. High spend on patching in a severely degraded network produces diminishing returns if the underlying road structure is not addressed.
#10 Belfast — Over Half of Residents Report Vehicle Damage
Belfast occupies the tenth position in this ranking based on a particularly direct metric: 57% of Belfast residents surveyed by Blackcircles reported that their vehicles had been damaged by potholes. This is the highest vehicle-damage self-reported rate of any UK city in the survey, and it represents a figure that is striking in its scale — more than one in two drivers in the city has experienced direct financial harm from road surface conditions.Northern Ireland's road network faces specific challenges that differ from the rest of the UK. Roads NI, the infrastructure body responsible for most of Northern Ireland's road network, has a funding model and maintenance programme that differs from English local authorities. The combination of Northern Ireland's maritime climate — high rainfall and moderate freeze-thaw — and what residents consistently describe as slow repair response times has produced a road environment where pothole encounters are a near-universal driver experience.
Liverpool and Sheffield also deserve mention at the boundaries of this ranking. Carwow's data identified both cities as having among the slowest road repair rates in the country, with 17% of residents reporting it takes over six months to fix potholes in their cities. Slow repair is a distinct problem from high pothole count: it means that reported defects stay dangerous for longer, multiplying the period during which drivers and road users are at risk.
Belfast: 57% of residents report vehicle damage from potholes — highest self-reported vehicle damage rate in the Blackcircles 2026 survey. Also notable: Liverpool and Sheffield have the slowest repair rates in the UK, with 17% of residents saying fixes take more than six months. Slow repair extends the period of risk for every defect.
County Hotspots: Devon, Surrey and the Worst Areas by Total Volume
While this guide has focused on cities, the county-level data from First Response Finance's UK Pothole Index 2025 reveals a different picture — one dominated by large, predominantly rural counties where extensive road networks accumulate enormous total pothole counts even when the per-kilometre rate may be lower than urban areas.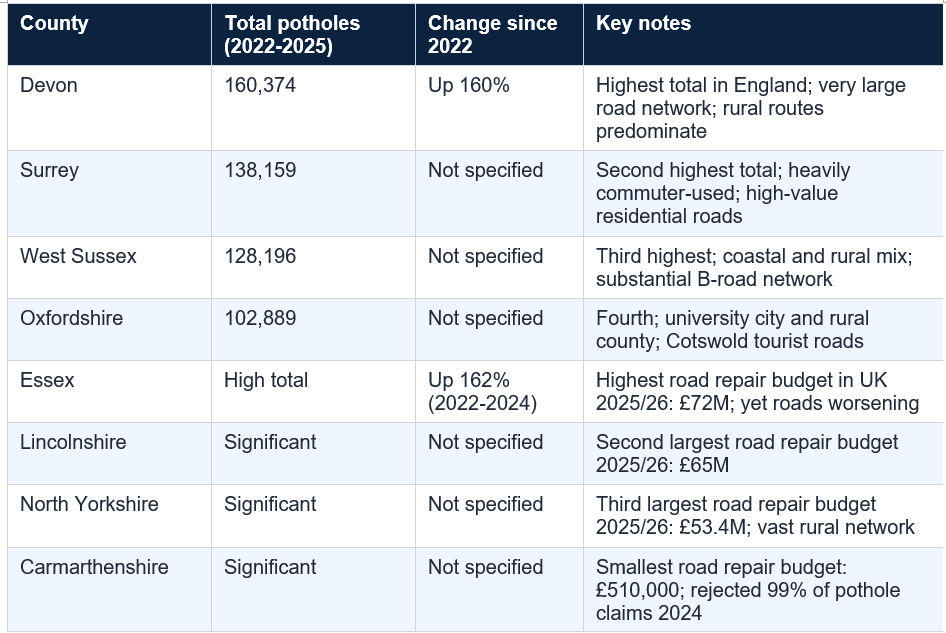
Source: First Response Finance UK Pothole Index 2025; Blackcircles Pothole Report 2026. Note: Essex and Devon have the largest repair budgets and the largest increases in potholes respectively — illustrating that budget and outcome do not always correlate when underlying road infrastructure deterioration is severe. Not all county figures are directly comparable due to differences in reporting methodology across councils.
The Improvement Stories: Where Things Are Getting Better
Amidst the overwhelmingly negative national picture, specific councils and areas have produced genuine improvement that demonstrates what focused investment and effective maintenance planning can achieve.- Redbridge (London): fixes 11,808 potholes per 100 kilometres — the highest repair rate of any council in the Blackcircles 2026 dataset. Redbridge's proactive repair posture means reported defects are addressed quickly, reducing the period during which each pothole creates risk.
- Hertfordshire and Kent: both counties show pothole numbers falling year-on-year — a rare bright spot in a dataset where most areas show worsening trends. The improvement reflects sustained investment in preventative maintenance rather than reactive patching.
- Aberdeen: despite holding the UK's highest pothole density rate, the city recorded a fall in reported defects between 2024 and 2025 following targeted council investment in repair works. The direction of travel has reversed, even if the absolute level remains the highest nationally.
- Bridgend (Wales): the only council in the entire UK to pay out 100% of pothole compensation claims it received in 2024, according to Brumble's April 2026 analysis. While the total of 52 claims reflects a small volume, the 100% payout rate indicates either genuinely good road condition or a rigorous claims assessment process that only accepts clearly valid claims.
- New Mexico comparison point (for scale): the UK government's £1.6 billion 2025-26 allocation is the largest single-year pothole funding commitment in UK history — nearly 50% more than the previous year's local road maintenance funding, according to the RAC. The industry consensus is that it is a step in the right direction, but insufficient to clear a backlog of £18.62 billion.
What Potholes Actually Cost UK Drivers
The national pothole crisis is not an abstract infrastructure problem. It is a direct and recurring financial cost to millions of UK drivers every year. Understanding what is at risk financially — and what types of damage potholes cause — is essential context for any driver navigating the roads ranked in this guide.The Cost: The financial cost of potholes to UK drivers in 2026. Pothole damage cost British drivers approximately £645 million in 2025 (Treadfirst analysis, cited AutoHit April 2026). Total vehicle repair cost projected to exceed £1 billion annually (WeCovr February 2026). Average repair bill: £590 (RAC; ICUK Insurance May 2026). 1 in 5 drivers reports paying more than £200 for pothole damage repairs (Blackcircles 2026). A single severe pothole strike can result in a bill exceeding £1,000 for modern cars with air suspension or low-profile alloy wheels (Top Insurance Guides May 2026). 3 in 10 drivers say their vehicle suffered pothole damage in the last 12 months (AIA ALARM 2026).
The types of damage a pothole causes depend on its depth, the vehicle's speed, and the type of tyre and suspension. The most common immediate damage is a tyre puncture or sidewall bulge — the sharp edge of the pothole cuts through the sidewall material in a way that cannot be repaired, requiring full tyre replacement. More severe strikes can buckle alloy wheels (particularly low-profile performance wheels common on modern cars), damage suspension components including springs and shock absorbers, and misalign steering geometry — creating uneven tyre wear that accelerates replacement schedules even after the original damage has been repaired.
WeCovr's February 2026 analysis notes that pothole-damaged roads also increase fuel consumption (uneven surfaces create more rolling resistance), create insurance premium pressure when claims are made, and generate road safety incidents as drivers swerve, brake suddenly, or cross the centre line to avoid known defects — behaviours that create new collision risks.
The insurance trap: pothole damage claims are almost always classified as fault claims because there is no third party to recover costs from. This means claiming from your insurer for pothole damage will: cost you your excess (typically £300 to £500); trigger potential loss of your no-claims bonus; and may result in a premium increase at the next renewal. For damage below £500 to £600 — below or close to the average repair bill — claiming through insurance is often more costly in the long run than paying for the repair directly and pursuing a council compensation claim separately. Always compare the repair cost to your excess and NCB impact before claiming. Not financial or legal advice.
How to Claim Compensation for Pothole Damage
The law is clear: whoever controls the road — usually a local council for B-roads and residential streets, or National Highways for motorways — has a legal duty to maintain it. If they have failed in that duty and you can demonstrate it, you may be entitled to compensation. However, the data tells an honest story about the difficulty of this process: only 26% of claims submitted to UK councils in the most recent data were settled, with 97% of councils surveyed rejecting more than 90% of claims.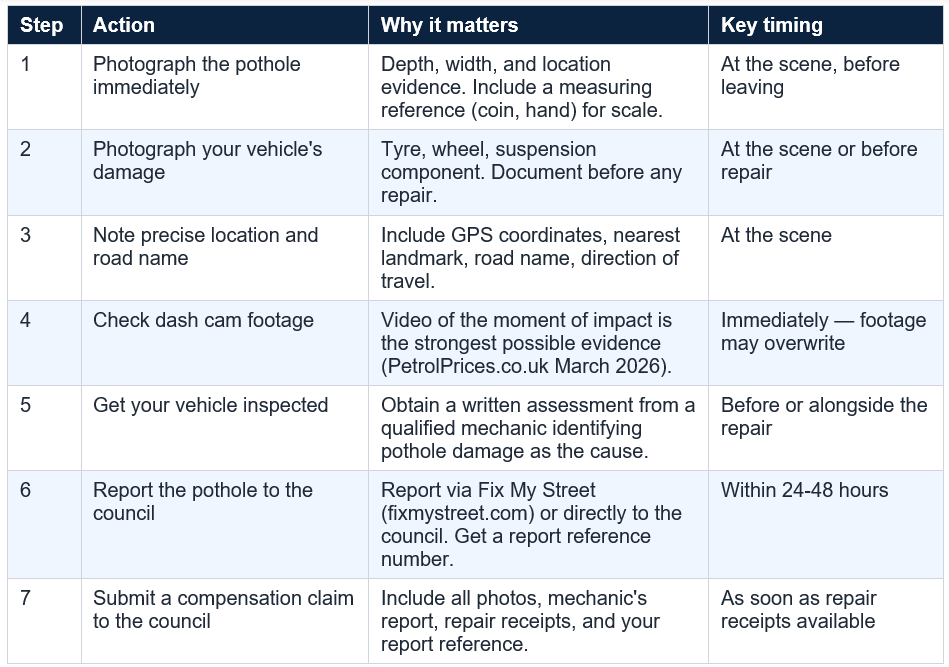

Key limitation: councils commonly defend pothole claims using the 'Section 58 defence' — arguing they were not aware of the defect and had an adequate system of road inspection in place. If the pothole was not previously reported before your incident, this defence may succeed even if the road was clearly in poor condition. Reporting potholes via Fix My Street or the council website before hitting them (or after, to create a record) improves the evidence base for future claims. Not legal advice. Average council payout: £390 (vs average repair bill: £590). Wrexham paid the highest average per claim in Wales at £2,026. Consult a qualified legal adviser for claims above £1,000.
Conclusion
The data in this guide draws a consistent picture: the UK's pothole problem is worsening in most of the cities and counties ranked, the repair backlog is at a record high, driver costs are at record levels, and the funding committed by government — however welcome — is insufficient to close the gap at anything like the pace the scale of the problem demands.Aberdeen remains the UK's pothole capital by rate-adjusted defect density, at 10,396 per 100km over five years. Nottingham leads the composite road deterioration ranking for 2026. Newcastle has seen an 88% increase in potholes since 2020. Peterborough has topped the insurance claims table every year since 2020. And over half of all Belfast residents report their vehicles have been damaged by road surface conditions.
The improvement stories — Redbridge's repair intensity, Hertfordshire's falling pothole count, Aberdeen's recent improvement trajectory — show that better outcomes are achievable with sustained, well-targeted investment. But the AIA's finding that only 51% of the local road network is in good structural condition, and that 16% has less than five years of structural life remaining, means the crisis will deepen before it improves for most UK drivers. The 12-year clearance timeline for the existing backlog, at current funding levels, is the clearest statement of where Britain's roads are heading.
For the millions of drivers navigating the cities and counties in this guide every day, the practical guidance is simple: document everything, report every defect, keep your dash cam running, and understand your rights when a pothole damages your vehicle. The road may not improve as quickly as the government funding announcements suggest — but the compensation process is there, however difficult, for those who know how to use it.
Frequently Asked Questions
Which UK city has the most potholes in 2026?By rate-adjusted defect density — the most meaningful comparison — Aberdeen leads the UK with 10,396 pothole reports per 100 kilometres of road between 2021 and 2025, according to the Blackcircles Pothole Report 2026. This is nearly 4,000 more per 100km than the second-highest area. By absolute count, Newcastle recorded the most potholes in 2024 at 33,274 across its 600 miles of roads, with an 88% increase since 2020. By insurance claims, Peterborough has topped Tesco Insurance's pothole damage claims table every year since 2020, according to Which? (August 14, 2026). By composite road deterioration ranking, Nottingham placed first in the June 2026 study that assessed A-road and B/C-road condition alongside repair intensity.
What is the UK's total pothole repair backlog in 2026?
The Asphalt Industry Alliance's (AIA) ALARM 2026 Survey, published in March 2026, identified a record £18.62 billion repair backlog for local roads in England and Wales. This is the highest figure in the survey's history. The AIA estimates it would take 12 years to clear at current funding levels, despite a 17% increase in highway maintenance budget in 2025 and the government's £1.6 billion allocation for 2025-26. Only 51% of the local road network is reported to be in good structural condition, and 16% of local roads have less than five years of structural life remaining. The AIA Chair described the condition of UK local roads as 'a national disgrace.'
What is the average cost of pothole damage to a UK driver?
The average repair bill for pothole-related vehicle damage is £590, according to RAC data and the ICUK Insurance May 2026 report. However, one in five drivers surveyed reports paying more than £200 — and severe strikes on modern cars with low-profile tyres or air suspension can exceed £1,000. The total cost of pothole damage to British drivers is estimated at £645 million in 2025 (Treadfirst analysis, cited AutoHit April 2026) and is projected to exceed £1 billion annually (WeCovr February 2026). Three in ten drivers report that their vehicle suffered pothole damage in the last 12 months.
How do I claim compensation for pothole damage in the UK?
Photograph the pothole and your vehicle's damage at the scene, including a scale reference in the pothole photo. Check your dash cam footage immediately — video of the moment of impact is the strongest possible evidence. Get a written mechanic's assessment identifying pothole damage as the cause before repair. Report the pothole to your local council via Fix My Street (fixmystreet.com) or directly and obtain a reference number. Submit a compensation claim to the council with all photos, the mechanic's report, and repair receipts. Only 26% of claims were settled in the most recent available data (Brumble April 2026), with councils commonly using the Section 58 defence (claiming they had adequate inspection systems in place and were unaware of the defect). Average payout is £390 — below the average repair bill of £590. For claims above £500-£600, a solicitor or specialist pothole claims service may improve outcomes. Not legal advice.
Which county in England has the most potholes overall?
Devon has recorded the highest total number of potholes of any county in England since 2022, with 160,374 logged over three years, according to First Response Finance's UK Pothole Index 2025. Devon has also seen a 160% increase in potholes between 2022 and 2024. It is followed by Surrey (138,159 total potholes), West Sussex (128,196), and Oxfordshire (102,889). Essex deserves special mention: despite having the largest road repair budget in the UK for 2025/26 at £72 million, Essex has seen a 162% increase in potholes between 2022 and 2024 — illustrating that high repair spend in a severely degraded network can produce worsening outcomes if structural road condition is not addressed alongside surface patching.
Are UK potholes getting worse in 2026?
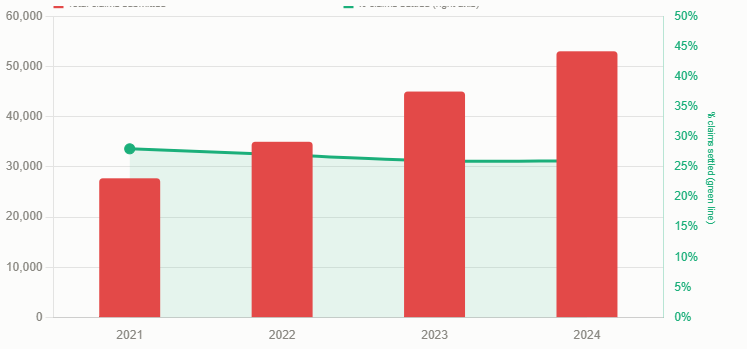
Yes — across most of the UK, the pothole situation is getting worse, not better. The AIA ALARM 2026 survey found that 1.9 million potholes were filled in 2025 — more than 5,200 per day — but the repair backlog still reached a record £18.62 billion. Pothole numbers increased by 5.5% across the half-decade covered in the Blackcircles 2026 study. The RAC's daily average of 225 pothole-related breakdown reports in February 2026 was more than five times the 2025 daily average of 43. Pothole compensation claims rose 91% in three years (27,731 in 2021 to 53,015 in 2024). The government's increased funding is a step forward, but the industry consensus — including the RAC's head of policy — is that 'it will be some time before drivers notice a real difference.'

0 Comments Comments