

Investing
Energy Transfer’s 6.5% Yield: The Risk Some Investors Ignore

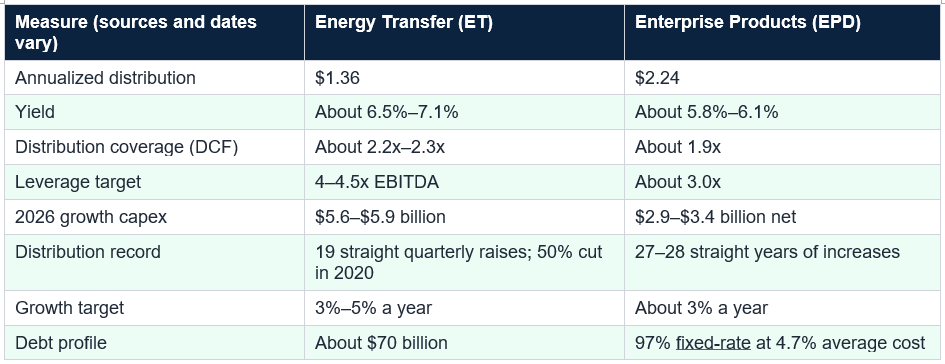
Energy Transfer (ET): $1.36 annualized distribution after 19 straight quarterly raises; yield about 6.5%–7.1% depending on price (6.7% at about $20.28); coverage about 2.2x–2.3x; leverage target 4–4.5x; 2026 growth capex $5.6–$5.9 billion; debt about $70 billion; operating cash fell $879 million short of capex plus distributions in 2025; 50% distribution cut in 2020; 3%–5% growth target. Enterprise Products (EPD): $2.24 annualized; yield about 5.8%–6.1% (6.0% at about $37.37); coverage 1.9x; leverage target about 3.0x; 97% fixed-rate debt at 4.7%; 27–28 straight years of increases; net growth capex $2.9–$3.4 billion. Peers: MPLX forward yield 8.2% with 12.5% growth committed for 2026–27; Kinder Morgan about 3.4%. My arithmetic: ET’s yield premium over EPD is about 0.7 points ($71 a year per $10,000), and a payout cut of about 11% would erase it; a 20% EBITDA drop would lift leverage from 4.25x to about 5.3x for ET but from 3.0x to 3.75x for EPD; a repeat of a 50% cut would turn a $6,700 annual income on $100,000 into about $3,350.
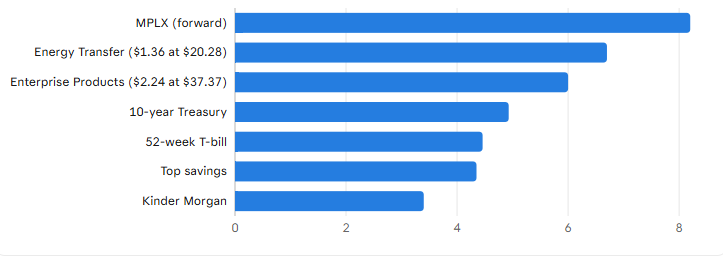
Pipeline yields vs. safer alternatives, early November 2026 (%)
Yield (%) by 24/7 Wall St., Motley Fool (MPLX, Kinder Morgan), The Mortgage Reports, MyMoneyBlog, Bankrate; yields move daily with unit prices and sources differ; distributions are not guaranteed
A Motley Fool article published today asks what risk investors are ignoring, and it points to history, a 2020 distribution cut and a called-off merger, as a reason to prefer Enterprise Products Partners and its lower yield. I want to test that with the numbers. This guide lays out the case for Energy Transfer, the risks and what the extra yield is actually worth, using public figures from several sources that differ in places. It is not a recommendation either way.
The growth story is real too. 24/7 Wall St. reports Energy Transfer is supplying about 900 million cubic feet a day of natural gas to data centers tied to Oracle, and management expects to spend $5 billion or more on growth each year through the decade. The units trade at about 13 times forward earnings against about 20 times for Kinder Morgan, per TIKR. Energy Transfer has also delivered: it was up about 29% this year as of late October. For an investor who focuses on the future, the case is not hard to see.
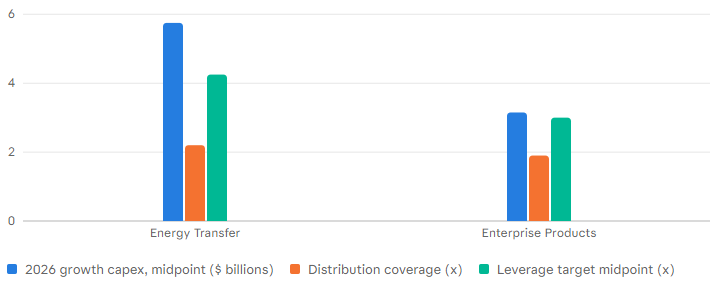
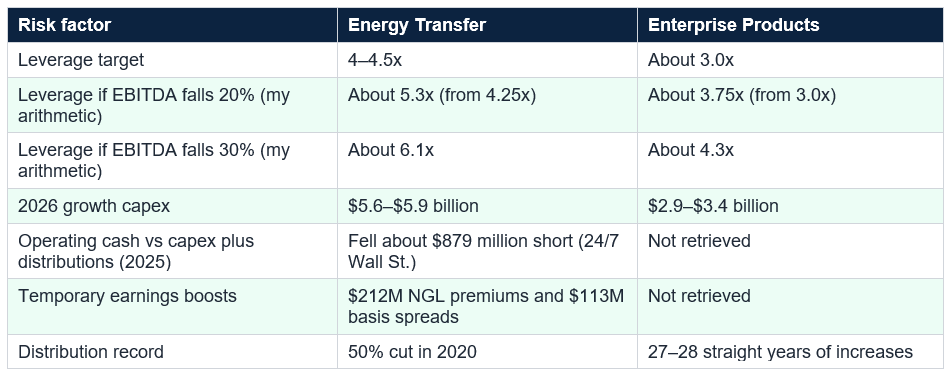
Spending is the second issue. Energy Transfer plans $5.6 to $5.9 billion of growth capex in 2026, about 1.8 times Enterprise’s $2.9 to $3.4 billion, and says it will spend $5 billion or more a year through the decade. Projects can earn good returns, but they also raise leverage and execution risk. And part of the recent earnings strength was temporary: 24/7 Wall St. says a 31% surge in EBITDA included $212 million from NGL premiums and $113 million from wider basis spreads, windfalls that could fade.
The third issue is history. In 2020, Energy Transfer cut its distribution by 50% to reduce leverage during the pandemic, and the Motley Fool author also cites the called-off Williams deal, which raised concerns about convertible securities that turned out not to matter when no cut occurred. Management has since reset, and the cut did reduce leverage, but a track record is a fact, not an opinion. For an income investor, a payout that has been cut once is a payout that can be cut again, and I cannot rule it out.
ET: leverage target 4–4.5x, growth capex $5.6–$5.9B, debt about $70B, 50% payout cut in 2020, coverage about 2.2x. EPD: leverage about 3.0x, growth capex $2.9–$3.4B, 97% fixed-rate debt at 4.7%, 27–28 straight years of increases, coverage 1.9x. A 20% EBITDA drop lifts ET’s leverage to about 5.3x and EPD’s to about 3.75x.
Enterprise is not risk-free, and it is not a growth story: it raises its payout about 3% a year, and its revenue growth has recently been in the mid-single digits. It still depends on oil, gas and natural gas liquids volumes, on contracts and on the demand for its pipelines, and its units can fall in a sell-off. Its yield, about 5.8% to 6.1%, is also lower than Energy Transfer’s. The point is not that it cannot disappoint, but that its balance sheet and record give it a bigger cushion, and you pay for that cushion with a lower yield.
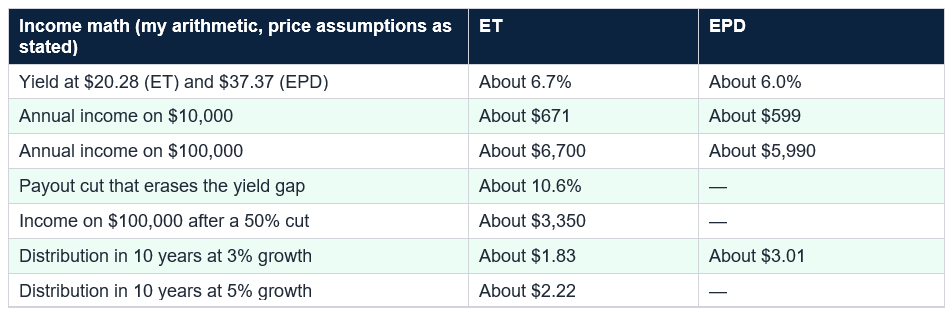
Now the other side of the trade. If Energy Transfer cut its payout by about 10.6%, its yield would fall to Enterprise’s 6.0%, erasing the premium. A repeat of the 2020 cut of 50% would turn $6,700 of annual income on $100,000 into about $3,350, less than half of what Enterprise would pay. Growth narrows the gap: at 3% a year Energy Transfer’s distribution would reach about $1.83 in 10 years and at 5% about $2.22, while Enterprise at 3% would reach about $3.01, so the higher yield and higher growth target are not a free lunch but a trade of risk for income.
The comparison is a reminder that yield and safety trade off, and that high yields come with questions. A higher yield may mean a riskier payout or a lower expected price, and a lower yield may mean a more reliable one. Each partnership has its own contracts, customers and capital plans. Looking at coverage, leverage, spending and track record for each, as I have done for Energy Transfer and Enterprise, is a better guide than the headline yield alone.
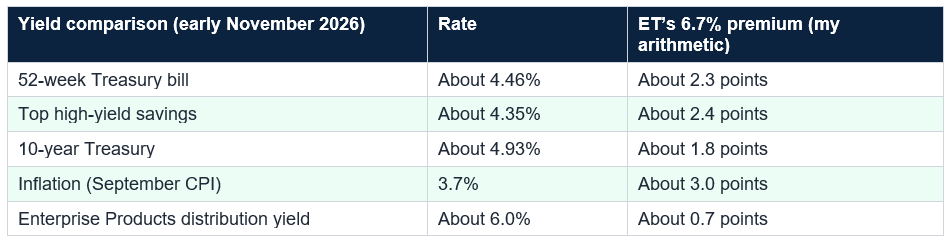
Also compare the yield with the alternatives. A 52-week Treasury bill pays about 4.46%, the 10-year yield is near 4.93% and top savings accounts about 4.35%, so Energy Transfer’s roughly 6.7% yield is about 2.3 points above cash and 1.8 above the 10-year. That premium is the pay for taking equity risk, price swings and the possibility of a cut. Remember that unit prices can fall: a 20% price decline would wipe out nearly nine years of that yield premium over cash (20 divided by 2.3). Income is only part of the return.
Then do the work. Read each company’s latest results, check coverage, leverage and capital plans and compare them over time, not just in one quarter. Remember Bessembinder’s finding that a few stocks create most market wealth, which argues for diversification instead of chasing the highest yield. Decide how large a position you could hold if the distribution were cut in half and the unit price fell, and size it accordingly. This is general education, not personal advice.
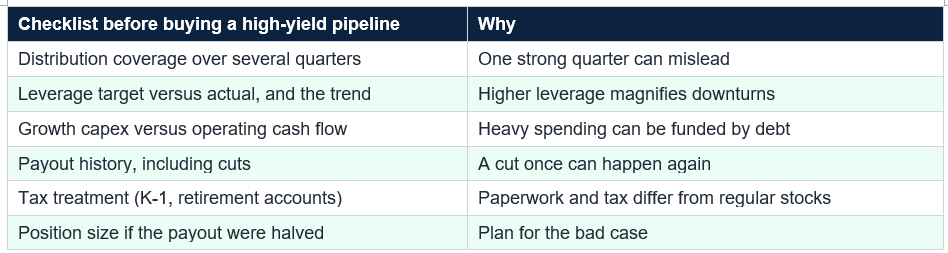
A high yield is partly compensation for risk. Distributions are not guaranteed, unit prices can fall and a payout that has been cut once can be cut again. Size positions so a cut would not harm your plans. Common mistakes include buying the highest yield without checking coverage and leverage, focusing on one good quarter, ignoring a company’s history, overlooking MLP tax paperwork, holding too much in one sector, treating a distribution as guaranteed and expecting the yield to stay the same when the unit price moves. Another is comparing yields without comparing safety. The yield is the headline, and the balance sheet is the story.
In my arithmetic, the extra yield is about 0.7 points, $71 a year per $10,000, and an 11% payout cut would erase it. Whether to take that trade depends on your need for reliability, your risk tolerance and your portfolio. Check the filings, size your position for a bad outcome and consider the taxes. Neither partnership is guaranteed, and I cannot predict their payouts or prices. This is general education, not personalized investment advice.
It is well covered at the moment: reported distributable cash flow coverage is about 2.2x to 2.3x, and the partnership has raised its payout for 19 straight quarters to $0.34 a unit, or $1.36 a year. But it runs more leverage than peers, plans heavy growth spending and cut its distribution by 50% in 2020. Safe today does not mean immune to a downturn, and I cannot predict its future payouts.
What is the main risk the headline refers to?
A Motley Fool article published November 7 points to Energy Transfer’s history, a 2020 distribution cut and the called-off Williams deal, as the risk behind its 6.5% yield. In my analysis, the risk is the combination of higher leverage (a 4x to 4.5x target), heavy capital spending and that track record, which together make the payout more sensitive to a downturn than Enterprise Products’.
How do Energy Transfer and Enterprise Products compare?
Energy Transfer yields more, about 6.5% to 6.7% against 5.8% to 6.1%, and targets 3% to 5% distribution growth. Enterprise has lower leverage (about 3.0x), 97% fixed-rate debt at a 4.7% average cost, 1.9x coverage, a high credit rating and 27 to 28 straight years of distribution increases. Sources differ on the exact streak and yields, which move with prices.
Are MLP distributions taxed differently?
Yes, in my general knowledge. Partnerships such as Energy Transfer and Enterprise issue a Schedule K-1 instead of a 1099, and distributions can include a return of capital that defers some tax, with possible complications in retirement accounts. One source mentions the tax implications of the MLP structure. I did not retrieve details, so check with a tax professional.
Should I buy the higher yield?
That depends on your goals, risk tolerance and the rest of your portfolio, and I cannot say. In my arithmetic, Energy Transfer’s yield premium over Enterprise is about 0.7 points, or about $71 a year per $10,000, and a payout cut of about 11% would erase it. This is general education, not personal advice.
Table of Contents
- A Yield Everyone Likes
- The Short Answer
- The Case for Energy Transfer
- The Risk: Leverage, Spending and History
- Enterprise Products: Reliable and Boring
- The Math of Extra Yield
- What the Peers Offer
- Other Things to Weigh
- How to Think About It
- Common Mistakes
- Conclusion
- Frequently Asked Questions
Pipeline yields vs. safer alternatives, early November 2026 (%)
Yield (%) by 24/7 Wall St., Motley Fool (MPLX, Kinder Morgan), The Mortgage Reports, MyMoneyBlog, Bankrate; yields move daily with unit prices and sources differ; distributions are not guaranteed
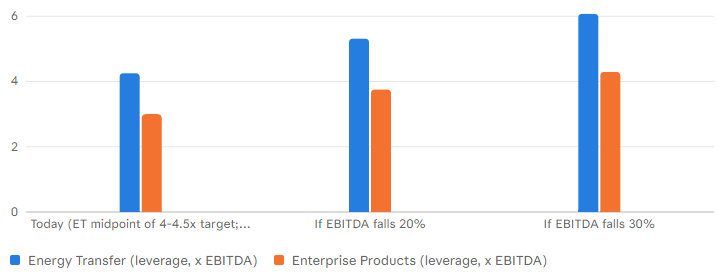
The cushion: leverage if EBITDA falls, Energy Transfer vs. Enterprise Products (x)
Debt / EBITDA (x) by Author's hypothetical arithmetic on reported leverage targets (24/7 Wall St.); debt held constant; not a forecast
The trade-off: spending, coverage and leverage, Energy Transfer vs. Enterprise Products
$ billions or multiple (x) by 24/7 Wall St. and Motley Fool (capex ranges $5.6-$5.9B and $2.9-$3.4B net; coverage about 2.2x vs 1.9x; leverage targets 4-4.5x vs about 3x); midpoints are the author's; mixed units on one axisA Yield Everyone Likes
When rates on cash sit around 4.4% and inflation is 3.7%, a pipeline partnership paying about 6.5% to 7% looks attractive. Energy Transfer, one of the largest US midstream companies, is the example: it has raised its quarterly distribution 19 times in a row, to $0.34 a unit or $1.36 a year, it is supplying natural gas to data centers and its units have risen about 29% this year. Management says it has turned over a new leaf after a more aggressive past. Analysts and commentators like the yield.A Motley Fool article published today asks what risk investors are ignoring, and it points to history, a 2020 distribution cut and a called-off merger, as a reason to prefer Enterprise Products Partners and its lower yield. I want to test that with the numbers. This guide lays out the case for Energy Transfer, the risks and what the extra yield is actually worth, using public figures from several sources that differ in places. It is not a recommendation either way.
The Short Answer
Energy Transfer yields about 6.5% to 7%, depending on the day’s unit price, against roughly 5.8% to 6.1% for Enterprise Products Partners, and its payout is currently well covered. The risk is not coverage so much as the cushion behind it: Energy Transfer targets 4x to 4.5x leverage against about 3x at Enterprise, plans $5.6 to $5.9 billion of growth capex against $2.9 to $3.4 billion, carried about $70 billion of debt and cut its distribution by 50% in 2020. Enterprise has raised its payout for 27 to 28 straight years. In my arithmetic, the yield premium is about 0.7 points, and an 11% payout cut would erase it. Whether that trade is worth it is a personal judgment.
The Case for Energy Transfer
Start with what is good. Energy Transfer has raised its distribution every quarter for 19 quarters, from the reset after the 2020 cut to $0.34 a unit, and it targets 3% to 5% annual growth. Its distributable cash flow covered the payout about 2.28 times in the first half of 2026, according to one source, and about 2.2 times by another, which is higher than Enterprise’s 1.9x. That means distributable cash flow could fall more than 50% before the payout was uncovered, in my arithmetic.The growth story is real too. 24/7 Wall St. reports Energy Transfer is supplying about 900 million cubic feet a day of natural gas to data centers tied to Oracle, and management expects to spend $5 billion or more on growth each year through the decade. The units trade at about 13 times forward earnings against about 20 times for Kinder Morgan, per TIKR. Energy Transfer has also delivered: it was up about 29% this year as of late October. For an investor who focuses on the future, the case is not hard to see.
The Risk: Leverage, Spending and History
Now the other side. Energy Transfer’s leverage target of 4x to 4.5x debt to EBITDA compares with Enterprise’s 3.0x, plus or minus 0.25. Higher leverage matters most when things go wrong. In my illustration, a 20% fall in EBITDA would raise leverage from 4.25x to about 5.3x at Energy Transfer but only from 3.0x to 3.75x at Enterprise, and a 30% fall would lift them to 6.1x and 4.3x. Energy Transfer’s debt had also climbed to about $70 billion, and 24/7 Wall St. reported that operating cash fell about $879 million short of covering capex and distributions in 2025, so growth is partly funded by borrowing.Spending is the second issue. Energy Transfer plans $5.6 to $5.9 billion of growth capex in 2026, about 1.8 times Enterprise’s $2.9 to $3.4 billion, and says it will spend $5 billion or more a year through the decade. Projects can earn good returns, but they also raise leverage and execution risk. And part of the recent earnings strength was temporary: 24/7 Wall St. says a 31% surge in EBITDA included $212 million from NGL premiums and $113 million from wider basis spreads, windfalls that could fade.
The third issue is history. In 2020, Energy Transfer cut its distribution by 50% to reduce leverage during the pandemic, and the Motley Fool author also cites the called-off Williams deal, which raised concerns about convertible securities that turned out not to matter when no cut occurred. Management has since reset, and the cut did reduce leverage, but a track record is a fact, not an opinion. For an income investor, a payout that has been cut once is a payout that can be cut again, and I cannot rule it out.
ET: leverage target 4–4.5x, growth capex $5.6–$5.9B, debt about $70B, 50% payout cut in 2020, coverage about 2.2x. EPD: leverage about 3.0x, growth capex $2.9–$3.4B, 97% fixed-rate debt at 4.7%, 27–28 straight years of increases, coverage 1.9x. A 20% EBITDA drop lifts ET’s leverage to about 5.3x and EPD’s to about 3.75x.
Enterprise Products: Reliable and Boring
Enterprise is often called the gold standard of midstream income, and the numbers support the nickname. It has raised its distribution for 27 to 28 straight years, through energy downturns and crises, according to different articles. It targets leverage of about 3.0 times, covers its payout 1.9 times with distributable cash flow, and holds the highest credit rating in the sector, according to one source. About 97% of its debt is fixed-rate at an average cost of 4.7%, which protects it if rates rise, and it has about $6.5 billion of projects under construction.Enterprise is not risk-free, and it is not a growth story: it raises its payout about 3% a year, and its revenue growth has recently been in the mid-single digits. It still depends on oil, gas and natural gas liquids volumes, on contracts and on the demand for its pipelines, and its units can fall in a sell-off. Its yield, about 5.8% to 6.1%, is also lower than Energy Transfer’s. The point is not that it cannot disappoint, but that its balance sheet and record give it a bigger cushion, and you pay for that cushion with a lower yield.
The Math of Extra Yield
Here is what the extra yield is worth. At about $20.28 a unit, Energy Transfer’s $1.36 distribution yields about 6.7%; at $37.37, Enterprise’s $2.24 yields about 6.0%, a gap of about 0.7 points. On $10,000, that is about $671 a year against $599, or $71 more. On $100,000 it is about $6,700 against $5,990. Unit prices move daily, so at $21 Energy Transfer would yield 6.5% and at $19, 7.2%.Now the other side of the trade. If Energy Transfer cut its payout by about 10.6%, its yield would fall to Enterprise’s 6.0%, erasing the premium. A repeat of the 2020 cut of 50% would turn $6,700 of annual income on $100,000 into about $3,350, less than half of what Enterprise would pay. Growth narrows the gap: at 3% a year Energy Transfer’s distribution would reach about $1.83 in 10 years and at 5% about $2.22, while Enterprise at 3% would reach about $3.01, so the higher yield and higher growth target are not a free lunch but a trade of risk for income.
What the Peers Offer
There are other choices in the sector. MPLX, a midstream partnership, has a forward yield of about 8.2% and, according to the Motley Fool, management has committed to a 12.5% distribution increase in both 2026 and 2027, well above Energy Transfer’s and Enterprise’s growth rates. Kinder Morgan yields about 3.4%, much lower, and trades at a premium valuation of about 20 times forward earnings, reflecting its natural gas and LNG exposure. I did not retrieve balance-sheet details for MPLX or Kinder Morgan, so I make no safety comparison.The comparison is a reminder that yield and safety trade off, and that high yields come with questions. A higher yield may mean a riskier payout or a lower expected price, and a lower yield may mean a more reliable one. Each partnership has its own contracts, customers and capital plans. Looking at coverage, leverage, spending and track record for each, as I have done for Energy Transfer and Enterprise, is a better guide than the headline yield alone.
Other Things to Weigh
Taxes matter for partnerships. In my general knowledge, which I did not retrieve in detail, master limited partnerships such as Energy Transfer and Enterprise issue a Schedule K-1 rather than a 1099, distributions can include a return of capital that defers tax and holding them in a retirement account can raise complications. One source notes the tax implications of the MLP structure. If you hold them in a taxable account, talk to a tax professional first, since the paperwork is more complex than for ordinary dividend stocks.Also compare the yield with the alternatives. A 52-week Treasury bill pays about 4.46%, the 10-year yield is near 4.93% and top savings accounts about 4.35%, so Energy Transfer’s roughly 6.7% yield is about 2.3 points above cash and 1.8 above the 10-year. That premium is the pay for taking equity risk, price swings and the possibility of a cut. Remember that unit prices can fall: a 20% price decline would wipe out nearly nine years of that yield premium over cash (20 divided by 2.3). Income is only part of the return.
How to Think About It
Start with your goal. If you need reliable income and would be unhappy with a cut, the balance sheet and track record matter more than the extra 0.7 points, which argues for the more conservative name or for diversifying across several. If you can tolerate more risk for more income and believe in Energy Transfer’s growth plan and its leverage reduction, the higher yield may suit you. Either way, avoid putting too much in one partnership or one sector: pipelines are tied to energy demand, commodity prices and, for Energy Transfer, data-center gas demand.Then do the work. Read each company’s latest results, check coverage, leverage and capital plans and compare them over time, not just in one quarter. Remember Bessembinder’s finding that a few stocks create most market wealth, which argues for diversification instead of chasing the highest yield. Decide how large a position you could hold if the distribution were cut in half and the unit price fell, and size it accordingly. This is general education, not personal advice.
A high yield is partly compensation for risk. Distributions are not guaranteed, unit prices can fall and a payout that has been cut once can be cut again. Size positions so a cut would not harm your plans. Common mistakes include buying the highest yield without checking coverage and leverage, focusing on one good quarter, ignoring a company’s history, overlooking MLP tax paperwork, holding too much in one sector, treating a distribution as guaranteed and expecting the yield to stay the same when the unit price moves. Another is comparing yields without comparing safety. The yield is the headline, and the balance sheet is the story.
Conclusion
Energy Transfer’s roughly 6.5% to 7% yield is attractive, and the numbers behind it are decent: 19 straight quarterly raises, about 2.2x coverage and a real growth story in natural gas. The risk the headline points to is the cushion: a 4x to 4.5x leverage target against about 3x at Enterprise Products, $5.6 to $5.9 billion of growth capex against $2.9 to $3.4 billion, about $70 billion of debt, some temporary earnings windfalls and a 50% distribution cut in 2020. Enterprise’s 27 to 28 years of increases, 97% fixed-rate debt and 1.9x coverage give it a record Energy Transfer cannot yet match.In my arithmetic, the extra yield is about 0.7 points, $71 a year per $10,000, and an 11% payout cut would erase it. Whether to take that trade depends on your need for reliability, your risk tolerance and your portfolio. Check the filings, size your position for a bad outcome and consider the taxes. Neither partnership is guaranteed, and I cannot predict their payouts or prices. This is general education, not personalized investment advice.
Frequently Asked Questions
Is Energy Transfer’s distribution safe?It is well covered at the moment: reported distributable cash flow coverage is about 2.2x to 2.3x, and the partnership has raised its payout for 19 straight quarters to $0.34 a unit, or $1.36 a year. But it runs more leverage than peers, plans heavy growth spending and cut its distribution by 50% in 2020. Safe today does not mean immune to a downturn, and I cannot predict its future payouts.
What is the main risk the headline refers to?
A Motley Fool article published November 7 points to Energy Transfer’s history, a 2020 distribution cut and the called-off Williams deal, as the risk behind its 6.5% yield. In my analysis, the risk is the combination of higher leverage (a 4x to 4.5x target), heavy capital spending and that track record, which together make the payout more sensitive to a downturn than Enterprise Products’.
How do Energy Transfer and Enterprise Products compare?
Energy Transfer yields more, about 6.5% to 6.7% against 5.8% to 6.1%, and targets 3% to 5% distribution growth. Enterprise has lower leverage (about 3.0x), 97% fixed-rate debt at a 4.7% average cost, 1.9x coverage, a high credit rating and 27 to 28 straight years of distribution increases. Sources differ on the exact streak and yields, which move with prices.
Are MLP distributions taxed differently?
Yes, in my general knowledge. Partnerships such as Energy Transfer and Enterprise issue a Schedule K-1 instead of a 1099, and distributions can include a return of capital that defers some tax, with possible complications in retirement accounts. One source mentions the tax implications of the MLP structure. I did not retrieve details, so check with a tax professional.
Should I buy the higher yield?
That depends on your goals, risk tolerance and the rest of your portfolio, and I cannot say. In my arithmetic, Energy Transfer’s yield premium over Enterprise is about 0.7 points, or about $71 a year per $10,000, and a payout cut of about 11% would erase it. This is general education, not personal advice.
0 Comments
Be the first to share your thoughts on this article.