
Spending
How Have Prices Changed Since the Iran War Began?

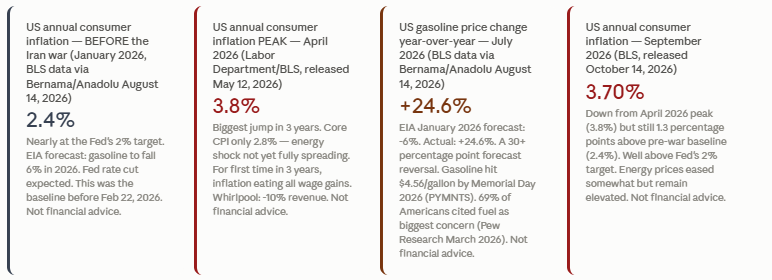
January 2026: inflation at 2.4%, on track for Fed rate cuts, gasoline forecast to fall 6%. By April: CPI hit 3.8% — biggest jump in 3 years. Gasoline: +24.6% by July. The Strait of Hormuz closed. The numbers, month by month. In January 2026, American inflation was at 2.4%. The Federal Reserve was expected to cut interest rates. The Energy Information Administration forecast petrol prices would fall 6% across the year. The long post-COVID normalisation of prices seemed finally within reach. On approximately February 22, 2026, the United States and Israel attacked Iran. In response, Iran closed the Strait of Hormuz — the waterway through which roughly 20% of global oil trade passes — and struck regional energy infrastructure. The oil market, which trades globally, responded immediately. Within weeks, gasoline had crossed $4 per gallon. By March, energy prices had surged 12.5% year-over-year and 10.9% in a single month. By April, headline inflation had hit 3.8% — its biggest jump in three years. By July, gasoline was 24.6% above year-ago levels. September 2026 CPI: 3.70%. This article documents the price changes category by category, month by month, using Bureau of Labor Statistics data and reporting from multiple sources. It does not make political judgements. It reports prices.
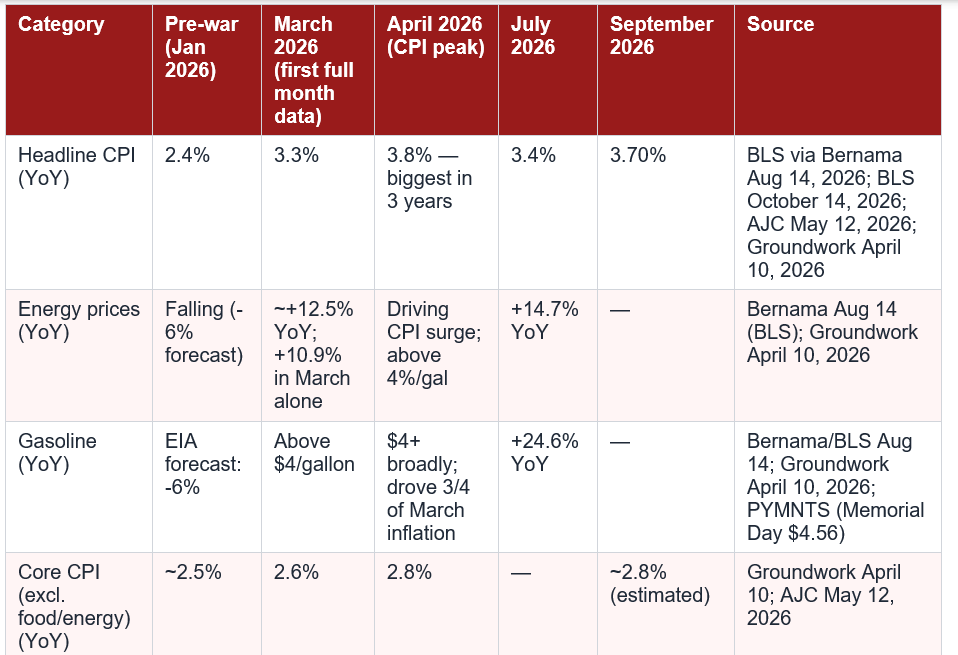
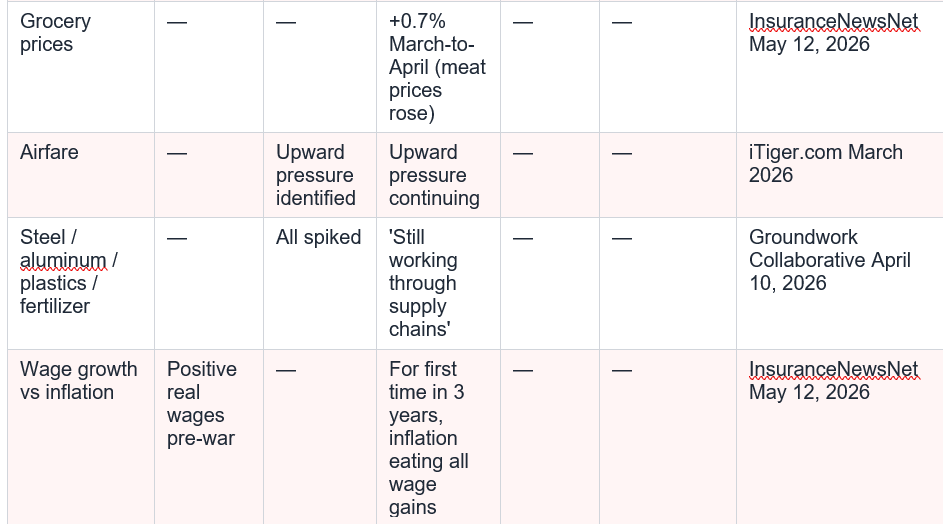
Notes: (1) September 2026 CPI of 3.70% is from BLS data released October 14, 2026. (2) Pre-war EIA January 2026 gasoline forecast was -6%; actual July 2026 was +24.6% — a forecast reversal of more than 30 percentage points. (3) Some category data is not available for all months as reporting varied. (4) All figures are from named, dated sources.
CPI remains well above the Fed's 2% target. Capital Economics warned: 'a prolonged war would keep inflation elevated and increase the risk of it spreading more broadly across goods and services.' Second-round effects on food, manufacturing, and services may still be filtering through supply chains. Not financial advice.
The United States and Israel attacked Iran on approximately February 22, 2026, referenced across multiple AP and local news reports covering the April and May 2026 CPI releases. Iran's response included closing the Strait of Hormuz and striking regional energy infrastructure. The first full CPI snapshot after the conflict's onset was the March 2026 report, published April 10, 2026, which showed CPI rising to 3.3% year-over-year (up from 2.4% in February) with energy prices up 12.5% year-over-year and 10.9% in March alone. Sources: Groundwork Collaborative April 10, 2026; iTiger.com March 2026; AJC May 12, 2026.
What was the CPI reading at the peak of the Iran war inflation shock?
The highest recorded CPI reading was 3.8% year-over-year in April 2026 — described by multiple news outlets including the Atlanta Journal-Constitution and Alaska Dispatch News as 'the biggest jump in three years.' This was reported by the Labor Department on May 12, 2026. Core CPI (excluding food and energy) was 2.8% year-over-year in April, suggesting the energy price shock had not yet fully spilled over into a broad inflation of other goods. Sources: AJC May 12, 2026; ADN May 12, 2026; InsuranceNewsNet May 12, 2026.
How much did gasoline prices increase?
In January 2026, the Energy Information Administration forecast gasoline prices would fall 6% across 2026. By July 2026, gasoline was 24.6% higher than a year earlier, according to Bureau of Labor Statistics data cited in Bernama's August 14, 2026 report. During the Memorial Day weekend 2026 (late May), gasoline reached $4.56 per gallon (PYMNTS Intelligence 2026 consumer research). Rising gasoline prices accounted for nearly three-fourths of the increase in headline inflation in March 2026. Source: Bernama/BLS August 14, 2026; Groundwork Collaborative April 10, 2026; PYMNTS 2026.
Why did US oil prices rise even though the US imports little oil through the Strait of Hormuz?
Oil is a globally traded commodity. Its price is set by global supply and demand, not by individual bilateral trade routes. When the Strait of Hormuz — through which approximately 20% of global oil trade passes — was closed by Iran, global oil supply contracted. This raised the global price of crude oil, which is what US refiners pay regardless of where the oil physically originates. The Bernama/Anadolu Agency August 14, 2026 report explained: 'Although the US imported relatively little of its oil directly through Hormuz before the war, crude is traded on a global market.
What is the CPI as of October 2026?
The Bureau of Labor Statistics released the September 2026 CPI data on October 14, 2026, showing annual consumer inflation of 3.70%. This is down from the April 2026 peak of 3.8% but well above the pre-war level of 2.4% in January 2026. It also remains above the Federal Reserve's 2% target. The September 2026 figure represents approximately 1.3 percentage points of additional inflation compared to the pre-war baseline.
Table of Contents
- The Starting Point: Where Prices Were Before the Conflict
- February-March 2026: The First Price Shock
- April-May 2026: The 3.8% Peak — Biggest Jump in Three Years
- June-July 2026: Some Easing, But Prices Remain Elevated
- The Petrol Pump Story: From a Forecast Fall to a 24.6% Rise
- Groceries, Airlines, and Manufacturing: The Second-Round Effects
- The Month-by-Month Price Tracker: All Categories
- Why the US Can’t Be Insulated: The Global Oil Market
- What Has and Hasn’t Eased by October 2026
- Conclusion: From a 6% Forecast Fall to a 3.70% CPI — The Economic Cost of Six Months
- Frequently Asked Questions
The Starting Point: Where Prices Were Before the Conflict
To understand what the Iran war has done to prices, the starting point matters. In January 2026 — before the United States and Israel attacked Iran on approximately February 22, 2026 — the United States was about as close to inflation normality as it had been since the COVID-19 supply chain crisis of 2021-2022. Annual consumer inflation stood at 2.4% in January 2026, according to the Bureau of Labor Statistics data cited by Bernama’s Anadolu Agency report from August 14, 2026. The Federal Reserve’s target is 2%. The country was almost there. The Energy Information Administration had forecast, in January 2026, that US gasoline prices would fall 6% across the year. The direction was down. The inflation trajectory was one of gradual normalisation after the sustained 9.1% peak of June 2022 that had been driven by post-COVID supply chain disruptions and the Russian invasion of Ukraine. Multiple news sources covering the April and May 2026 CPI releases note this context: ‘Inflation had been dropping more or less steadily since peaking with a 9.1% year-over-year spike in June 2022.’ By early 2026, the price of petrol at the pump was falling. The grocery bill was stabilising. The expectation was a Fed rate cut. That was January. February changed everything. Pre-war (January 2026): annual consumer inflation 2.4% (Bernama/BLS August 14, 2026). EIA January 2026 forecast: US gasoline prices to FALL 6% in 2026. CPI had been falling steadily from 9.1% peak (June 2022). Fed on track for a rate cut.February-March 2026: The First Price Shock
The United States and Israel attacked Iran on approximately February 22, 2026. Iran’s response included striking regional energy infrastructure and closing the Strait of Hormuz — the strategically critical waterway through which approximately 20% of global oil trade passes. The Cayman Compass/ESO analysis of the global energy shock was direct: ‘In response to US and Israeli attacks, Iran has struck regional energy infrastructure and closed the Strait of Hormuz, a key global waterway for the shipment of oil and gas. As a result, global energy prices have rocketed.’ The March 2026 CPI report — the first full snapshot of inflation since the onset of the conflict — showed the immediate impact. Consumer prices rose 3.3% year-over-year in March, up sharply from 2.4% in February. Prices jumped 0.9% in the single month of March alone. The energy component of the index told the story most clearly: energy prices surged 12.5% over the prior year and 10.9% in March alone (Groundwork Collaborative April 10, 2026 citing BLS). Rising gasoline prices accounted for nearly three-fourths of the increase in headline inflation in March. Gasoline crossed $4 per gallon. Steel, aluminum, plastics, and fertilizer prices all spiked — and as Capital Economics analyst Ryan observed, the effects were still working through supply chains. US/Israel attacked Iran ~February 22, 2026. Iran closed the Strait of Hormuz. March 2026 CPI: +3.3% YoY (up from 2.4% in February); +0.9% in March alone. March energy prices: +12.5% YoY; +10.9% in one month. Gasoline accounted for nearly 3/4 of March inflation. Steel, aluminum, plastics, fertilizer: all spiked. .April-May 2026: The 3.8% Peak — Biggest Jump in Three Years
The April 2026 CPI report, released in May, confirmed that the energy shock was deepening rather than stabilising. The Labor Department’s Consumer Price Index rose 3.8% year-over-year in April 2026 — the biggest jump in three years — up from the already-elevated 3.3% reading in March. Multiple news outlets including the Atlanta Journal-Constitution, Alaska Dispatch News, Las Vegas Sun, InsuranceNewsNet, and others reported this figure from the same Labor Department data release. Excluding volatile food and energy costs, core consumer prices rose 0.4% from March to April and 2.8% from April 2025 — relatively modest readings that suggested the energy price burst had not yet fully spilled over into prices for other goods. But the aggregate picture was stark: for the first time in three years, inflation was eating up all wage gains, as InsuranceNewsNet reported. Whirlpool, the appliance manufacturer that makes KitchenAid and Maytag, reported revenue had dropped nearly 10% in its most recent quarter and called the war a ‘recession-level industry decline’ that had undermined consumer confidence. The Federal Reserve, which had been expected to cut benchmark interest rates in 2026, turned cautious — waiting to see how long the conflict would last and whether higher energy prices would spill over more broadly. April 2026 CPI: +3.8% YoY — biggest jump in 3 years (Labor Department via AJC/ADN/Las Vegas Sun/InsuranceNewsNet May 12, 2026). Core CPI April: +2.8% YoY (modest — energy not yet broadly spreading). Whirlpool revenue: -10%; 'recession-level industry decline.' For first time in 3 years, inflation eating up all wage gains. Fed abandoned planned rate cut.June-July 2026: Some Easing, But Prices Remain Elevated
The July 2026 data, reported by Bernama’s Anadolu Agency in its August 14, 2026 dispatch on the six-month anniversary of the war’s beginning, showed some easing from the April peak but prices that remained significantly above pre-war levels. Annual consumer inflation stood at 3.4% in July, down from the 3.8% April peak but still well above the 2.4% that prevailed in January before the conflict began. Petrol prices eased in July but remained 24.6% higher than a year earlier, according to the Bureau of Labor Statistics. Overall energy prices were up 14.7% year-over-year by July. The Bernama analysis explained the transmission mechanism: ‘Higher crude oil prices increase costs for trucking, shipping and manufacturing, meaning the impact does not end when motorists leave the pump. Food and other goods can eventually become more expensive as businesses face higher transportation and production costs.’ The regional variation was also noted: the impact varied considerably across the country, with states more dependent on imported oil or further from refinery infrastructure seeing larger price impacts. The EIA’s original January forecast of a 6% fall in gasoline prices for 2026 had been entirely reversed. July 2026: annual CPI 3.4% (Bernama/BLS August 14, 2026) — down from 3.8% April peak but up from 2.4% pre-war. Gasoline July 2026: +24.6% YoY (BLS). Energy prices July: +14.7% YoY (BLS). EIA January forecast: -6% gasoline vs actual +24.6% — a 30.6 percentage point reversal.The Petrol Pump Story: From a Forecast Fall to a 24.6% Rise
The most viscerally felt price change since the Iran war began has been at the petrol station. The Bernama/Anadolu Agency August 14 report stated the central fact plainly: ‘Nearly six months into the US war with Iran, its most visible impact for ordinary Americans is increasingly being felt far from the battlefield, at gas stations, airports, and in household budgets.’ The pre-war EIA forecast in January 2026 was a 6% fall in gasoline prices. By July 2026, gasoline was 24.6% above year-ago levels. That is a forecast reversal of more than 30 percentage points in roughly six months. The Groundwork Collaborative’s April 2026 analysis of the March CPI data put the public messaging bluntly: ‘Today’s inflation report comes as no shock to anyone who has filled up their gas tank in the past month.’ Gasoline crossed $4 per gallon early in the conflict and reached $4.56 at the Memorial Day weekend in late May 2026 — data later confirmed in PYMNTS Intelligence’s 2026 consumer spending research. The Pew Research Centre’s survey conducted March 23-29, 2026 found that 69% of Americans were worried the Iran war would result in higher petrol and fuel prices — making energy costs the public’s single biggest concern about the conflict, above any other category. The Bernama analysis also noted the structural reason that the US cannot be insulated from Middle East oil price shocks even though it imports relatively little oil directly through Hormuz: ‘crude is traded on a global market. EIA January 2026 forecast: gasoline -6%. Actual July 2026: gasoline +24.6% YoY (BLS). Memorial Day 2026: $4.56/gallon (PYMNTS). 69% of Americans: biggest concern about conflict = energy/fuel prices (Pew Research March 23-29, 2026 via Bernama). Strait of Hormuz closure: global oil market means even non-Hormuz-dependent US affected.Groceries, Airlines, and Manufacturing: The Second-Round Effects
The energy price shock that dominated the first months of the war has a known transmission mechanism into the broader economy: higher crude oil raises the cost of trucking and shipping, which raises the cost of delivering every product that travels by road or sea. The March 2026 iTiger analysis cited Capital Economics analyst Ryan: ‘Some inflationary effects from energy prices could take months to filter through supply chains to consumers, and the impact could be quite broad.’ Steel, aluminum, plastics, and fertilizer prices all spiked in the early months of the conflict — and as the Groundwork Collaborative noted in April 2026, these ‘rises in input costs were still working through supply chains.’ Grocery prices rose 0.7% from March to April as meat prices rose (InsuranceNewsNet May 12, 2026). Airfare was identified as an area facing upward pressure in the March 2026 CPI analysis (iTiger). The Bernama/Anadolu August 14 report confirmed the broad pattern six months in: ‘Food and other goods can eventually become more expensive as businesses face higher transportation and production costs.’ The core CPI — which excludes food and energy — remained relatively modest at 2.8% year-over-year in April 2026, suggesting that the second-round spillover was not yet accelerating significantly. But economists consistently warned that a prolonged conflict would change this picture. Grocery prices: +0.7% March to April 2026 as meat prices rose (InsuranceNewsNet May 2026). Steel, aluminum, plastics, fertilizer: all spiked (Groundwork April 2026). Airfare: upward pressure identified March 2026 (iTiger). Core CPI April: +2.8% YoY — still modest, suggesting limited second-round effects as of May 2026. Capital Economics: impact 'could be quite broad' and 'could take months.The Month-by-Month Price Tracker: All Categories
This table compiles the available BLS data and named-source reporting on price changes across key categories from before the war (January 2026) through the most recent available data (September 2026). All figures are from named sources with dates.Notes: (1) September 2026 CPI of 3.70% is from BLS data released October 14, 2026. (2) Pre-war EIA January 2026 gasoline forecast was -6%; actual July 2026 was +24.6% — a forecast reversal of more than 30 percentage points. (3) Some category data is not available for all months as reporting varied. (4) All figures are from named, dated sources.
Why the US Can’t Be Insulated: The Global Oil Market
A recurring point in the reporting on this conflict is the question of why the United States — which has significantly expanded domestic oil production since the 2010s and imports relatively little oil directly through the Strait of Hormuz — is experiencing the energy price shock it is. The Bernama/Anadolu Agency August 14 report provides the structural answer: ‘Although the US imported relatively little of its oil directly through Hormuz before the war, crude is traded on a global market.’ Oil is a globally traded commodity. Its price is set not by individual bilateral trade flows but by the intersection of global supply and global demand. When the Strait of Hormuz — through which approximately 20% of global oil trade passes — is disrupted or closed, global supply contracts. When global supply contracts and demand is unchanged, the global oil price rises. That global price is what determines what US refiners pay for crude, regardless of where that crude physically originates. The Cayman Compass analysis of the Strait of Hormuz closure explained the cascade: energy price rises take three to four months to filter through to consumers’ bills because of shipping timelines and fuel storage at power utilities. The Capital Economics analyst quoted in iTiger’s March 2026 report identified the breadth of the transmission: the effects ‘could be quite broad’ and the risk is that ‘a prolonged war would keep inflation elevated and increase the risk of it spreading more broadly across goods and services. Bernama August 14, 2026: 'Although the US imported relatively little of its oil directly through Hormuz before the war, crude is traded on a global market.' Strait of Hormuz: ~20% of global oil trade passes through it. Energy price changes filter to consumer bills 3-4 months after market shifts (Cayman Compass/CUC VP). Capital Economics: prolonged war risks broader inflation spreading across goods/services.What Has and Hasn’t Eased by October 2026
As of the October 2026 BLS release showing September CPI at 3.70%, the picture is one of partial easing from the April 2026 peak but persistent elevation above pre-war levels. Petrol prices eased somewhat in July compared to their peak — though remained 24.6% above year-ago levels according to BLS data cited by Bernama. Overall headline inflation has come down from the 3.8% April peak to 3.4% in July and 3.70% in September. Core inflation — the measure that excludes food and energy and therefore better reflects the domestic, non-energy economy — remained relatively contained at around 2.8%, suggesting that the second-round spillover from energy into a broad generalised inflation of other goods had been limited as of the available data. The Federal Reserve remains cautious. Having abandoned its planned 2026 rate cut after the conflict began, the Fed in its post-war communications emphasised the need to remain ‘nimble’ — language that signals neither a definitive rate cut nor a definitive rate rise, but sustained watchfulness. The September 2026 CPI reading of 3.70% remains well above the Fed’s 2% target. Whether it continues to moderate, stabilises here, or rises further depends primarily on the trajectory of the conflict and the duration of any Strait of Hormuz disruption. September 2026 CPI: 3.70% (BLS, October 14, 2026) — down from April 2026 peak of 3.8%. Core CPI relatively contained at ~2.8% — second-round spillover to other goods limited so far. Petrol eased from peak in July but still +24.6% YoY. Fed remains cautious.CPI remains well above the Fed's 2% target. Capital Economics warned: 'a prolonged war would keep inflation elevated and increase the risk of it spreading more broadly across goods and services.' Second-round effects on food, manufacturing, and services may still be filtering through supply chains. Not financial advice.
Conclusion
In January 2026, before the United States and Israel attacked Iran, the inflation story was one of near-completion. Consumer prices at 2.4%. Gasoline forecast to fall 6%. A Federal Reserve rate cut on the horizon. By May 2026, CPI had reached 3.8% — its biggest jump in three years. Gasoline had crossed $4 per gallon and by July was 24.6% above year-ago levels. For the first time in three years, inflation was eating up all wage gains. Whirlpool called the environment a ‘recession-level industry decline.’ The Federal Reserve’s planned rate cuts were shelved. The Strait of Hormuz — closed by Iran in response to the US/Israeli attacks — disrupted global energy flows across a market that knows no borders. As of October 2026, the September CPI reading of 3.70% shows that some cooling has occurred from the April peak but that inflation remains nearly 1.7 percentage points above where it was before the conflict began. The EIA’s January forecast of a 6% fall in gasoline prices and the actual July outcome of a 24.6% rise represent a 30-plus percentage point reversal driven by eight months of conflict. The 69% of Americans who told Pew Research in late March 2026 that energy costs were their biggest concern about the war were right. That is what the data shows.Frequently Asked Questions
When did the Iran war begin and when did prices start rising?The United States and Israel attacked Iran on approximately February 22, 2026, referenced across multiple AP and local news reports covering the April and May 2026 CPI releases. Iran's response included closing the Strait of Hormuz and striking regional energy infrastructure. The first full CPI snapshot after the conflict's onset was the March 2026 report, published April 10, 2026, which showed CPI rising to 3.3% year-over-year (up from 2.4% in February) with energy prices up 12.5% year-over-year and 10.9% in March alone. Sources: Groundwork Collaborative April 10, 2026; iTiger.com March 2026; AJC May 12, 2026.
What was the CPI reading at the peak of the Iran war inflation shock?
The highest recorded CPI reading was 3.8% year-over-year in April 2026 — described by multiple news outlets including the Atlanta Journal-Constitution and Alaska Dispatch News as 'the biggest jump in three years.' This was reported by the Labor Department on May 12, 2026. Core CPI (excluding food and energy) was 2.8% year-over-year in April, suggesting the energy price shock had not yet fully spilled over into a broad inflation of other goods. Sources: AJC May 12, 2026; ADN May 12, 2026; InsuranceNewsNet May 12, 2026.
How much did gasoline prices increase?
In January 2026, the Energy Information Administration forecast gasoline prices would fall 6% across 2026. By July 2026, gasoline was 24.6% higher than a year earlier, according to Bureau of Labor Statistics data cited in Bernama's August 14, 2026 report. During the Memorial Day weekend 2026 (late May), gasoline reached $4.56 per gallon (PYMNTS Intelligence 2026 consumer research). Rising gasoline prices accounted for nearly three-fourths of the increase in headline inflation in March 2026. Source: Bernama/BLS August 14, 2026; Groundwork Collaborative April 10, 2026; PYMNTS 2026.
Why did US oil prices rise even though the US imports little oil through the Strait of Hormuz?
Oil is a globally traded commodity. Its price is set by global supply and demand, not by individual bilateral trade routes. When the Strait of Hormuz — through which approximately 20% of global oil trade passes — was closed by Iran, global oil supply contracted. This raised the global price of crude oil, which is what US refiners pay regardless of where the oil physically originates. The Bernama/Anadolu Agency August 14, 2026 report explained: 'Although the US imported relatively little of its oil directly through Hormuz before the war, crude is traded on a global market.
What is the CPI as of October 2026?
The Bureau of Labor Statistics released the September 2026 CPI data on October 14, 2026, showing annual consumer inflation of 3.70%. This is down from the April 2026 peak of 3.8% but well above the pre-war level of 2.4% in January 2026. It also remains above the Federal Reserve's 2% target. The September 2026 figure represents approximately 1.3 percentage points of additional inflation compared to the pre-war baseline.
0 Comments
Be the first to share your thoughts on this article.