
Spending
How UK Households Really Spend Money: 2026 Data

Table of Contents
- The Money Going Out Every Month
- The Average UK Household Budget in 2026: A Category Overview
- Spending by Household Type: How the Budget Varies Across Britain
- Category Deep Dives: What the ONS Data Really Shows
- Conclusion: The Picture Behind the Average
- Frequently Asked Questions (FAQ)
- How much does the average UK household spend per month in 2026?
- What does the average UK household spend on food per month?
- How does UK spending differ between renters and homeowners?
- Which UK spending categories have changed most since the cost of living crisis?
- How can I compare my spending to the UK average?
- External References & Further Reading
The Money Going Out Every Month
Every month, UK households make hundreds of individual spending decisions -- some deliberate, some automatic, some barely noticed. The sum of these decisions, tracked across 12,000 households in the Office for National Statistics' Living Costs and Food Survey and published in the ONS Family Spending report (released June 11, 2026 -- most current official data), paints a detailed and sometimes surprising picture of how British families actually allocate their money.In July 2026, NimbleFins estimated -- using ONS Family Spending data adjusted for inflation through May 2026 -- that the average UK household budget is £3,106 a month, or £37,267 a year. That is based on 2.3 people per household. But the average hides enormous variation: a single renter in London, a retired couple in Yorkshire, a family of four with a mortgage in Manchester, and a student household in Birmingham all fall within the same dataset while experiencing radically different financial realities. This guide unpacks the data -- by category, by household type, and by income band -- to show where UK money actually goes, what has changed since the cost of living crisis began, and what the spending patterns reveal about the financial health of British households.
The ONS Consumer Trends bulletin (released March 31, 2026) reported that household spending increased 0.8% annually in 2025 -- a modest real-terms rise that reflects the squeeze of persistent inflation against slow wage growth. Understanding how the spending pie is divided is the first step to making deliberate choices about how any individual household allocates its own version of that pie.
The Average UK Household Budget in 2026: A Category Overview
NimbleFins (July 2026, based on ONS data adjusted for May 2026 inflation): 'UK households currently spend £717 per week (£3,106 a month) on average to cover living expenses including a roof over our heads, food in our bellies, clothes on our backs, and transport to and from work or school.' The headline breakdown by the three largest categories: housing (up to 41-46%), transport (14%), and food (11%). Together these three categories consume approximately two-thirds of the average household budget before any leisure, clothing, health, education, or communications spending begins.The ONS Family Spending report (April 2024-March 2025, released June 11, 2026) provides the authoritative official breakdown using the Classification of Individual Consumption by Purpose (COICOP) framework. Transport remains the second-biggest proportional expense at 14% with spending up 9% in the financial year ending 2025. The report notes that real-terms expenditure figures are adjusted for inflation using the CPI specific to each COICOP category -- meaning the comparisons control for price level changes to show volume changes in consumption.
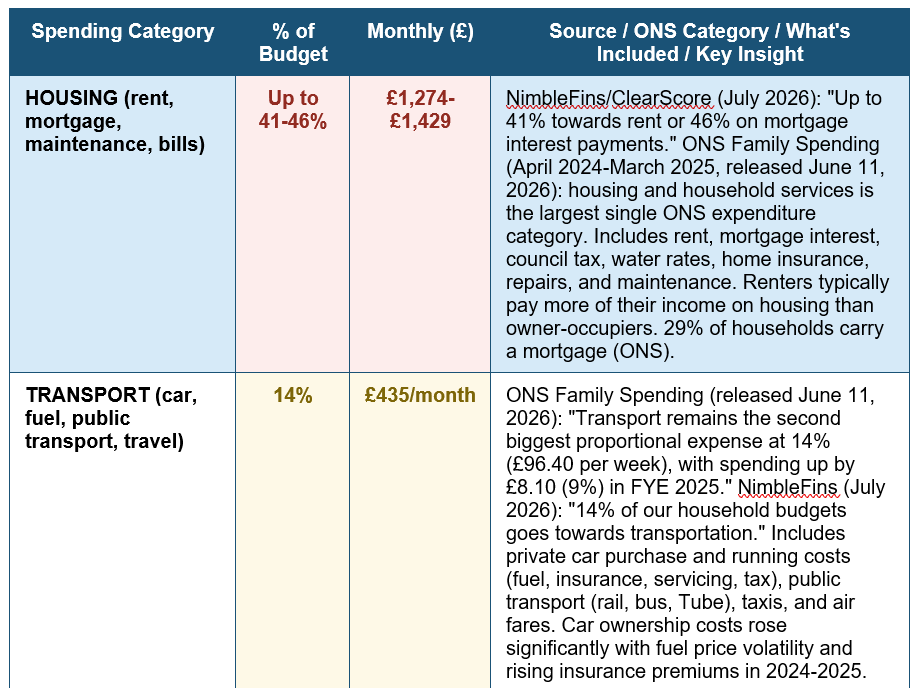
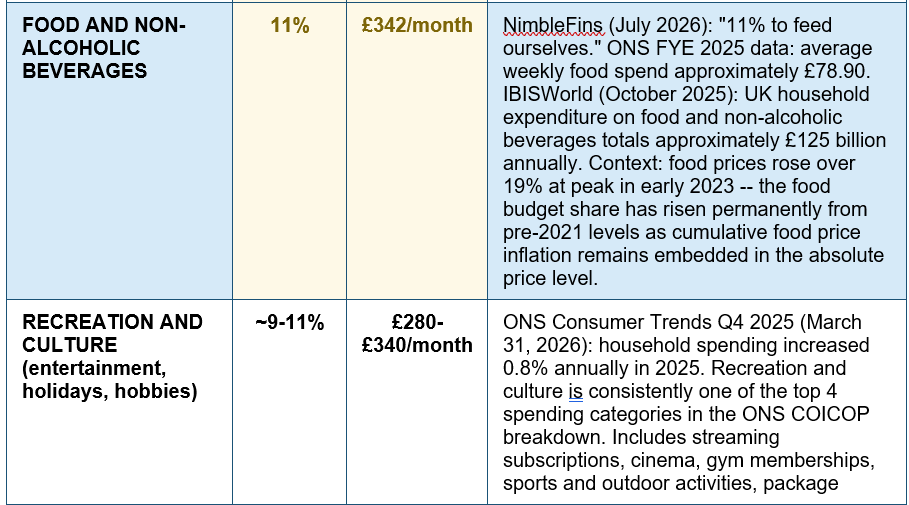
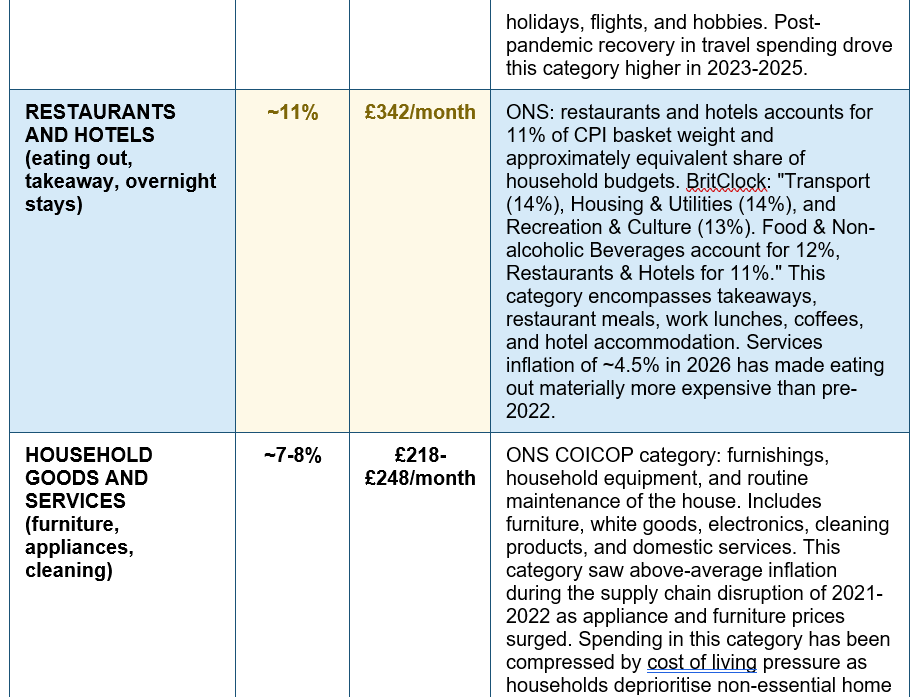
UK household spending in 2026 -- the headline numbers: £3,106/month average. £717/week. Housing up to 46%. Transport 14%. Food 11%. Education inflation 7.6%. Household spending +0.8% in 2025. — NimbleFins/ClearScore (July 2026 -- most current, ONS-based): 'Average UK household budget £3,106/month, £37,267/year, 2.3 people per household.' ONS Family Spending (released June 11, 2026 -- most current official data): 'Transport 14% (£96.40/week), up 9% FYE 2025.' ONS Consumer Trends Q4 2025 (March 31, 2026): 'Household spending increased 0.8% annually in 2025.' Statista (2 weeks ago): 'Education inflation 7.6% -- fastest rising category.' ONS June 2026 CPI bulletin: 'Clothing and footwear fell 0.5% -- lowest inflation category.'
Spending by Household Type: How the Budget Varies Across Britain
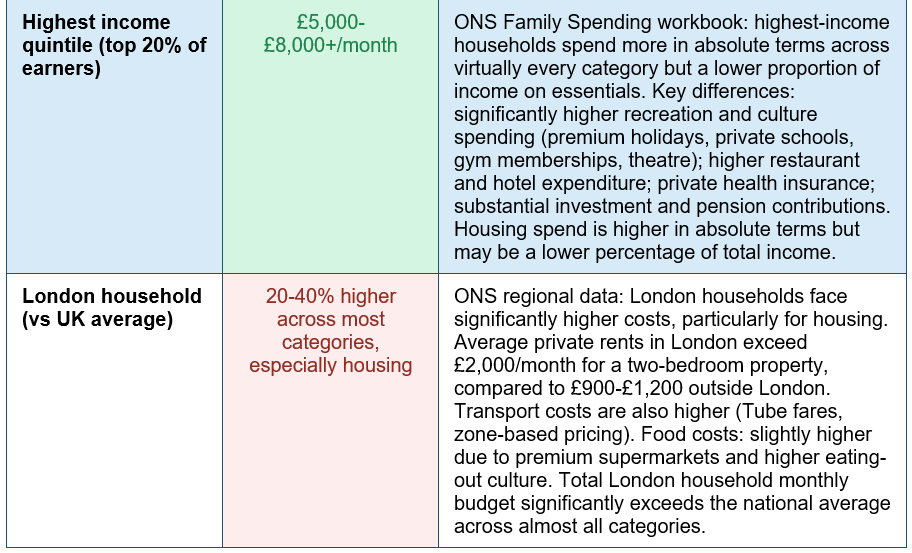
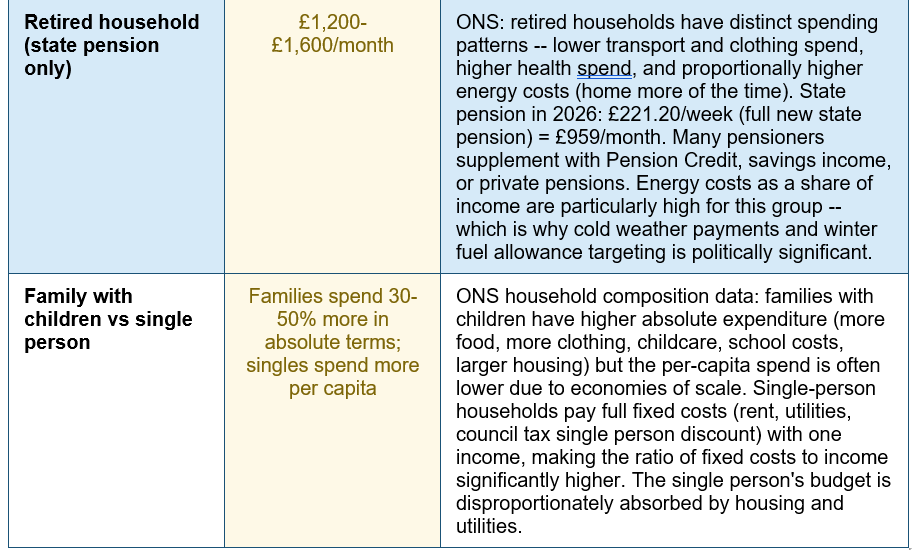
The £3,106 monthly average is the start of the picture, not the whole of it. The ONS Family Spending workbooks break spending down by income, region, age, tenure, and household composition -- revealing the enormous variation that the headline figure conceals: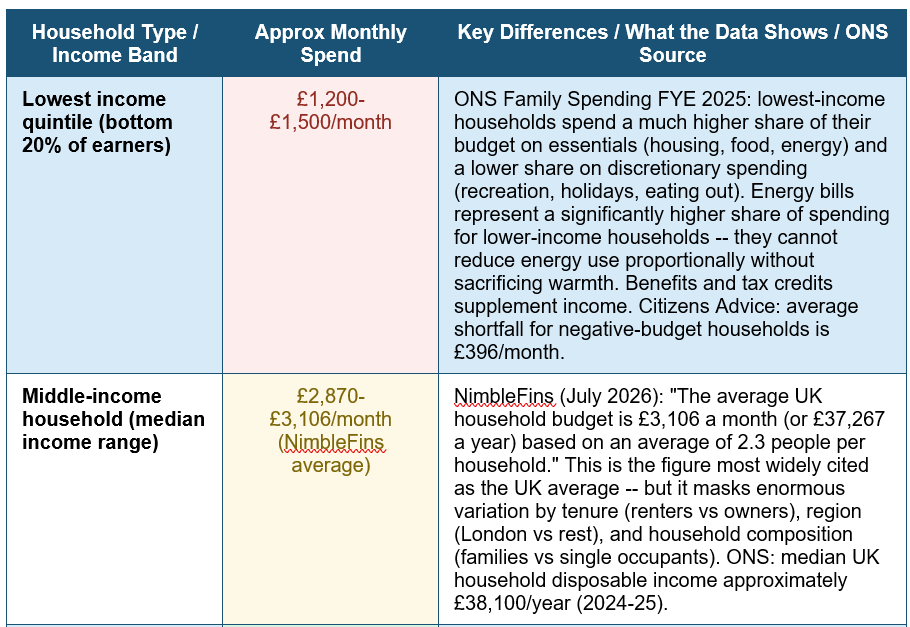
Category Deep Dives: What the ONS Data Really Shows
1 HOUSING -- THE DOMINANT AND DIVERGENT CATEGORY | Up to 46% of budget for mortgaged households. The biggest variable between household types.
Housing is the category where the average figure is most misleading. NimbleFins (July 2026): 'Up to 41% towards rent or 46% on mortgage interest payments.' But these figures apply only to households that rent or carry a mortgage. Approximately 29% of UK households own outright (no mortgage) and approximately 29% carry a mortgage; the remainder rent (private or social). For outright owners, housing costs are primarily maintenance, council tax, and utilities -- a much smaller proportion of income. For private renters, particularly in London, housing costs routinely consume 40-50% or more of income. Shelter (2025) data shows that over a quarter of private renters spend more than a third of their income on rent. The ongoing divergence in housing costs between renters and owners, between London and the rest of the UK, and between households with and without mortgages is the single biggest driver of income inequality in the UK spending data. The cost of living crisis has amplified this: inflation in rents has run above general inflation throughout 2022-2025, while mortgage costs surged for those refinancing from sub-2% fixed deals. Any understanding of UK household spending must account for tenure as the primary variable.2 TRANSPORT -- THE SECOND-LARGEST CATEGORY AND FASTEST RISING IN FYE 2025 | 14% of budget. Up 9% in FYE 2025. Car ownership costs and rail fares driving the increase.
ONS Family Spending (released June 11, 2026): 'Transport remains the second biggest proportional expense at 14% (£96.40 per week), with spending up by £8.10 (9%) in FYE 2025.' This 9% real increase in transport spending is significant -- it reflects the combined impact of fuel price volatility, rising car insurance premiums (which surged 20-40% in 2023-2024 as insurers adjusted for repair cost inflation), and regulated rail fare increases applied annually. Private car ownership dominates the transport budget for most UK households outside major urban centres. The average cost of car ownership in the UK (purchase depreciation, insurance, fuel, servicing, MOT, and road tax) typically runs £3,000-£8,000 per year depending on the vehicle. Rail season tickets in London and commuter zones add £2,000-£4,000 per year for commuters. The 14% transport share is notably higher than in many European countries because of the UK's comparatively low public transport investment outside London, meaning car ownership is less optional. ONS Consumer Trends Q4 2025 (March 31, 2026): household spending increased 0.8% annually in 2025, but transport's 9% rise significantly exceeded the overall rate.3 FOOD -- THE MOST EMOTIONALLY FELT CATEGORY | 11% of budget. Still recovering from 19% inflation peak. £125 billion total UK annual spend.
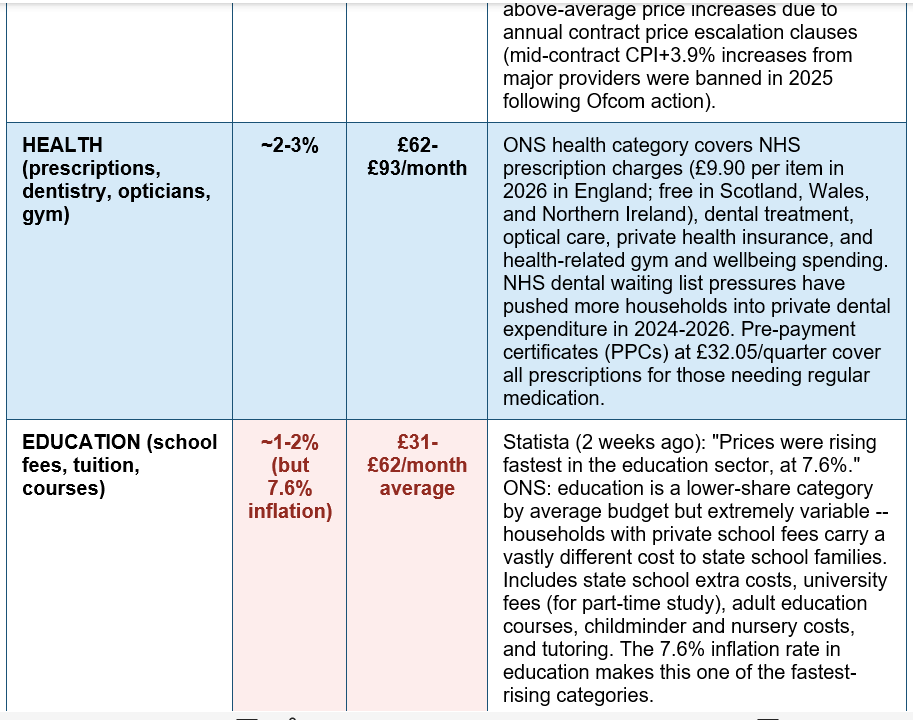
NimbleFins (July 2026): '11% to feed ourselves.' IBISWorld (October 2025): 'UK household expenditure on food and non-alcoholic beverages totals approximately £125 billion annually.' The food category has been through the most dramatic cost of living journey of any spending category: CPI food inflation hit 19% at its peak in early 2023, meaning a typical weekly shop rose by nearly a fifth in a single year. As of June 2026, food inflation has fallen to 1.7% (ONS), the lowest since August 2024 -- but the absolute price level remains approximately 25-30% above pre-2021 levels. The 11% budget share for food represents a structurally higher proportion than households experienced before 2021. UK household food spending breaks into two components: at-home eating (grocery shopping) and out-of-home eating (restaurants, cafes, takeaways). The Restaurants and Hotels ONS category (eating out) accounts for approximately 11% of the household budget separately -- meaning total food-related spending (at home plus eating out) represents approximately 22% of the average household budget. ONS June 2026: food contributed to the downward movement in CPI as food price inflation eased -- but the cumulative price level embedded since 2021 is not going to reverse.4 RECREATION AND CULTURE -- THE CATEGORY THAT REVEALS DISCRETIONARY PRIORITIES | 9-11% of budget. Post-pandemic travel recovery driving spending. Streaming subscription proliferation.
Recreation and culture is consistently one of the top four spending categories in the ONS COICOP framework, representing approximately 9-11% of the average household budget. BritClock (citing ONS CPI basket weights): 'Recreation & Culture (13%).' This category encompasses a wide range of spending: package holidays and flights (the single largest subcategory), streaming subscriptions (Netflix, Amazon Prime, Disney+, Apple TV+, Spotify, and others), gym memberships, sporting events, theatre, cinema, gaming, and hobby spending. The post-pandemic recovery in international travel drove this category higher in 2023-2025 -- pent-up demand led to significant increases in holiday and flight expenditure after the restrictions of 2020-2022. The proliferation of streaming subscriptions has created a new form of regular discretionary spending that is often underestimated: the average UK adult now has multiple active subscriptions, with research from Barclays suggesting the average spend is approximately £560/year. ONS Consumer Trends (Q4 2025): the consumer trends data released March 31, 2026 shows household spending increased 0.8% annually in 2025 -- suggesting that real-terms recreation spending has remained broadly stable despite cost of living pressure, perhaps reflecting the prioritisation of experiences and leisure that emerged strongly during and after the pandemic.5 COMMUNICATIONS AND UTILITIES -- THE OVERLOOKED MONTHLY DRAINS | 2-3% for communications. 14% for housing & utilities combined. Annual contract inflation hit households.
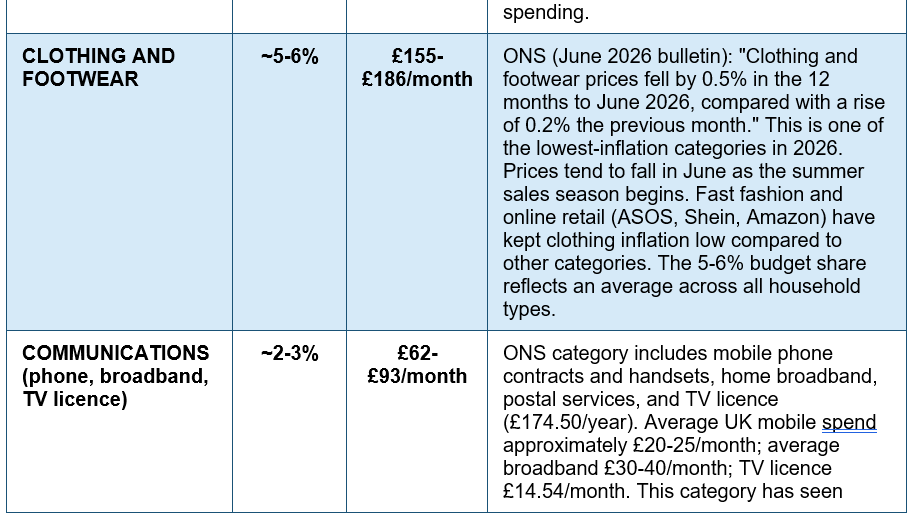
Communications -- mobile phones, broadband, TV licence, and postal services -- typically represent 2-3% of the UK household budget, but this modest-seeming share has been subject to significant controversy in recent years. Major broadband and mobile providers routinely applied mid-contract price increases of CPI+3.9% annually, which during 2022-2024 resulted in bill increases of 14-17% at a time when customers had signed up for specific quoted prices. Ofcom acted to ban these CPI-linked mid-contract increases from January 2025, requiring providers to state any future price increases clearly in pounds and pence at the point of sale. This regulatory change protects new customers from the most egregious examples of mid-contract inflation. The TV licence fee is £174.50 per year (£14.54/month) in 2026 -- a universal fixed cost for the approximately 75% of UK households that use live TV or BBC iPlayer. Average broadband costs run £30-40/month; mobile phone contracts £15-30/month. Combined, communications and pay-TV represent a real monthly cost of £60-100 for most households -- a category where annual comparison and switching can save £100-200/year.What the spending data reveals about the cost of living crisis -- the distribution effect. The ONS Household Costs Indices (May 28, 2026) provides a crucial additional layer of analysis: different households face different actual inflation rates depending on their spending profile. 'The difference in contributions between HCI and CPI for housing and household services have gradually decreased since October 2025. This is because of the falling growth rate of owner occupiers' housing costs, which are only included in the HCIs.' The Household Costs Index framework reveals that lower-income households -- who spend a higher share of income on essentials like energy, food, and housing -- experienced higher effective inflation rates during the 2021-2023 surge than the headline CPI figure suggested. A household spending 40% of income on housing and 20% on food faces a very different inflation profile than a household spending 15% on housing and 5% on food. This distributional inequality -- high-inflation categories hitting lower-income households hardest -- is the mechanism through which the cost of living crisis widened inequality in the UK. The recovery in food and energy inflation helps all households, but the absolute price level remains elevated, and the households least able to absorb it are still feeling the squeeze most acutely. NimbleFins (July 2026): 14% goes to transport, up to 46% to housing. For lower-income households, those proportions are even more skewed toward essentials, leaving even less for any form of discretionary spending.
THE FIVE WAYS UK HOUSEHOLDS ARE SPENDING MORE THAN THEY REALISE: (1) SUBSCRIPTIONS THAT AUTO-RENEWED. The average UK adult has £560/year in subscription spending (Barclays research). A significant share -- estimated at £180-240/year -- goes to services not actively used. Monthly subscription audits consistently reveal £15-50 in monthly spending on forgotten services. (2) FOOD WASTE. The average UK household throws away approximately £500-£700 of food per year (WRAP). This is food budget spend that produces zero nutritional value. Meal planning and the shop-the-fridge-first rule eliminate most of this without any change to diet quality. (3) INSURANCE AUTO-RENEWALS. Car and home insurance auto-renewal without comparison typically costs 20-40% more than switching. Annual insurance switching saves the average household £150-400/year. (4) COMMUNICATIONS CONTRACTS NOT REVIEWED. Mobile, broadband, and TV packages all have more competitive deals available to new customers than to existing ones. An annual review and willingness to switch or negotiate typically saves £100-200/year across communications. (5) UNNOTICED CREDIT COSTS. For the 48% of UK adults carrying credit or loan products, the interest cost is often not factored into the monthly budget. At the average 21.52% credit card APR on a £2,601 balance, the annual interest cost is approximately £560 -- equivalent to the entire subscription spend, often equally unnoticed.
HOW TO USE THE SPENDING DATA TO IMPROVE YOUR OWN BUDGET: STEP 1 -- BENCHMARK YOUR CATEGORIES: Using the spending breakdown in this guide, compare your own monthly spend in each category to the UK average. Identify the categories where you are significantly above average. Are they categories that genuinely reflect your priorities and values? Or are they categories where spending has drifted above what you would consciously choose? STEP 2 -- IDENTIFY YOUR BIGGEST CONTROLLABLE CATEGORY: Housing is the largest spend but often the hardest to change quickly. Transport (14%) is often more controllable -- a cheaper car, public transport, or car-sharing can save £200-500/month for some households. Food (11%) is the most behavioural -- meal planning and own-brand switching can save £100-250/month without any sacrifice in diet quality. STEP 3 -- AUDIT THE SMALLEST CATEGORIES MOST CAREFULLY: The 2-3% communication spend and the subscription slice of recreation are where the most painless savings typically hide. Run a full subscription audit (bank statement review for recurring charges). Set insurance comparison reminders for every renewal date. STEP 4 -- COMPARE YOUR INCOME SPEND RATIO TO THE NATIONAL DATA: If your housing costs exceed 35% of income, you are in the territory that Shelter identifies as housing stress. If your total essential spending (housing + food + utilities + transport) exceeds 70% of income, discretionary spending is structurally constrained. Both conditions suggest reviewing whether your income, housing, or other structural factors need addressing. FREE TOOLS: ONS Family Spending workbooks: ons.gov.uk | MoneyHelper Budget Planner: moneyhelper.org.uk
Conclusion
The average UK household spends £3,106 per month in July 2026, according to NimbleFins' analysis of ONS data. Housing takes up to 46% of the budget for mortgaged households. Transport consumes 14% -- up 9% in a single year. Food accounts for 11% at a price level 25-30% above pre-2021 levels. Education is the fastest-rising category at 7.6% inflation. Clothing is the only major category where prices actually fell in June 2026.But the average is a composite of radically different realities. The London renter spending 50% of income on housing. The rural family spending 20% of income on transport because public transport is not an option. The retired couple on a fixed income where energy costs represent 15% of spending. The high earner who spends 30% on recreation and barely notices food inflation. The ONS Family Spending data, released June 11, 2026, captures all of them simultaneously in a number that describes the average household that statistically does not exist.
What the data provides is a benchmark -- a reference point against which any household can measure their own spending distribution, identify the categories where their choices diverge from the average, and decide whether those divergences are deliberate priorities or unnoticed drift. The household that knows where its money goes is in a categorically stronger position to direct it. The spending patterns revealed by the ONS are not prescriptive. They are descriptive -- and description is the beginning of financial clarity.
Frequently Asked Questions (FAQ)
How much does the average UK household spend per month in 2026?In July 2026, NimbleFins estimated the average UK household budget at £3,106 per month (£37,267 per year), based on ONS Family Spending data adjusted for inflation through May 2026. This assumes an average household size of 2.3 people. The same analysis estimated £2,870 per month in January 2026, with the July figure reflecting continued inflation adjustment. The figure is based on the ONS Living Costs and Food Survey -- the largest annual household spending survey in the UK, covering approximately 12,000 households. The ONS Family Spending report for the financial year ending March 2025 was released on June 11, 2026. An important caveat: NimbleFins notes that 'this figure averages all households (including those with no rent or mortgage expenses).' The monthly spend for renters and mortgage holders is significantly higher -- potentially £3,500-£4,500 or more depending on location -- while outright owners (approximately 29% of households, per ONS) spend considerably less on housing. Regional variation is also significant: London households typically spend 20-40% more than the national average, primarily driven by housing costs. For personalised budgeting, the ONS family spending workbooks are freely available at ons.gov.uk, and MoneyHelper's budget planner at moneyhelper.org.uk allows households to compare their own spending to national benchmarks.
What does the average UK household spend on food per month?
The average UK household spends approximately 11% of its monthly budget on food and non-alcoholic beverages at home, according to NimbleFins' analysis of ONS data (July 2026). On the average monthly budget of £3,106, this equates to approximately £342 per month on groceries. The ONS Family Spending report (released June 11, 2026) records average weekly food spend at approximately £78-79 per week, or approximately £340/month. This covers food and non-alcoholic beverages purchased for consumption at home -- primarily supermarket shopping. A separate spending category -- restaurants and hotels -- covers eating out, takeaways, and cafes, representing a further approximately 11% of the household budget or another £342/month on average. Together, total food-related spending (at home and eating out) accounts for approximately 22% of the average UK household budget. Context is important: food inflation peaked at 19% in early 2023 -- the highest in modern records. ONS data for June 2026 shows food inflation has fallen to 1.7%, the lowest since August 2024. However, cumulative food price inflation since 2020 means absolute grocery prices remain approximately 25-30% higher than pre-2021 levels. The 11% food budget share reflects a structurally higher proportion than households were spending before the cost of living crisis began.
How does UK spending differ between renters and homeowners?
The difference in spending between renters and homeowners is one of the most significant and widening financial inequalities in the UK, and it is clearly visible in the ONS data. NimbleFins (July 2026): 'Up to 41% [of budget] towards rent or 46% on mortgage interest payments.' These percentages represent the share of the budget consumed by housing for the different tenure types -- and they apply only to households in those categories. Outright homeowners (approximately 29% of households, per ONS) do not carry either of these costs and therefore have a materially lower monthly expenditure for equivalent accommodation. Private renters -- particularly in London and the South East -- face the highest housing cost burden. Shelter research: over a quarter of private renters spend more than a third of their income on rent. In London, where average private rents for a two-bedroom property exceed £2,000/month, the housing cost share for renters routinely exceeds 50% of take-home pay for median earners. Beyond the direct housing cost difference, tenure also affects spending in other categories. Homeowners have additional maintenance and repair costs that renters do not (though these are typically lower than the rental premium). Renters are less likely to spend on garden equipment, home improvement, or major appliances they do not own. The financial gap between renters and owners extends well beyond housing costs to include building equity (owners) versus building the landlord's equity (renters) -- a wealth effect that compounds over time and is captured in the debt and wealth statistics rather than the household spending data.
Which UK spending categories have changed most since the cost of living crisis?
The cost of living crisis of 2021-2024 has left permanent marks on UK household spending patterns that remain visible in the 2026 data. The categories that changed most: food spending rose most dramatically during the crisis and remains permanently elevated in absolute terms, even though the rate of inflation has fallen to 1.7% in June 2026 (ONS). The cumulative food price increase since 2020 is approximately 25-30% -- meaning the typical weekly grocery shop for 2026 costs approximately £25-30 more than the same basket in 2020 at today's price level. Energy and utilities were the most volatile category: from pre-2021 levels around £1,277/year (Ofgem cap equivalent), through the £3,549/year peak cap in Q1 2023, back to the current £1,862/year cap (SalaryWise, July 2026). Despite falling significantly from the peak, energy costs remain 46% above pre-crisis levels. Transport spending rose 9% in the financial year ending 2025 (ONS Family Spending, June 2026), driven by fuel prices, car insurance premium inflation, and rail fare increases. Services inflation at ~4.5% (BritClock, 2026) has made eating out, haircuts, and hospitality materially more expensive. Clothing and footwear is the notable exception -- prices fell 0.5% in June 2026 (ONS), making it the lowest-inflation major category in the household budget. Education is the fastest-rising at 7.6% (Statista, 2026), driven by independent school fee VAT changes and nursery costs.
How can I compare my spending to the UK average?
There are several approaches to benchmarking your personal spending against national data. The most direct: use the category percentages from the ONS Family Spending data and this guide's breakdown to calculate what the UK average suggests spending in each category at your income level. Calculate each percentage of your monthly take-home income and compare to your actual spend. For example: if your monthly take-home is £2,500 and you are spending £1,200 on housing, that is 48% of income -- above the average and approaching housing stress territory. If you are spending £100 on food for two people, that is significantly below the national average of approximately £340/month for a 2.3-person household. Online tools: NimbleFins (nimblefins.co.uk/average-uk-household-budget) provides an interactive breakdown of average spending by category updated with inflation adjustments. MoneyHelper (moneyhelper.org.uk) offers a free budget planner that allows you to enter your own spending and see how it compares to recommended allocations. MoneySavingExpert's Budget Brain provides detailed category breakdowns. ONS data directly: the ONS Family Spending workbooks (released June 11, 2026) are free to download at ons.gov.uk/releases/familyspendingintheukapril2024tomarch2025. These provide spending breakdowns by region, income decile, age group, and household composition -- allowing comparison with the most demographically similar population group rather than the broad average.

0 Comments Comments