

Savings
Idle Savings: How Much Interest Did Your Cash Cost You?

FDIC average savings rate: 0.38%. Top available HYSA: 4.10%. Vanguard survey: 60% of Americans don’t understand how rates impact their savings. The gap between what you earn and what you could earn is wider than most people realise. Every month, a number does not appear on your bank statement. It is absent in the way that forgone earnings are always absent: not as a deduction or a loss, but simply as a number that was available and not collected. If your savings account earns 0.38% — the FDIC national average — and a competitive high-yield savings account for identical, FDIC-insured money was paying 4.10% at the same time, the difference on $10,000 is $372 per year. On $20,000: $744 per year. On $50,000: $1,860 per year. These are not investment returns. They are not capital gains. They are interest on cash that was sitting somewhere anyway — the only question is how much it earned while it sat there. MoneyLion’s May 2026 study found that keeping too much cash in low-interest bank accounts could cost the typical household $6,400 over five years. Entrepreneur.com’s August 2026 analysis of Federal Reserve data found that $10.41 trillion sits in savings deposits and checkable deposits across the United States. At the FDIC average rate of 0.38%, that money earns a fraction of what it could. The Vanguard national survey from March 2025 found that 60% of Americans do not completely understand how interest rates impact their savings. This article explains exactly what the gap costs, why most people stay in accounts they should not, and what the specific steps are to close it.
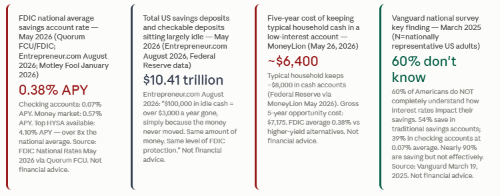
$10.41 trillion in savings deposits and checkable deposits (US, May 2026, Federal Reserve data via Entrepreneur.com August 2026). FDIC national average savings rate: 0.38% APY (Quorum FCU/FDIC May 2026). Top HYSA: 4.10% APY (Quorum FCU May 2026). On $100,000 idle: over $3,000/year cost of inaction (Entrepreneur.com August 2026).
FDIC national rates May 2026: checking 0.07%, savings 0.38%, MMA 0.57% (Quorum FCU/FDIC May 2026). Top HYSA: 4.10% (Quorum FCU). Vanguard March 2025 survey: 54% save in traditional savings accounts; 39% in checking accounts; 60% do not understand how rates impact savings. Motley Fool January 2026: $10,000 at 0.39% = $39/year vs $10,000 at 4.00% = $400/year.
MoneyLion May 26, 2026: keeping too much cash in bank accounts could cost households $6,400 over five years. Typical household cash holding: ~$8,000 (Federal Reserve data, MoneyLion May 2026). Gross opportunity cost over 5 years: $7,175 (MoneyLion calculation). FDIC average savings: 0.38% (FDIC 2026). September 2026 inflation: 3.70% (BLS, October 14, 2026).
University of Michigan Consumer Sentiment Index: record low 49.8 in April 2026 (Entrepreneur.com August 2026). Decision paralysis: even simple moves like opening a new account are affected by low sentiment. Vanguard March 2025: 60% of Americans don't understand how rates impact savings. Average credit card balance carrier generating ~$1,655/year in interest charges (Entrepreneur.com).
Three categories of idle cash: operating cash (checking), emergency fund (HYSA), defined-date money (CDs/term accounts), long-term money (capital markets). Quorum FCU May 2026: best HYSA more than 8x national average; some checking accounts now pay interest; 5-year+ money belongs in capital markets. VMFXX: 3.59% yield February 2026 (Yahoo Finance/AOL). Top HYSA: 4.10% APY (Quorum FCU May 2026).
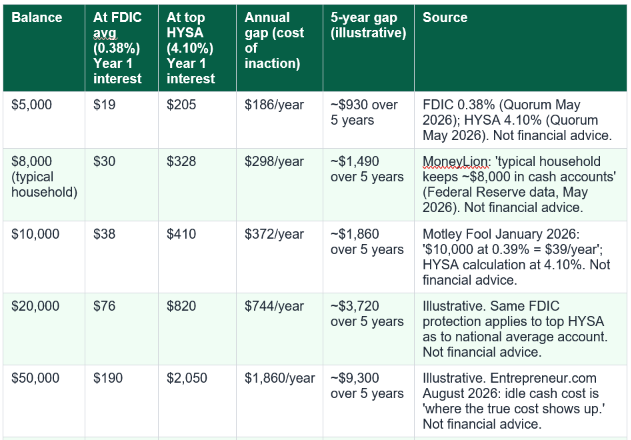
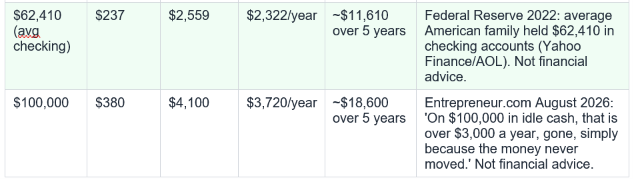
Note: These are simplified illustrative calculations using constant rates. Actual savings rates change over time. Top HYSA rates were up to 4.10% APY (Quorum FCU / FDIC May 2026).

The FDIC publishes monthly National Rate and Rate Caps data. As cited across multiple 2025-2026 sources: the national average savings account rate is approximately 0.38%-0.41% APY. The national average checking account rate is approximately 0.07% APY. The national average money market account rate is approximately 0.57% APY. These are the published averages across the US banking system as of the dates cited (Quorum FCU/FDIC May 2026; Vanguard/FDIC January 2025; AOL/Yahoo Finance/FDIC February 2026). Competitive HYSA rates available to the same customers in the same regulatory environment: up to 4.10% APY (Quorum FCU May 2026). Always verify current rates at fdic.gov or directly with institutions before making decisions.
How much am I actually losing by staying in my current savings account?
The calculation is simple. Take your current balance. Multiply by your current APY to get your annual interest. Then multiply the same balance by the best available HYSA rate (4.00%-4.10% as of May 2026). The difference is the annual opportunity cost. MoneyLion's May 2026 study found the typical household's five-year cost is approximately $6,400. Entrepreneur.com's August 2026 analysis calculated that on $100,000, the difference between 0.38% and 4.10%+ is over $3,000 per year — for the same money, the same FDIC protection, and the same regulatory environment. The gap on $10,000 is approximately $372/year. On $50,000: approximately $1,860/year. From one account switch.
Is a high-yield savings account safe? Is it FDIC-insured?
Yes — competitive high-yield savings accounts from online banks and credit unions carry the same FDIC or NCUA insurance as traditional bank savings accounts, covering up to $250,000 per depositor, per institution, per ownership category. The Motley Fool Money analysis from January 2026 is explicit on this point: 'The truth is, most online banks have the same FDIC insurance and security standards as the big guys — without the monthly fees, balance requirements, or clunky apps.' The higher interest rate is not compensation for additional risk. It reflects that online banks have lower operating costs than branch-based banks and choose to pass more of the margin to depositors. Same insurance. Different rate. Not financial advice — always verify FDIC coverage for any specific account at fdic.gov.
How long does it take to open a high-yield savings account?
The Motley Fool Money January 2026 analysis states specifically: 'Opening a new account can be a 10-minute task and help you earn hundreds — or thousands — of dollars more in interest a year.' The standard process: choose a competitive HYSA (compare rates at sites like bankrate.com, nerdwallet.com); complete the online application (name, address, SSN or equivalent, funding source); link your existing bank account; transfer funds. Most online banks process the transfer within 1-3 business days. Some offer same-day or next-day access. The Motley Fool identifies the most common objection ('all my accounts are linked together') as solvable: you link the new HYSA to your existing bank, and transfers between them become routine.
Should I move my entire savings to a HYSA?
The Quorum FCU May 2026 framework provides the most useful structure: not all cash should be in one place. Operating cash (daily spending money) stays in a checking account for instant access. Emergency fund (3-6 months of expenses) belongs in a competitive HYSA — accessible but earning real interest. Defined-date money (savings with a specific future use date) can be placed in a CD or term account that locks in a rate. Long-term money (not needed for 5+ years) belongs in capital markets, not a savings account of any kind. The answer is therefore: no, not everything in one HYSA — but yes, your emergency fund almost certainly should be in a competitive HYSA rather than a 0.38% traditional account, and your defined-date savings should be in a rate-matched CD or term deposit. Not financial advice — consult a qualified financial adviser for personalised guidance.
Table of Contents
- The Silent Tax on Your Cash: $10.41 Trillion Doing Almost Nothing
- What the FDIC Numbers Actually Show
- The $6,400 Five-Year Question: What Has Your Account Cost You?
- Why People Stay in Terrible Accounts Even When Better Ones Exist
- The Switch: What to Do With Idle Cash in 2026
- The Opportunity Cost Table: Every Balance at Every Rate
- The Four Categories of Cash: A Framework for Every Pound or Dollar
- UK Readers: The Same Problem, Different Numbers
- Conclusion: The Most Expensive Thing You Own Is Your Inertia
- Frequently Asked Questions
The Silent Tax on Your Cash: $10.41 Trillion Doing Almost Nothing
There is a number sitting in financial data that captures the scale of the idle cash problem more precisely than any individual anecdote. Entrepreneur.com’s August 2026 analysis of Federal Reserve data found that savings deposits and other checkable deposits in the United States totalled approximately $10.41 trillion as of May 2026. That is roughly ten and a half trillion dollars sitting in bank accounts. And the national average interest rate on a savings account, as reported by the FDIC and cited by Quorum FCU’s May 2026 analysis, is 0.38% APY. At that rate, $10.41 trillion earns approximately $39.56 billion in interest per year. Top competitive high-yield savings accounts were paying 4.10% APY as of May 2026 (Quorum FCU). At that rate, the same $10.41 trillion would generate approximately $426.81 billion in interest per year. The difference — approximately $387 billion in unrealised interest annually — is what the idle cash problem costs American savers as a collective. That is not a rounding error. It is the systematic, avoidable transfer of hundreds of billions of dollars per year from savers to banks, driven by inertia and the gap between what most people earn and what is available. Entrepreneur.com frames it precisely: ‘On $100,000 in idle cash, that is over $3,000 a year, gone, simply because the money never moved. Same amount of money. Same level of FDIC protection.$10.41 trillion in savings deposits and checkable deposits (US, May 2026, Federal Reserve data via Entrepreneur.com August 2026). FDIC national average savings rate: 0.38% APY (Quorum FCU/FDIC May 2026). Top HYSA: 4.10% APY (Quorum FCU May 2026). On $100,000 idle: over $3,000/year cost of inaction (Entrepreneur.com August 2026).
What the FDIC Numbers Actually Show
The Federal Deposit Insurance Corporation publishes national average deposit rates monthly. These are not opinion or estimate — they are the published rates across the US banking system. Quorum Federal Credit Union’s May 2026 analysis of the FDIC data provides a clear snapshot of what the average American earns compared to what is available. The national average checking account rate: 0.07% APY. The national average savings account rate: 0.38% APY. The national average money market account rate: 0.57% APY. The top high-yield savings accounts available to the same customers in the same regulatory environment: up to 4.10% APY. The gap between the average and the best: more than eight times the FDIC national average, according to Quorum FCU. Vanguard’s March 2025 national consumer survey found that more than half of respondents (54%) save in traditional bank savings accounts, and 39% in checking accounts — where the average rate is 0.07%. The survey also found that 60% of Americans do not completely understand how interest rates impact their savings. As Vanguard’s Andrew Kadjeski stated: ‘By leveraging accounts with competitive yields and establishing intentional savings strategies, Americans can make their money work harder.’ The Motley Fool Money analysis from January 2026 puts the individual calculation plainly: if you have $10,000 in a traditional bank earning 0.39% APY, you earn $39 per year in interest. In a top HYSA at 4.00%, the same $10,000 earns approximately $400. That is a $361 difference on one balance. At $50,000: an $1,800 difference. At $100,000: a $3,600 difference. From one account switch.FDIC national rates May 2026: checking 0.07%, savings 0.38%, MMA 0.57% (Quorum FCU/FDIC May 2026). Top HYSA: 4.10% (Quorum FCU). Vanguard March 2025 survey: 54% save in traditional savings accounts; 39% in checking accounts; 60% do not understand how rates impact savings. Motley Fool January 2026: $10,000 at 0.39% = $39/year vs $10,000 at 4.00% = $400/year.
The $6,400 Five-Year Question: What Has Your Account Cost You?
MoneyLion’s May 26, 2026 analysis quantified the five-year cost of keeping money in a low-interest account with a concrete headline figure: keeping too much cash in bank accounts could cost households about $6,400 over five years. Using the Federal Reserve’s typical household cash holding of approximately $8,000, and comparing the real return of a 1% low-yield account against higher-yield alternatives, MoneyLion’s calculation produced a gross opportunity cost of $7,175 over five years for a typical household. The analysis is straightforward: low interest rates and rising prices steadily reduce the value of cash sitting in checking and traditional savings accounts. The FDIC-reported average savings rate is 0.38% — nowhere near enough to keep pace with the 3.70% September 2026 inflation rate. MoneyLion notes: ‘Checking accounts are meant for spending, not saving, so that money earns little while prices keep rising. That money loses ground each month it stays put.’ The Yahoo Finance idle savings analysis from early 2026 makes the point with the same calculation framework: ‘Traditional savings accounts preserve your balance but rarely outpace inflation, eroding your money’s value. With the national average savings rate sitting at just 0.39% APY in early 2026, you may be seeing your balance erode in purchasing power month after month.’ The five-year cost for different balance sizes is material: $8,000 at the FDIC average (0.38%) vs 4.10% top HYSA: difference is approximately $1,490 over five years. $20,000: approximately $3,720 difference. $50,000: approximately $9,300 difference. $100,000: approximately $18,600 difference. Not financial advice. Calculations are illustrative using simple growth comparison; actual outcomes depend on rate changes.MoneyLion May 26, 2026: keeping too much cash in bank accounts could cost households $6,400 over five years. Typical household cash holding: ~$8,000 (Federal Reserve data, MoneyLion May 2026). Gross opportunity cost over 5 years: $7,175 (MoneyLion calculation). FDIC average savings: 0.38% (FDIC 2026). September 2026 inflation: 3.70% (BLS, October 14, 2026).
Why People Stay in Terrible Accounts Even When Better Ones Exist
The existence of the idle cash problem raises an obvious question: if the information is available, if the alternative accounts are straightforward to open, and if the difference in interest is substantial, why do most people not switch? Entrepreneur.com’s August 2026 analysis offers a specific behavioural insight: the University of Michigan Consumer Sentiment Index hit a record low of 49.8 in April 2026, and ‘periods of low sentiment tend to produce decision paralysis around financial moves that require active steps — even simple ones like opening a new account or moving funds.’ The Motley Fool Money analysis from January 2026 catalogues the specific objections people give for staying in low-rate accounts: ‘All my accounts are linked together’ (convenience inertia); ‘I’ve always banked here’ (relationship inertia); concern about ‘quick access to cash’ when top HYSAs typically offer same-day or next-day transfers. The paradox identified by Vanguard’s 2025 survey cuts to the core: 60% of Americans do not completely understand how interest rates impact their savings, yet nearly 90% are actively saving. They are doing the behaviour — saving money — without the understanding that would direct it to the most productive vehicle. This is not a financial literacy gap about complex concepts like derivatives or portfolio theory. It is a gap in basic knowledge about where to keep money that is already being saved. Entrepreneur.com captures the net result: ‘The behavioral side of idle cash’ means that even as the gap between average and best rates is widely publicised, the average rate paid to American savers remains near zero.University of Michigan Consumer Sentiment Index: record low 49.8 in April 2026 (Entrepreneur.com August 2026). Decision paralysis: even simple moves like opening a new account are affected by low sentiment. Vanguard March 2025: 60% of Americans don't understand how rates impact savings. Average credit card balance carrier generating ~$1,655/year in interest charges (Entrepreneur.com).
The Switch: What to Do With Idle Cash in 2026
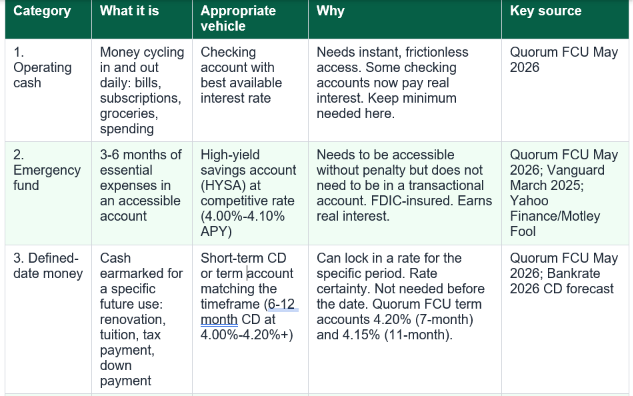
The structure of an idle cash solution depends on what the money is actually for. Quorum FCU’s May 2026 analysis of the idle cash problem identifies three distinct categories of cash that most households hold, each of which has a different appropriate vehicle. Operating cash — the money cycling in and out for regular spending, bills, subscriptions, and everyday purchases — belongs in a checking account with the lowest friction. Even here, Quorum FCU notes: ‘Some checking accounts now pay real interest on balances, so this layer doesn’t have to earn nothing.’ Emergency fund — three to six months of expenses in an accessible account — is the primary candidate for a high-yield savings account. At 4.10% APY versus 0.38% national average, the emergency fund earns genuine inflation-relevant interest rather than token interest. Yahoo Finance’s idle savings analysis confirms: ‘The best high-yield savings accounts pay 12 times the national average.’ Defined-date money — cash earmarked for a specific future purpose such as a tax payment, renovation, tuition, or real estate transaction — can be placed in a term account or CD that locks in a rate. Quorum FCU’s May 2026 analysis identifies this category explicitly and notes their own competitive term account rates as examples of the available range. Vanguard’s Federal Money Market Fund (VMFXX) offered 3.59% yield as of February 2026 for cash that needs market-adjacent liquidity. Long-term money — defined as cash genuinely not needed for five or more years — belongs in capital markets rather than savings accounts. Quorum FCU: ‘Money you genuinely won’t need for five-plus years belongs in capital markets, not a savings account.’ Not financial advice. Always verify current rates and consult a qualified adviser.Three categories of idle cash: operating cash (checking), emergency fund (HYSA), defined-date money (CDs/term accounts), long-term money (capital markets). Quorum FCU May 2026: best HYSA more than 8x national average; some checking accounts now pay interest; 5-year+ money belongs in capital markets. VMFXX: 3.59% yield February 2026 (Yahoo Finance/AOL). Top HYSA: 4.10% APY (Quorum FCU May 2026).
The Opportunity Cost Table: Every Balance at Every Rate
The following table shows the annual interest earned and the five-year interest at different balance sizes and different savings rates. The ‘cost of inaction’ column shows the difference between what you earn at the FDIC national average (0.38%) and what you could earn at a top competitive HYSA (4.10%). Not financial advice. Rates change — verify before opening any account. All figures are illustrative using simple annual interest calculation. Actual outcomes depend on rate changes, compounding frequency, and fees.Note: These are simplified illustrative calculations using constant rates. Actual savings rates change over time. Top HYSA rates were up to 4.10% APY (Quorum FCU / FDIC May 2026).
The Four Categories of Cash: A Framework for Every Pound or Dollar
Not all idle cash should be treated the same way. Quorum FCU’s May 2026 framework, drawn from its analysis of how households actually hold cash, identifies four distinct categories. The appropriate vehicle for each is different. Not financial advice.
UK Readers: The Same Problem, Different Numbers
The idle cash problem is not specific to the United States. UK savers face an identical structural gap between the average rate paid by high-street banks and the rate available from competitive online providers. Standard easy-access savings accounts at major UK high-street banks typically pay 0.5% to 1.5% APY. Competitive cash ISA and easy-access savings accounts from online providers were paying 4.5% to 5.0%+ in 2026. The UK ISA allowance of £20,000 per year provides a tax-free wrapper that makes the comparison even more favourable for competitive accounts: interest within the ISA is completely tax-free, while interest in a standard savings account counts against the Personal Savings Allowance (£500 for higher-rate taxpayers, £1,000 for basic-rate taxpayers). Above those thresholds, savings interest is taxable income. For a UK basic-rate taxpayer with £20,000 in a standard 1% savings account earning £200 per year, moving to a competitive 4.5% cash ISA would earn £900 per year — entirely tax-free. The difference: £700 per year on one balance switch, with a better tax outcome. The same Quorum FCU framework applies: distinguish operating cash (current account), emergency fund (best available easy-access ISA or savings), defined-date money (fixed-rate ISA or bond), and long-term money (Stocks and Shares ISA or pension).Conclusion
Entrepreneur.com’s August 2026 analysis coined what may be the most accurate single phrase for the idle cash problem: ‘Idle is the most expensive word in investing.’ The Federal Reserve data shows $10.41 trillion sitting in accounts earning the FDIC national average of 0.38%. The FDIC data shows checking accounts earning 0.07%. Vanguard’s national survey found that 60% of Americans do not understand how interest rates impact their savings. MoneyLion’s May 2026 study found the five-year cost to the typical household is approximately $6,400. And the solution, as the Motley Fool Money analysis of January 2026 specifies, takes approximately ten minutes: open a high-yield savings account, link your existing bank, and transfer the funds. Same FDIC insurance. Same regulatory protection. Same deposit. Different rate. The specific cost of your particular inertia depends on your balance and how long it has been sitting at the FDIC national average rather than a competitive rate. The table in Section 6 gives you the numbers for your balance. The framework in Section 7 tells you which type of cash should move where. The remaining obstacle is the University of Michigan Consumer Sentiment problem identified by Entrepreneur.com — decision paralysis in a low-sentiment environment. The answer to decision paralysis, in this case, is a ten-minute task. Not financial, investment, or tax advice. Always verify current rates before opening any account.Frequently Asked Questions
What is the national average savings account rate right now?The FDIC publishes monthly National Rate and Rate Caps data. As cited across multiple 2025-2026 sources: the national average savings account rate is approximately 0.38%-0.41% APY. The national average checking account rate is approximately 0.07% APY. The national average money market account rate is approximately 0.57% APY. These are the published averages across the US banking system as of the dates cited (Quorum FCU/FDIC May 2026; Vanguard/FDIC January 2025; AOL/Yahoo Finance/FDIC February 2026). Competitive HYSA rates available to the same customers in the same regulatory environment: up to 4.10% APY (Quorum FCU May 2026). Always verify current rates at fdic.gov or directly with institutions before making decisions.
How much am I actually losing by staying in my current savings account?
The calculation is simple. Take your current balance. Multiply by your current APY to get your annual interest. Then multiply the same balance by the best available HYSA rate (4.00%-4.10% as of May 2026). The difference is the annual opportunity cost. MoneyLion's May 2026 study found the typical household's five-year cost is approximately $6,400. Entrepreneur.com's August 2026 analysis calculated that on $100,000, the difference between 0.38% and 4.10%+ is over $3,000 per year — for the same money, the same FDIC protection, and the same regulatory environment. The gap on $10,000 is approximately $372/year. On $50,000: approximately $1,860/year. From one account switch.
Is a high-yield savings account safe? Is it FDIC-insured?
Yes — competitive high-yield savings accounts from online banks and credit unions carry the same FDIC or NCUA insurance as traditional bank savings accounts, covering up to $250,000 per depositor, per institution, per ownership category. The Motley Fool Money analysis from January 2026 is explicit on this point: 'The truth is, most online banks have the same FDIC insurance and security standards as the big guys — without the monthly fees, balance requirements, or clunky apps.' The higher interest rate is not compensation for additional risk. It reflects that online banks have lower operating costs than branch-based banks and choose to pass more of the margin to depositors. Same insurance. Different rate. Not financial advice — always verify FDIC coverage for any specific account at fdic.gov.
How long does it take to open a high-yield savings account?
The Motley Fool Money January 2026 analysis states specifically: 'Opening a new account can be a 10-minute task and help you earn hundreds — or thousands — of dollars more in interest a year.' The standard process: choose a competitive HYSA (compare rates at sites like bankrate.com, nerdwallet.com); complete the online application (name, address, SSN or equivalent, funding source); link your existing bank account; transfer funds. Most online banks process the transfer within 1-3 business days. Some offer same-day or next-day access. The Motley Fool identifies the most common objection ('all my accounts are linked together') as solvable: you link the new HYSA to your existing bank, and transfers between them become routine.
Should I move my entire savings to a HYSA?
The Quorum FCU May 2026 framework provides the most useful structure: not all cash should be in one place. Operating cash (daily spending money) stays in a checking account for instant access. Emergency fund (3-6 months of expenses) belongs in a competitive HYSA — accessible but earning real interest. Defined-date money (savings with a specific future use date) can be placed in a CD or term account that locks in a rate. Long-term money (not needed for 5+ years) belongs in capital markets, not a savings account of any kind. The answer is therefore: no, not everything in one HYSA — but yes, your emergency fund almost certainly should be in a competitive HYSA rather than a 0.38% traditional account, and your defined-date savings should be in a rate-matched CD or term deposit. Not financial advice — consult a qualified financial adviser for personalised guidance.
0 Comments
Be the first to share your thoughts on this article.