
Finance
K-Shaped Economy: How Income Inequality Drives Awareness
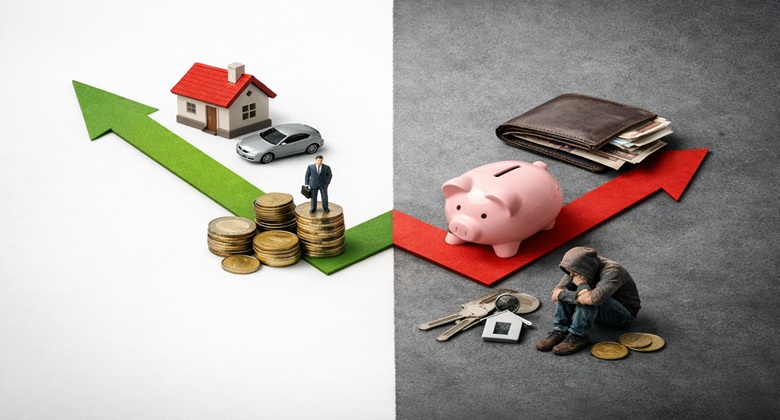
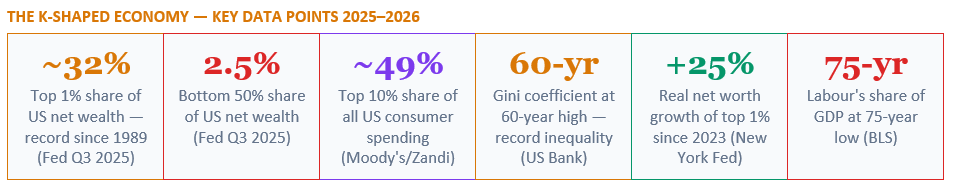
The top 1% of US households held a record share of nearly 32% of all net wealth in the third quarter of 2025 — the highest concentration since the Federal Reserve began tracking household wealth in 1989. By comparison, the bottom 50% of Americans collectively held just 2.5% of the nation's net wealth. The top 10% of income earners now account for nearly half of all consumer spending. The Gini coefficient has reached a 60-year high. This is the K-shaped economy: an economy in which different groups travel in fundamentally different economic directions simultaneously, with the upper arm rising for the wealthy and the lower arm declining for those left behind. This guide explains what a K-shaped economy is, where it came from, how it is deepening in 2026, and — critically — how the financial awareness gap between the two arms is both a product of inequality and, for those who understand it, a lever for improving their position.
A K-shaped economy is one in which an economic recovery or growth period produces sharply divergent outcomes for different groups — some rising, some falling — rather than lifting all boats equally. The upper arm of the K represents higher-income households, professional workers, asset-owning individuals, and technology-linked sectors: they experience robust growth in income, wealth, and spending capacity. The lower arm represents lower-income households, wage-dependent workers, and service-sector employees: they experience stagnation or decline. The vertical bar of the K represents the moment of divergence, often a crisis or inflection point at which the two trajectories separate.
US Bank's March 2026 K-Shaped Economy analysis explains the term: 'A K-shaped economy describes an economic recovery where different groups or industries experience vastly different outcomes — some thrive and grow, while others struggle or decline. It fits the saying: the rich get richer and the poor get poorer.' The concept gained widespread usage during the COVID-19 pandemic, when the divergence between remote-work-eligible, asset-owning households and lower-income, service-sector workers became starkly visible. But as Moody's Analytics chief economist Mark Zandi told CNBC in January 2026, this is no longer a pandemic-era phenomenon. It is structural.
The historical roots of K-shaped inequality predate the pandemic. CNBC's January 2026 analysis cites the decline of unionisation rates in the late 1900s as a key structural driver: it reduced workers' collective bargaining power, allowing productivity gains to flow disproportionately to capital owners rather than to labour. The Federal Reserve's 11 interest rate hikes between 2022 and 2024 — intended to combat inflation — reinforced the K-shape by benefiting asset-rich households able to absorb the slowdown while squeezing lower-income households facing higher mortgage rates and consumer borrowing costs.
This is not a cyclical or temporary phenomenon. The gap between the best and worst-off Americans is growing — and economists don't see an end in sight.
— MARK ZANDI, CHIEF ECONOMIST, MOODY'S ANALYTICS — CNBC, JANUARY 30, 2026
The Gini coefficient — the standard statistical measure of income inequality — has reached a 60-year high according to US Bank's January 2026 analysis, rising from 36.5 in 1970 to 42 in 2025. The post-tax income ratio between the richest and poorest Americans climbed to 9.9 in 2024, up from 8.6 in 2009 — a 14% increase in the inequality ratio in 15 years. Meanwhile, the portion of US GDP going to workers in the form of compensation fell to its lowest level in more than 75 years of Bureau of Labor Statistics tracking. The economy has grown, but the growth is not reaching workers.
↑ Home equity appreciates as homeowners — disproportionately higher-income — accumulate equity while renters accumulate nothing and face rising rents that consume an ever-larger share of income.
↑ Wage growth for high earners exceeds inflation. Bank of America Institute December 2025 data: higher-income households saw 3% wage growth; lower-income households 1.1% — below the headline inflation rate.
↑ Luxury spending accelerates. Fortune (January 2026): Delta Airlines performs strongly by catering to the wealthy. Luxury fashion spending was up 8% year-over-year in October 2025. Airlines and hotels report booming premium bookings. 'Price-insensitive wealthy consumers' define the premium segment.
↑ Credit is cheap and productive: higher credit scores, lower debt-to-income ratios, and asset collateral mean top-arm households borrow at the lowest rates for mortgages, business investment, and education.
↓ Housing affordability collapses. Capital Analytics (February 2026): 'Housing affordability remained a critical pain point, with many Americans unable to access homeownership' — locking them out of the primary wealth-building mechanism of the American middle class for another generation.
↓ Debt is expensive and consumption-driven. Credit card debt at 20%+ APR transfers wealth upward to lenders — the precise inverse of asset appreciation. For lower-arm households, high-cost consumer debt is often the only available financial instrument.
↓ Pandemic-era relief has been exhausted. New York Fed research: 'The divergence opened in 2023 after pandemic-era relief programs for lower- and middle-income households ran out.' Real spending by lower-income households turned negative in 2025 even as aggregate demand grew, sustained entirely by affluent household spending.
↓ Food: trading down to survive. Bank of America data shows lower-income households' spending growth at value grocers outpaced that at premium grocery stores — a direct manifestation of K-shaped purchasing power compression in the most basic category of expenditure.
The upper arm of the K generates financial awareness organically. Asset ownership requires engagement with investment decisions, tax strategy, estate planning, and portfolio management. Professional networks in higher-income brackets routinely share financial knowledge — about Roth IRA conversions, tax-loss harvesting, refinancing timing, and equity compensation structures. Financial advisers, estate lawyers, and tax professionals are routine parts of life for affluent households. Children in higher-income households absorb financial concepts through everyday family conversation. The knowledge compounds alongside the capital.
The lower arm of the K experiences the opposite dynamic. Financial education is reactive rather than proactive — it occurs in response to crisis (debt collectors, overdraft fees, payday lenders, repossession notices) rather than in the context of opportunity. The financial products accessible to lower-income households — high-fee checking accounts, payday loans at 300%+ APR, rent-to-own arrangements, buy-now-pay-later instruments — are structurally designed to extract wealth rather than build it. US Bank's chief economist Beth Ann Bovino states the structural reality clearly: 'As financial conditions for American households are further apart, I see no reason to believe that the gap has narrowed.'
This is why the economy can look strong in the data while millions of people feel like they're falling behind.
— PETER MALLOUK, BILLIONAIRE WEALTH MANAGER — FORTUNE, MARCH 2026
Moody's analysis (cited in the Minneapolis Federal Reserve's March 2026 K-shaped economy data review) found that the top 10% of households account for approximately 49% of consumer spending — up from around 36% in the 1990s. The Dallas Fed analysis found the top 20% account for 57% of consumption in post-Covid years. RBC Economics (April 2026) identifies the systemic risk this creates: 'This concentration of spending power means aggregate demand is far more fragile than headline figures may suggest.' When the affluent segment reduces spending — through market correction, AI investment slowdown, or policy change — the economy loses its primary engine, because lower-income household spending is structurally insufficient to sustain aggregate demand.
Bank of America Institute data cited throughout early 2026 found that growth in credit and debit card spending among lower- and higher-income households split into a K shape around spring 2025 — higher-income households experiencing near 3% spending growth year-over-year in late 2025, lower-income households less than 1%. This divergence in spending capacity is not primarily about different preferences. It is about different financial positions, different access to credit, and different relationships with asset appreciation.
AI creates K-shaped inequality through three channels. First, capital concentration: AI infrastructure requires massive investment, and returns accrue to shareholders — overwhelmingly high-income households. Second, labour displacement: AI automates middle-skill routine tasks (data entry, basic analysis, customer service, document review) that provide the economic backbone of middle-income employment, while creating high-paying technical roles accessible only to those with advanced technical education. Third, productivity capture: AI-enabled productivity gains flow disproportionately to firms and shareholders rather than workers, particularly in industries with weak collective bargaining. US Bank (March 2026) explicitly lists rapid AI adoption alongside inflation and high interest rates as the three factors most likely to deepen K-shaped disparities going forward.
The implication for financial awareness is direct: in an AI-driven K-shaped economy, AI and technology skills are becoming one of the most accessible paths for lower and middle-arm households to move toward the upper-arm dynamic. FiTHMedia's April 2026 financial resilience analysis makes this point explicitly: investing in data literacy, AI tools, and technology certifications 'beats any ETF in risk-adjusted return' for those seeking to improve their position within a structurally unequal economy. Financial awareness that includes understanding the labour market implications of AI — and proactively acquiring technology skills — is a direct counter to K-shaped displacement.
'New analysis from Bank of America suggests the trajectory of middle-class consumers is now pulling away from those on the lower end of the income spectrum: these consumers aren't doing as well as wealthy people, but their spending power isn't as diminished as that of poorer consumers.' Bank of America's data shows the share of households paying off their full credit card balance each month has risen across all incomes and generations since 2019 — including lower-income young people, whose financial discipline score rose nearly 20 points from a 2019 baseline of 100. This suggests that improved financial behaviour is occurring even within the lower arm — and that the K-shaped narrative, while structurally accurate, does not imply absolute immobility for all households on the downward slope. Financial awareness, applied consistently, can shift position within the distribution even when structural forces are working against you.
But the K-shaped economy is also not destiny for every individual within it. Financial awareness — genuine, applied knowledge of how assets compound, how high-interest debt destroys wealth, how tax-advantaged accounts work, and how AI and technology skills affect earning power — is the most accessible lever available to households seeking to improve their position within a structurally unequal economy. The upper arm of the K is increasingly defined by financial literacy, asset ownership, and technology adaptability as well as by birthright and initial wealth. These are acquirable. The Bank of America data behind the E-shaped economy update shows that financial behaviour can improve even within the lower arm — that awareness, applied consistently, can shift position within the distribution. Start with the first investment. Build the emergency fund. Eliminate the highest-cost debt. Develop one AI-relevant skill. The K-shaped economy is a structural force. Financial awareness is a personal one. Between them, there is agency.
CBS News — US Wealth Gap Widest in Three Decades, Federal Reserve Data (January 2026) https://www.cbsnews.com/news/us-wealth-gap-widest-in-three-decades-federal-reserve/
US Bank — The K-Shaped Economy in 2026: Analysis (March 2026) https://www.usbank.com/corporate-and-commercial-banking/insights/economy/macro/k-shaped-economy.html
Fortune — K-Shaped Economy: What It Is and Why It Matters (Updated March 2026) https://fortune.com/article/what-is-k-shaped-economy-wealth-inequality-explained/
Fortune — Welcome to the E-Shaped Economy: Middle Class Also Struggling (February 12, 2026) https://fortune.com/2026/02/12/e-shaped-economy-middle-lower-upper-class-k-shaped-economy-bank-america-data/
Fortune — Billionaires Warn About US Wealth Inequality Economic Risks (March 2026) https://fortune.com/2026/03/17/billionaires-warn-about-us-wealth-inequality-economic-risks/
Axios — New Research Confirms US Economy's K-Shaped Dynamics (May 2026) https://www.axios.com/2026/05/01/us-economy-spending-growth-income
New York Federal Reserve Liberty Street Economics — Explaining the K-Shaped Economy (May 2026) https://libertystreeteconomics.newyorkfed.org/2026/05/explaining-the-k-shaped-economy-whats-behind-the-divide/
Minneapolis Federal Reserve — Have US Consumers Gone K-Shaped? A Review of the Data (March 2026) https://www.minneapolisfed.org/article/2026/have-us-consumers-gone-k-shaped-a-review-of-the-data
Capital Analytics Associates — AI Boom Underpinning a K-Shaped Economy? (February 2026) https://capitalanalyticsassociates.com/ai-boom-underpinning-a-k-shaped-economy/
Empower — The K-Shaped Economy: What Consumers Should Know (February 2026) https://www.empower.com/the-currency/money/life/k-shaped-economy-what-to-know-news
TABLE OF CONTENTS
- What Is a K-Shaped Economy? Definition and Origins
- The Data Behind the Divide: Where the K Stands in 2026
- Why the K Is Deepening: Assets, AI, and Inflation
- The Two Arms in Detail: Life at the Top and Bottom of the K
- How Income Inequality Drives Financial Awareness
- The Spending Divergence: How Two Economies Operate Side by Side
- AI and Technology: The New Accelerants of K-Shaped Inequality
- What the K-Shaped Economy Means for Your Personal Finances
- Navigating the K: Practical Financial Awareness Actions
- The E-Shaped Update: Is the Middle Class a Third Strand?
- Conclusion
- Frequently Asked Questions
- References
What Is a K-Shaped Economy? Definition and Origins
A K-shaped economy is one in which an economic recovery or growth period produces sharply divergent outcomes for different groups — some rising, some falling — rather than lifting all boats equally. The upper arm of the K represents higher-income households, professional workers, asset-owning individuals, and technology-linked sectors: they experience robust growth in income, wealth, and spending capacity. The lower arm represents lower-income households, wage-dependent workers, and service-sector employees: they experience stagnation or decline. The vertical bar of the K represents the moment of divergence, often a crisis or inflection point at which the two trajectories separate.US Bank's March 2026 K-Shaped Economy analysis explains the term: 'A K-shaped economy describes an economic recovery where different groups or industries experience vastly different outcomes — some thrive and grow, while others struggle or decline. It fits the saying: the rich get richer and the poor get poorer.' The concept gained widespread usage during the COVID-19 pandemic, when the divergence between remote-work-eligible, asset-owning households and lower-income, service-sector workers became starkly visible. But as Moody's Analytics chief economist Mark Zandi told CNBC in January 2026, this is no longer a pandemic-era phenomenon. It is structural.
The historical roots of K-shaped inequality predate the pandemic. CNBC's January 2026 analysis cites the decline of unionisation rates in the late 1900s as a key structural driver: it reduced workers' collective bargaining power, allowing productivity gains to flow disproportionately to capital owners rather than to labour. The Federal Reserve's 11 interest rate hikes between 2022 and 2024 — intended to combat inflation — reinforced the K-shape by benefiting asset-rich households able to absorb the slowdown while squeezing lower-income households facing higher mortgage rates and consumer borrowing costs.
This is not a cyclical or temporary phenomenon. The gap between the best and worst-off Americans is growing — and economists don't see an end in sight.
— MARK ZANDI, CHIEF ECONOMIST, MOODY'S ANALYTICS — CNBC, JANUARY 30, 2026
The Data Behind the Divide: Where the K Stands in 2026
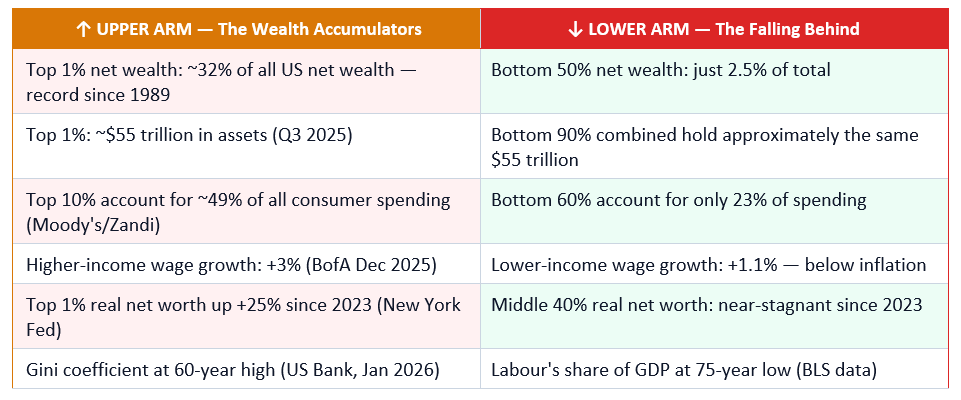
The wealth data in 2026 is unambiguous in its direction. The Federal Reserve's third-quarter 2025 data, reported by CNBC (January 30, 2026) and CBS News (January 2026), shows that the top 1% held approximately 32% of all net wealth — the highest share since the Fed began tracking in 1989. The wealthiest 1% held roughly $55 trillion in assets — approximately equal to the combined wealth of the bottom 90% of Americans combined. The bottom 50%, by contrast, held just 2.5% of net wealth.The Gini coefficient — the standard statistical measure of income inequality — has reached a 60-year high according to US Bank's January 2026 analysis, rising from 36.5 in 1970 to 42 in 2025. The post-tax income ratio between the richest and poorest Americans climbed to 9.9 in 2024, up from 8.6 in 2009 — a 14% increase in the inequality ratio in 15 years. Meanwhile, the portion of US GDP going to workers in the form of compensation fell to its lowest level in more than 75 years of Bureau of Labor Statistics tracking. The economy has grown, but the growth is not reaching workers.
Why the K Is Deepening: Assets, AI, and Inflation
The K-shaped economy is driven by three compounding structural forces that systematically benefit asset owners while burdening wage-dependent households.Asset appreciation: the single most powerful driver
The New York Federal Reserve's Liberty Street Economics May 2026 research identifies wealth and inflation — not wage growth — as the most powerful drivers of K-shaped spending divergence. Since 2023, the real net worth of the top 1% has climbed more than 25%, fuelled largely by surging financial assets. The S&P 500 climbed over 130% since March 2020, further compounding the wealth advantage of higher-income Americans who are statistically far more likely to own stocks. A Gallup poll found that 87% of Americans who own stock live in households with incomes of $100,000 or more. This creates an amplifying loop: asset appreciation generates wealth without labour; wealth generates more investment capacity; returns compound; the asset owner's position strengthens independently of wage growth. For households with no financial assets — the majority of the bottom 50% — this entire engine of wealth creation is structurally inaccessible.Inflation hitting the lower arm harder
The New York Fed's Liberty Street Economics analysis found that beginning in late 2022, low-income households consistently faced above-average inflation compared to middle- and high-income households. Lower-income households spend a larger proportion of income on essentials — food, energy, shelter, healthcare, transportation — all of which experienced above-average price increases. Higher-income households, spending more on discretionary items and services, experienced below-average inflation. The result is a double compression for lower-arm households: lower real wage growth AND higher real inflation, squeezing purchasing power from both directions simultaneously.AI and technology: the new inequality accelerant
Capital Analytics Associates' February 2026 analysis states directly: 'Artificial intelligence capital expenditure has widened this divide.' The AI boom drove Wall Street to record valuations in 2025, benefiting shareholders — disproportionately higher-income — while the productivity gains from AI accrue primarily to capital owners and skilled technology workers. US Bank's March 2026 K-shaped economy analysis explicitly lists rapid AI adoption alongside high interest rates and persistent inflation as the three economic factors most likely to deepen K-shaped disparities. Workers and firms exposed to technology capture more gains; lower-wage service workers capture less. The automation of middle-skill routine roles — data entry, basic analysis, customer service, document processing — removes the economic rungs of the ladder that middle-income households historically used to climb.The Two Arms in Detail: Life at the Top and Bottom of the K
The K-shaped economy is most viscerally visible in the daily financial experience of households on either arm. The upper and lower arms do not share the same inflation rate, the same credit cost, the same relationship with risk, or the same financial horizon.Life on the upper arm
↑ Stock market gains compound existing wealth — the S&P 500's 130%+ rise since March 2020 has added tens of trillions in wealth, overwhelmingly concentrated in the top income quartile where equity ownership is concentrated.↑ Home equity appreciates as homeowners — disproportionately higher-income — accumulate equity while renters accumulate nothing and face rising rents that consume an ever-larger share of income.
↑ Wage growth for high earners exceeds inflation. Bank of America Institute December 2025 data: higher-income households saw 3% wage growth; lower-income households 1.1% — below the headline inflation rate.
↑ Luxury spending accelerates. Fortune (January 2026): Delta Airlines performs strongly by catering to the wealthy. Luxury fashion spending was up 8% year-over-year in October 2025. Airlines and hotels report booming premium bookings. 'Price-insensitive wealthy consumers' define the premium segment.
↑ Credit is cheap and productive: higher credit scores, lower debt-to-income ratios, and asset collateral mean top-arm households borrow at the lowest rates for mortgages, business investment, and education.
Life on the lower arm
↓ Real wages stagnate or decline after inflation. Lower-income households face above-average inflation (NY Fed, May 2026) while experiencing the lowest nominal wage growth — a double compression of real purchasing power in every pay period.↓ Housing affordability collapses. Capital Analytics (February 2026): 'Housing affordability remained a critical pain point, with many Americans unable to access homeownership' — locking them out of the primary wealth-building mechanism of the American middle class for another generation.
↓ Debt is expensive and consumption-driven. Credit card debt at 20%+ APR transfers wealth upward to lenders — the precise inverse of asset appreciation. For lower-arm households, high-cost consumer debt is often the only available financial instrument.
↓ Pandemic-era relief has been exhausted. New York Fed research: 'The divergence opened in 2023 after pandemic-era relief programs for lower- and middle-income households ran out.' Real spending by lower-income households turned negative in 2025 even as aggregate demand grew, sustained entirely by affluent household spending.
↓ Food: trading down to survive. Bank of America data shows lower-income households' spending growth at value grocers outpaced that at premium grocery stores — a direct manifestation of K-shaped purchasing power compression in the most basic category of expenditure.
How Income Inequality Drives Financial Awareness — The Knowledge Divide
The connection between the K-shaped economy and financial awareness is structural, not coincidental. Financial awareness is both a product of income and wealth (those with more to manage tend to know more about managing it) and a lever for improving position within the K-shaped structure (those who develop financial awareness earlier create compounding advantages). Understanding this dynamic is the first step toward using financial literacy as a counterweight to structural inequality.The upper arm of the K generates financial awareness organically. Asset ownership requires engagement with investment decisions, tax strategy, estate planning, and portfolio management. Professional networks in higher-income brackets routinely share financial knowledge — about Roth IRA conversions, tax-loss harvesting, refinancing timing, and equity compensation structures. Financial advisers, estate lawyers, and tax professionals are routine parts of life for affluent households. Children in higher-income households absorb financial concepts through everyday family conversation. The knowledge compounds alongside the capital.
The lower arm of the K experiences the opposite dynamic. Financial education is reactive rather than proactive — it occurs in response to crisis (debt collectors, overdraft fees, payday lenders, repossession notices) rather than in the context of opportunity. The financial products accessible to lower-income households — high-fee checking accounts, payday loans at 300%+ APR, rent-to-own arrangements, buy-now-pay-later instruments — are structurally designed to extract wealth rather than build it. US Bank's chief economist Beth Ann Bovino states the structural reality clearly: 'As financial conditions for American households are further apart, I see no reason to believe that the gap has narrowed.'
This is why the economy can look strong in the data while millions of people feel like they're falling behind.
— PETER MALLOUK, BILLIONAIRE WEALTH MANAGER — FORTUNE, MARCH 2026
The Spending Divergence: How Two Economies Operate Side by Side
The K-shaped economy has become visible in the strategy and earnings of major US corporations in ways that make the depth of the divide concrete. CNBC (November 2025) reported that brands across fast food and beverages are explicitly designing for a bifurcated customer base — serving both price-insensitive premium spenders and cost-conscious value seekers, because the gap between these two populations has grown too large to bridge with a single proposition. McDonald's emphasises 'value and affordability' for its lower-income customer base while Delta builds premium luxury products for its increasingly affluent flyers.Moody's analysis (cited in the Minneapolis Federal Reserve's March 2026 K-shaped economy data review) found that the top 10% of households account for approximately 49% of consumer spending — up from around 36% in the 1990s. The Dallas Fed analysis found the top 20% account for 57% of consumption in post-Covid years. RBC Economics (April 2026) identifies the systemic risk this creates: 'This concentration of spending power means aggregate demand is far more fragile than headline figures may suggest.' When the affluent segment reduces spending — through market correction, AI investment slowdown, or policy change — the economy loses its primary engine, because lower-income household spending is structurally insufficient to sustain aggregate demand.
Bank of America Institute data cited throughout early 2026 found that growth in credit and debit card spending among lower- and higher-income households split into a K shape around spring 2025 — higher-income households experiencing near 3% spending growth year-over-year in late 2025, lower-income households less than 1%. This divergence in spending capacity is not primarily about different preferences. It is about different financial positions, different access to credit, and different relationships with asset appreciation.
AI and Technology: The New Accelerants of K-Shaped Inequality
Capital Analytics Associates' February 2026 analysis 'AI Boom Underpinning a K-Shaped Economy' states it directly: 'Artificial intelligence capital expenditure has widened this divide.' The AI boom drove Wall Street to record valuations in 2025, benefiting shareholders — disproportionately upper-income — while productivity gains from AI accrue primarily to capital owners and skilled technology workers rather than general labour. Shepherd Gazette's May 2026 K-shaped economy analysis notes: 'The trend suggests that workers and firms exposed to technology are more likely to capture gains than lower-wage service workers.'AI creates K-shaped inequality through three channels. First, capital concentration: AI infrastructure requires massive investment, and returns accrue to shareholders — overwhelmingly high-income households. Second, labour displacement: AI automates middle-skill routine tasks (data entry, basic analysis, customer service, document review) that provide the economic backbone of middle-income employment, while creating high-paying technical roles accessible only to those with advanced technical education. Third, productivity capture: AI-enabled productivity gains flow disproportionately to firms and shareholders rather than workers, particularly in industries with weak collective bargaining. US Bank (March 2026) explicitly lists rapid AI adoption alongside inflation and high interest rates as the three factors most likely to deepen K-shaped disparities going forward.
The implication for financial awareness is direct: in an AI-driven K-shaped economy, AI and technology skills are becoming one of the most accessible paths for lower and middle-arm households to move toward the upper-arm dynamic. FiTHMedia's April 2026 financial resilience analysis makes this point explicitly: investing in data literacy, AI tools, and technology certifications 'beats any ETF in risk-adjusted return' for those seeking to improve their position within a structurally unequal economy. Financial awareness that includes understanding the labour market implications of AI — and proactively acquiring technology skills — is a direct counter to K-shaped displacement.
What the K-Shaped Economy Means for Your Personal Finances
Understanding the K-shaped economy is not merely economic literacy — it is actionable information that should directly shape personal financial strategy. The structural forces driving K-shaped inequality are self-reinforcing and unlikely to reverse quickly. But knowing which forces are in play allows individuals to position themselves more deliberately relative to those forces.For households on or near the lower arm: the priority is asset access
The single most powerful lever for transitioning from lower-arm to upper-arm dynamics in a K-shaped economy is asset ownership. The amplifying loop of asset appreciation — compound growth, dividend reinvestment, equity participation — is available to anyone who can place even a small amount in an index fund, a Roth IRA, or a workplace retirement account with employer matching. A 401(k) with an employer match is a guaranteed 50–100% return on contributions up to the match threshold. Not participating is the most expensive financial decision available to lower-arm households.FINANCIAL AWARENESS ACTIONS — Lower and Middle-Income Households in a K-Shaped Economy
- Start investing — even small amounts: a 401(k) with employer match provides a guaranteed return equal to the match percentage. The compounding of even small equity holdings over 10–20 years is the mechanism by which lower-arm households capture upper-arm tailwinds.
- Minimise high-cost credit: credit card debt at 20%+ APR is the most reliable mechanism for transferring wealth from the lower arm to the upper arm (lenders and shareholders). Eliminating it is equivalent to earning a guaranteed 20%+ return.
- Build the emergency fund: without a financial buffer, every expense shock triggers high-cost borrowing, deepening the lower-arm cycle. Three months of essential expenses is the structural prerequisite for breaking the K's downward pull.
- Develop technology and AI skills proactively: in an AI-driven K-shaped economy, workers exposed to technology capture more gains. A single data literacy, AI tools, or technology certification can shift earning power by 10–30% over five years — a return that exceeds most financial instruments.
- Understand tax-advantaged accounts: Roth IRAs, HSAs, and 529s allow middle and lower-income households to accumulate wealth in tax-privileged structures. Financial literacy about these instruments is itself a K-shaped differentiator — upper-arm households use them routinely.
- Track net worth annually: the shift from income-focused to net-worth-focused financial thinking is the psychological prerequisite for building the asset base that characterises the upper arm. Income is a flow; net worth is the stock that generates K-shaped wealth.
For households on the upper arm: resilience and diversification
Upper-arm households face their own K-shaped vulnerabilities — specifically, over-concentration in the same assets driving recent gains. RBC Economics (April 2026) identifies aggregate demand as 'far more fragile than headline figures suggest' when spending depends so heavily on the affluent segment. A market correction, AI investment slowdown, or policy shift targeting wealth concentration could disproportionately impact upper-arm households whose wealth is concentrated in equities and financial assets.- Diversify beyond equities: real assets (property, inflation-protected bonds, international equity) reduce concentration risk in a domestic AI-driven market that may be pricing in a great deal of future optimism.
- Engage with estate and tax planning: at higher wealth levels, failure to optimise tax strategy (Roth conversions, tax-loss harvesting, charitable giving structures) is a significant unnecessary drag on long-term wealth accumulation.
- Financial awareness is a shared interest: the K-shaped economy's concentration of spending power in the top 10% creates macroeconomic fragility — a financial crisis or policy shock affecting affluent households removes the economy's primary demand engine.
The E-Shaped Update: Is the Middle Class Creating a Third Strand?
An important 2026 development in the K-shaped economy discussion is the emergence of what Bank of America and Fortune Magazine (February 12, 2026) are calling the 'E-shaped economy' — the observation that the middle class is now diverging from both the upper and lower arms, creating a three-stranded pattern. Fortune's February 2026 analysis reports:'New analysis from Bank of America suggests the trajectory of middle-class consumers is now pulling away from those on the lower end of the income spectrum: these consumers aren't doing as well as wealthy people, but their spending power isn't as diminished as that of poorer consumers.' Bank of America's data shows the share of households paying off their full credit card balance each month has risen across all incomes and generations since 2019 — including lower-income young people, whose financial discipline score rose nearly 20 points from a 2019 baseline of 100. This suggests that improved financial behaviour is occurring even within the lower arm — and that the K-shaped narrative, while structurally accurate, does not imply absolute immobility for all households on the downward slope. Financial awareness, applied consistently, can shift position within the distribution even when structural forces are working against you.
CONCLUSION
The K-shaped economy of 2026 is not a metaphor — it is a measurable, data-confirmed structural reality. The top 1% hold 32% of all net wealth (a record high since 1989), the bottom 50% hold 2.5%, the Gini coefficient has reached a 60-year high, and the mechanisms driving this divergence — asset appreciation, differential inflation, AI-led productivity capture, and the decline of labour's share of GDP to a 75-year low — are all structural and self-reinforcing. As Mark Zandi of Moody's told CNBC in January 2026: this is not cyclical. Economists do not see an end in sight.But the K-shaped economy is also not destiny for every individual within it. Financial awareness — genuine, applied knowledge of how assets compound, how high-interest debt destroys wealth, how tax-advantaged accounts work, and how AI and technology skills affect earning power — is the most accessible lever available to households seeking to improve their position within a structurally unequal economy. The upper arm of the K is increasingly defined by financial literacy, asset ownership, and technology adaptability as well as by birthright and initial wealth. These are acquirable. The Bank of America data behind the E-shaped economy update shows that financial behaviour can improve even within the lower arm — that awareness, applied consistently, can shift position within the distribution. Start with the first investment. Build the emergency fund. Eliminate the highest-cost debt. Develop one AI-relevant skill. The K-shaped economy is a structural force. Financial awareness is a personal one. Between them, there is agency.
Frequently Asked Questions
What does K-shaped economy mean in plain language?
A K-shaped economy is one in which economic growth or recovery produces two simultaneous and opposite outcomes. Those on the upper arm — higher-income households, asset owners, and technology-linked workers — experience rising income, wealth, and spending power. Those on the lower arm — lower-income households, wage-dependent workers, and those in vulnerable sectors — experience stagnation or decline. The term was coined to describe the uneven COVID-19 recovery and, as Moody's chief economist Mark Zandi told CNBC in January 2026, has become a structural feature of the US economy. The Federal Reserve's Q3 2025 data confirms the K in its starkest form: the top 1% hold a record 32% of all net wealth; the bottom 50% hold just 2.5%.How does income inequality specifically drive financial awareness?
Income inequality drives financial awareness in two connected directions. Upper-arm households develop financial awareness organically through asset ownership — managing stocks, real estate, retirement accounts, and tax strategy creates financial literacy as a by-product of financial participation. Professional networks in higher-income brackets share knowledge routinely: Roth conversions, tax-loss harvesting, equity compensation, refinancing timing. Lower-arm households, by contrast, encounter financial education reactively — through crisis, predatory products, and high-cost debt instruments. The financial products accessible to lower-income households are often structurally designed to extract wealth. This creates a compounding knowledge gap that mirrors the compounding wealth gap: the financially informed accumulate advantage, the financially excluded accumulate cost. Understanding this mechanism is the first step toward using financial literacy as a deliberate counter to structural K-shaped forces.Is the K-shaped economy permanent or can it be reversed?
The K-shaped economy is structural and deeply embedded, but not necessarily permanent. Economists identify several policy levers: progressive wealth taxes (reducing asset-owner advantage), universal access to asset-building tools (expanded 401(k) access, universal retirement accounts), strengthening of collective bargaining to improve labour's share of GDP (at a 75-year low per BLS), and investment in public financial education. However, US Bank's March 2026 analysis notes that 'the current environment amplifies long-standing inequality, with the greatest gains tilted toward higher-income households, as the share of Americans in the middle class shrinks.' Absent deliberate policy intervention, the structural forces — AI capital concentration, asset appreciation compounding, differential inflation, and the decline of unionisation — will continue to widen the K. Individual financial awareness and behaviour can shift position within the distribution, but cannot offset structural forces at the macroeconomic level without policy change.How does AI specifically deepen K-shaped inequality?
AI deepens K-shaped inequality through three channels. First, capital concentration: AI infrastructure requires massive capital investment, and returns accrue to shareholders — a group that Gallup data shows is 87% concentrated in households earning $100,000+. Second, labour displacement: AI automates middle-skill routine tasks (analysis, data processing, customer service) that provide middle-income employment, while the high-paying technical roles it creates require advanced education. Third, productivity capture: AI-enabled productivity gains flow to firms and shareholders rather than workers, particularly in industries with weak collective bargaining. Capital Analytics Associates (February 2026) states: 'Artificial intelligence capital expenditure has widened this divide.' The workers and firms exposed to technology capture more of the gains; lower-wage service workers capture less. For individuals, the counter-move is direct: acquiring AI and technology skills is the most accessible path to the upper-arm dynamic available in the current environment.What is the E-shaped economy and how does it differ from K-shaped?
The E-shaped economy is a 2026 refinement of the K-shaped narrative proposed by Bank of America and reported in Fortune (February 12, 2026). It suggests that rather than a simple two-way split, three divergent trajectories have emerged: the upper arm (wealthy households, continuing to thrive), a middle strand (middle-class households, struggling but holding ground), and a lower arm (lower-income households, under the most acute financial pressure). The E-shape captures that middle-class consumers are now pulling away from those on the lower end — they are not doing as well as the wealthy, but their spending power is not as compressed as that of the poorest households. This is contested — the Minneapolis Federal Reserve's March 2026 K-shaped data review notes the evidence is methodologically mixed — but it introduces an important nuance: the K-shaped economy does not imply absolute immobility. Financial behaviour and awareness can shift where within the distribution a household sits, even when structural forces are working against them.References
CNBC — Wealth Inequality and the K-Shaped Economy Are More Striking Than Ever (January 30, 2026) https://www.cnbc.com/2026/01/30/wealth-inequality-k-shaped-economy-united-states-consumer-spending-trump.htmlCBS News — US Wealth Gap Widest in Three Decades, Federal Reserve Data (January 2026) https://www.cbsnews.com/news/us-wealth-gap-widest-in-three-decades-federal-reserve/
US Bank — The K-Shaped Economy in 2026: Analysis (March 2026) https://www.usbank.com/corporate-and-commercial-banking/insights/economy/macro/k-shaped-economy.html
Fortune — K-Shaped Economy: What It Is and Why It Matters (Updated March 2026) https://fortune.com/article/what-is-k-shaped-economy-wealth-inequality-explained/
Fortune — Welcome to the E-Shaped Economy: Middle Class Also Struggling (February 12, 2026) https://fortune.com/2026/02/12/e-shaped-economy-middle-lower-upper-class-k-shaped-economy-bank-america-data/
Fortune — Billionaires Warn About US Wealth Inequality Economic Risks (March 2026) https://fortune.com/2026/03/17/billionaires-warn-about-us-wealth-inequality-economic-risks/
Axios — New Research Confirms US Economy's K-Shaped Dynamics (May 2026) https://www.axios.com/2026/05/01/us-economy-spending-growth-income
New York Federal Reserve Liberty Street Economics — Explaining the K-Shaped Economy (May 2026) https://libertystreeteconomics.newyorkfed.org/2026/05/explaining-the-k-shaped-economy-whats-behind-the-divide/
Minneapolis Federal Reserve — Have US Consumers Gone K-Shaped? A Review of the Data (March 2026) https://www.minneapolisfed.org/article/2026/have-us-consumers-gone-k-shaped-a-review-of-the-data
Capital Analytics Associates — AI Boom Underpinning a K-Shaped Economy? (February 2026) https://capitalanalyticsassociates.com/ai-boom-underpinning-a-k-shaped-economy/
Empower — The K-Shaped Economy: What Consumers Should Know (February 2026) https://www.empower.com/the-currency/money/life/k-shaped-economy-what-to-know-news

0 Comments Comments