
Investing
S&P 500 Concentration Risk: ETFs That Spread Your Risk

For every $1 you invest in the S&P 500, $0.43 goes directly into just 10 stocks. That is not diversification. Here is how five ETF structures address the problem without abandoning the US market.
When you invest in an S&P 500 index fund, the name implies you are spreading your money across 500 of America’s largest companies. And technically, you are. But the way index funds work, buying ‘the S&P 500’ in 2026 does not mean giving each of those 500 companies a roughly equal share of your money. It means giving 10 companies approximately 43 cents of every dollar you invest — and giving the remaining 490 companies approximately 57 cents combined. Investment News reported in July 2026 that the top 10 stocks in the index now account for approximately 43% of its total market capitalisation, a record high and nearly double the historical average of 18 to 23% that held from 1990 to 2015. The Journal of Wealth Management published academic research in 2026 concluding that investors should diversify outside major indexes when top-10 concentration reaches 40% or above. That threshold has been exceeded. This article explains the concentration problem in plain terms, with the historical context that shows why it matters, and covers five categories of ETF that address it — each with a different mechanism, a different trade-off, and a different use case.
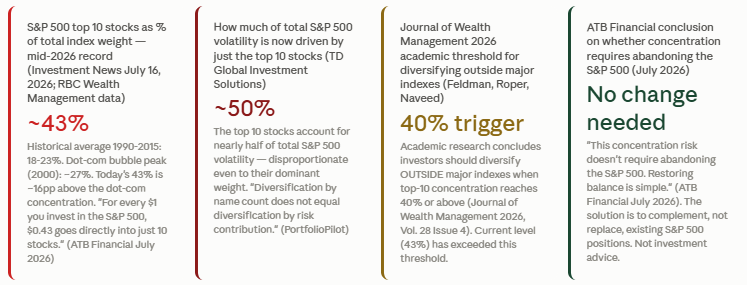
Investment News reported in July 2026 that the top 10 stocks in the index now account for approximately 43% of its total market capitalisation, a record high and nearly double the historical average of 18 to 23% that held from 1990 to 2015. That figure comes from RBC Wealth Management. As of end-2024, the Baird Wealth analysis put the top 10 at 38.7%, with seven of the 10 being technology and internet companies. The top five companies alone — Apple, NVIDIA, Microsoft, Amazon, and Alphabet — comprised 28.7% of the index at that point, the highest concentration in the top 5 since 1980 and a 17.3% increase in under a decade. TD Global Investment Solutions’ concentration analysis adds a dimension that the headline weight figure alone does not capture: the effective contributor count of the S&P 500 has dropped to just under 10%, a 15-year low. More striking still, the top 10 stocks now account for nearly half of the total volatility in the index — meaning the risk contribution of those 10 companies is disproportionate even to their already-dominant weight.
Top 10 S&P 500 stocks: ~43% of total index weight as of mid-2026 (Investment News; RBC Wealth Management). Historical average 1990-2015: 18-23%. Dot-com bubble peak 2000: ~27%. Top 5 alone: 28.7% at end-2024 — highest since 1980 (Baird Wealth). Top 10 now account for nearly half of total S&P 500 volatility (TD Global Investment Solutions).
PortfolioPilot’s analysis made the recovery point explicit: following the 2000 dot-com peak, the S&P 500 took nearly seven years to fully recover, underscoring how concentration risk can delay portfolio recovery. ATB Financial articulated the sensitivity threshold identified from historical data: ‘History suggests that when the top 10 stocks make up close to 30% of the S&P 500, investors tend to get more concerned and selling pressure creeps in.’ The current level is nearly 14 percentage points above that historical sensitivity threshold. The Journal of Wealth Management’s 2026 academic research by Feldman, Roper, and Naveed reached a direct conclusion from analysing top-10 concentration back to 1979: investors should diversify their investments outside of major indexes when top-10 concentrations reach 40% or above.
Historical S&P 500 top-10 weight: 1985 = 21%; 1995 = 18%; 2000 (dot-com peak) = 27%; 2015 = 18%; 2025 = 38-39%; mid-2026 = 43% (record). Sources: JPMorgan visualization via Landmark Wealth; RBC Wealth Management via Investment News; Forbes/ClaritX via Madison Partners; ATB Financial.
PortfolioPilot’s diversification analysis captured the logical implication: ‘Diversification by name count does not equal diversification by risk contribution.’ The S&P 500’s name says 500, but its risk profile says something closer to 10+490. The good news, as ATB Financial’s July 2026 guide was clear about: ‘This concentration risk doesn’t require abandoning the S&P 500. Restoring balance is simple.’ The five ETF types that follow are the tools for that restoration.
For every $1 invested in a standard S&P 500 index fund in mid-2026, approximately $0.43 goes to just 10 stocks. The remaining 490 companies share $0.57. 'Diversification by name count does not equal diversification by risk contribution.' Sources: ATB Financial July 2026; Madison Partners; PortfolioPilot.
Equal weighting the S&P 500 reduces top 10 concentration from 40%+ to ~2% — same 500 stocks, dramatically different risk distribution. A 4-5 percentage point performance gap vs cap-weighted is the cost or benefit of the weighting method. Sources: Madison Partners; RSP Invesco; Landmark Wealth July 2026.
International ETFs (VXUS, EFA) add thousands of non-US stocks with a completely different sector and concentration profile. Directly addresses US tech-megacap dominance. Investment News July 2026: one adviser specifically rotates into international equity to manage S&P 500 concentration risk. Currency risk applies.
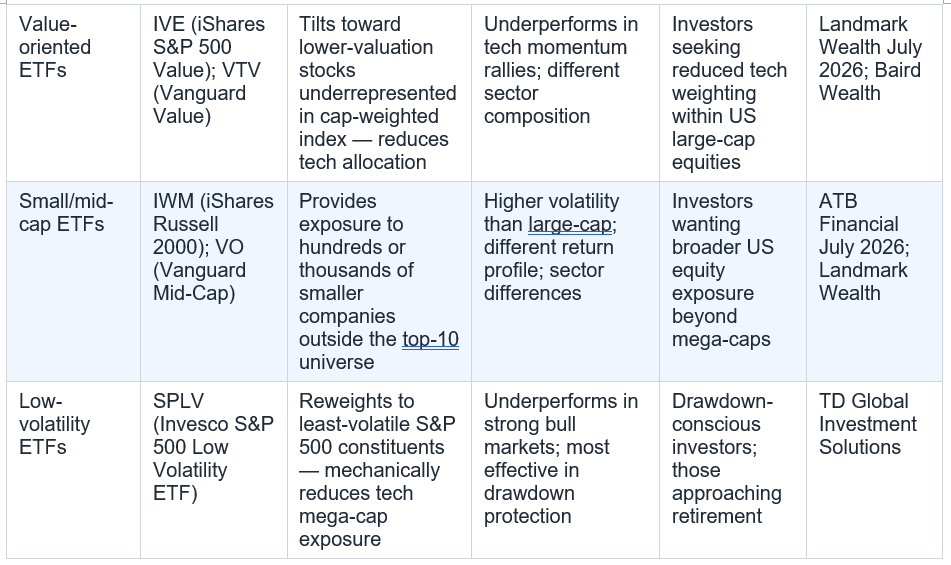
Value ETFs (IVE, VTV) tilt away from high-valuation mega-caps toward financials, energy, healthcare and industrials — naturally reducing tech concentration. Landmark Wealth July 2026: increasingly explored to reduce single-stock risk. Long-run value premium supported by academic research.
Small and mid-cap ETFs (IWM, VO) add companies entirely outside the S&P 500's concentration problem. The top 10 S&P 500 companies represent a negligible share of the Russell 2000. Broadens exposure without abandoning US equities. ATB Financial July 2026: concentration risk doesn't require abandoning S&P 500.
Low-vol ETFs (SPLV) reweight away from volatile tech mega-caps toward utilities, consumer staples, and healthcare — addressing concentration indirectly through volatility reduction. TD Global Investment: top 10 now drive nearly half of S&P 500 volatility. Useful for drawdown-conscious investors.
Investment News’ July 2026 roundtable of wealth advisers produced a nuanced framework from one of its contributors: ‘Guinness Global Investors published analysis in July 2026 noting that the top 10’s earnings growth share had declined from a 2024 peak toward 50%, suggesting the rest of the index has begun contributing again. That broadening, they argue, is healthy even if headline concentration figures remain historically extreme.’ And BlackRock’s data, cited by Madison Partners, shows that the top 20 S&P 500 companies delivered 10.5% revenue growth over the past year — nearly double the rate of the remaining 480. The companies are genuinely performing. The counterargument to concentration diversification is not that risk does not exist — it is that the risk is being compensated by genuine earnings power. Investment News summarised the framework: ‘Concentration is justified — until it isn’t.’
Investment News July 2026: 'Concentration is justified — until it isn't.' Guinness Global Investors (July 2026): the top 10's earnings growth share has declined from 2024 peak, suggesting the rest of the index is contributing more. BlackRock: top 20 companies delivered 10.5% revenue growth — nearly double the remaining 480. Sources cited.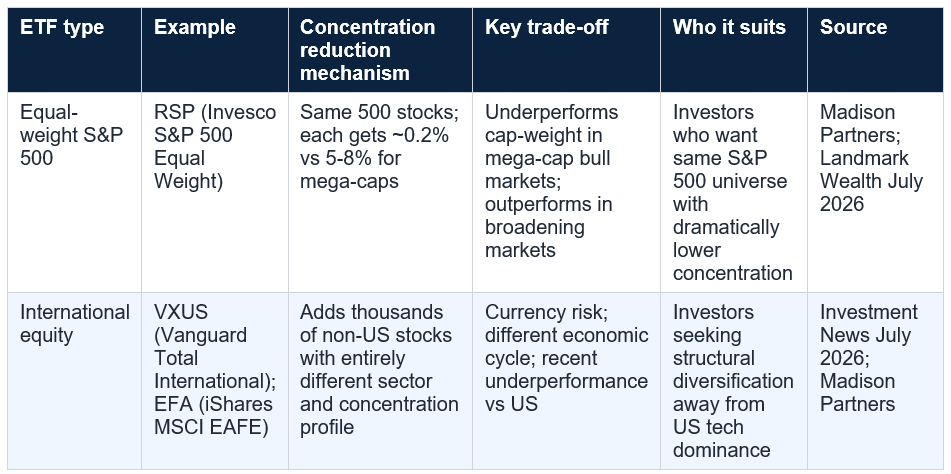
Note: ETF tickers are examples only. Costs, holdings, and structures change regularly. Not all ETFs are available in all markets or accounts. Verify current fees, holdings, and structure before investing. Not financial or investment advice. Not affiliated with any cited fund provider.
But the solution is not to abandon the S&P 500 — a point made explicitly by ATB Financial’s July 2026 analysis. The solution is to complement it. An equal-weight version of the same 500 stocks immediately addresses the weighting distortion. International ETFs add geographical and sectoral breadth. Value-tilted ETFs reduce tech-megacap exposure within US equities. Small and mid-cap ETFs capture the 490+ companies the cap-weighted index effectively ignores.
Low-vol ETFs address the risk contribution asymmetry identified by TD Global Investment Solutions. None of these involves dramatic portfolio changes. Each involves adding or shifting to a complementary structure that distributes the $0.43-per-dollar mega-cap concentration across a broader range of risks. Investment News’ advisers were clear in July 2026: concentration is not automatically wrong — but ignoring it is a choice, not a default. Not investment advice. Consult a qualified financial adviser before making any investment decisions.
As of mid-2026, the top 10 stocks in the S&P 500 account for approximately 43% of the index's total market capitalisation, according to Investment News citing RBC Wealth Management data. This is a record high, nearly double the historical average of 18-23% that held from 1990 to 2015. For comparison, at the peak of the dot-com bubble in 2000, the top 10 stocks represented approximately 27% of the index — still significantly below the current level. The top 5 companies alone (Apple, NVIDIA, Microsoft, Amazon, Alphabet) constituted 28.7% of the index at end-2024, the highest concentration in the top 5 since 1980. TD Global Investment Solutions notes that the top 10 stocks now account for nearly half of the S&P 500's total volatility — meaning the risk contribution of those companies is disproportionate even to their dominant weight. Sources: Investment News July 2026; RBC Wealth Management; Baird Wealth; TD Global Investment Solutions.
What is the risk of S&P 500 concentration for passive investors?
The core risk is that what appears to be broad diversification across 500 companies is, in practice, a significant bet on 10 mega-cap companies. PortfolioPilot's analysis summarises this: 'Diversification by name count does not equal diversification by risk contribution.' For every $1 invested in a standard cap-weighted S&P 500 fund, approximately $0.43 goes to just 10 stocks. The historical parallel is instructive: following the dot-com concentration peak in 2000, the S&P 500 took nearly seven years to fully recover. ATB Financial's historical research found that during the 1950s and 1960s — the last time the top 10 exceeded 30% of the S&P 500 — the market experienced three separate bear markets with declines of 20% or more. The Journal of Wealth Management's 2026 academic research concluded that investors should diversify outside major indexes when top-10 concentration reaches 40% or above. Sources: PortfolioPilot; ATB Financial July 2026; Journal of Wealth Management 2026.
What is an equal-weight S&P 500 ETF and how does it help?
An equal-weight S&P 500 ETF gives each of the 500 companies in the S&P 500 exactly the same allocation — approximately 0.2% each — regardless of its market capitalisation. This contrasts with the standard cap-weighted S&P 500, where the largest companies receive the largest allocations (5-8% each for the top names). The Invesco S&P 500 Equal Weight ETF (RSP) is the most widely cited example. The practical effect on concentration is dramatic: the top 10 weighting falls from approximately 43% in the cap-weighted version to approximately 2% in the equal-weight version, despite owning the exact same 500 stocks. Madison Partners' analysis found a 4-5 percentage point return gap between RSP and a cap-weighted S&P 500 fund — this gap represents the return difference from weighting alone. In periods when mega-caps outperform, cap-weight leads. In periods when the broader market catches up, equal-weight leads. Sources: Madison Partners; Landmark Wealth July 2026; Invesco RSP. Not investment advice. Verify current costs and structure with Invesco.
Do I need to stop investing in S&P 500 index funds to reduce concentration risk?
No. ATB Financial's July 2026 guide was explicit on this point: 'This concentration risk doesn't require abandoning the S&P 500. Restoring balance is simple.' The approaches available range from the minimalist (adding a single international equity ETF or equal-weight S&P 500 ETF to complement an existing cap-weighted position) to the more comprehensive (adding value, small/mid-cap, and international allocations). Even a modest allocation — adding 10-20% international or equal-weight exposure to a cap-weighted S&P 500 core — meaningfully reduces the mega-cap concentration without abandoning the structural advantages of broad US market exposure. The key question for each investor is: what share of my portfolio am I comfortable having in the top 10 US tech mega-caps? Once answered, the allocation can be adjusted incrementally. Sources: ATB Financial July 2026; Investment News July 2026.
Is concentration in the S&P 500 necessarily a bad thing?
Not automatically. The investment case for the current concentration is that the companies involved — Nvidia, Apple, Microsoft, Amazon, Alphabet, Meta, and others — genuinely earned their valuations through extraordinary revenue growth, earnings, and competitive moats. BlackRock's data, cited by Madison Partners, shows that the top 20 S&P 500 companies delivered 10.5% revenue growth over the past year, nearly double the rate of the remaining 480. Investment News' July 2026 coverage cited Guinness Global Investors' analysis noting that the top 10's earnings growth share has declined from its 2024 peak, suggesting the rest of the index is contributing more — a healthy broadening. The framework articulated by Investment News' advisers is: 'Concentration is justified — until it isn't.' The risk is not that the concentration necessarily produces worse returns in the short term. The risk is that it produces significantly worse recovery in the event of a reversal, particularly if the reversal is driven by sector-specific factors affecting the AI/tech mega-caps. Sources: Investment News July 2026; Madison Partners; Landmark Wealth July 2026.
When you invest in an S&P 500 index fund, the name implies you are spreading your money across 500 of America’s largest companies. And technically, you are. But the way index funds work, buying ‘the S&P 500’ in 2026 does not mean giving each of those 500 companies a roughly equal share of your money. It means giving 10 companies approximately 43 cents of every dollar you invest — and giving the remaining 490 companies approximately 57 cents combined. Investment News reported in July 2026 that the top 10 stocks in the index now account for approximately 43% of its total market capitalisation, a record high and nearly double the historical average of 18 to 23% that held from 1990 to 2015. The Journal of Wealth Management published academic research in 2026 concluding that investors should diversify outside major indexes when top-10 concentration reaches 40% or above. That threshold has been exceeded. This article explains the concentration problem in plain terms, with the historical context that shows why it matters, and covers five categories of ETF that address it — each with a different mechanism, a different trade-off, and a different use case.
Table of Contents
- The Concentration Problem: What the Numbers Actually Show
- Why This Matters: Historical Precedent and Current Risk
- The $1 Illustration: Where Your Index Money Actually Goes
- ETF Type 1: Equal-Weight S&P 500 ETFs — RSP (Invesco S&P 500 Equal Weight ETF)
- ETF Type 2: International Equity ETFs — VXUS (Vanguard Total International), EFA (iShares MSCI EAFE)
- ETF Type 3: Value-Oriented ETFs — IVE (iShares S&P 500 Value ETF), VTV (Vanguard Value ETF)
- ETF Type 4: Small and Mid-Cap ETFs — IWM (iShares Russell 2000), VO (Vanguard Mid-Cap ETF)
- ETF Type 5: Low Volatility ETFs — SPLV (Invesco S&P 500 Low Volatility ETF)
- The Trade-Offs: Why Concentration Also Has Defenders
- The ETF Comparison Table
- Conclusion: You Don’t Have to Choose Between the S&P 500 and Diversification
- Frequently Asked Questions
The Concentration Problem: What the Numbers Actually Show
The S&P 500 has a name that implies breadth — 500 companies, the largest in America, providing the kind of diversification that basic investing wisdom says any sensible portfolio needs. But the index is not built by giving each of its 500 constituents an equal slice. It is built by weighting each company by its market capitalisation — its total stock market value. The bigger the company, the larger its share of the index. And some companies have become extraordinarily large.Investment News reported in July 2026 that the top 10 stocks in the index now account for approximately 43% of its total market capitalisation, a record high and nearly double the historical average of 18 to 23% that held from 1990 to 2015. That figure comes from RBC Wealth Management. As of end-2024, the Baird Wealth analysis put the top 10 at 38.7%, with seven of the 10 being technology and internet companies. The top five companies alone — Apple, NVIDIA, Microsoft, Amazon, and Alphabet — comprised 28.7% of the index at that point, the highest concentration in the top 5 since 1980 and a 17.3% increase in under a decade. TD Global Investment Solutions’ concentration analysis adds a dimension that the headline weight figure alone does not capture: the effective contributor count of the S&P 500 has dropped to just under 10%, a 15-year low. More striking still, the top 10 stocks now account for nearly half of the total volatility in the index — meaning the risk contribution of those 10 companies is disproportionate even to their already-dominant weight.
Top 10 S&P 500 stocks: ~43% of total index weight as of mid-2026 (Investment News; RBC Wealth Management). Historical average 1990-2015: 18-23%. Dot-com bubble peak 2000: ~27%. Top 5 alone: 28.7% at end-2024 — highest since 1980 (Baird Wealth). Top 10 now account for nearly half of total S&P 500 volatility (TD Global Investment Solutions).
Why This Matters: Historical Precedent and Current Risk
The history of market concentration offers an uncomfortable reference point. Madison Partners’ mid-2026 analysis of S&P 500 concentration noted that at the peak of the dot-com bubble in 2000, the top 10 stocks represented roughly 27% of the index. Today, that same top 10 slice exceeds 41%. The current concentration is approximately 16 percentage points above the previous bubble peak. ATB Financial’s July 2026 guide to managing concentration noted another historical parallel: during the 1950s and 1960s — the last time the top 10 stocks exceeded 30% of the S&P 500 — the market experienced three separate bear markets with declines of 20% or more.PortfolioPilot’s analysis made the recovery point explicit: following the 2000 dot-com peak, the S&P 500 took nearly seven years to fully recover, underscoring how concentration risk can delay portfolio recovery. ATB Financial articulated the sensitivity threshold identified from historical data: ‘History suggests that when the top 10 stocks make up close to 30% of the S&P 500, investors tend to get more concerned and selling pressure creeps in.’ The current level is nearly 14 percentage points above that historical sensitivity threshold. The Journal of Wealth Management’s 2026 academic research by Feldman, Roper, and Naveed reached a direct conclusion from analysing top-10 concentration back to 1979: investors should diversify their investments outside of major indexes when top-10 concentrations reach 40% or above.
Historical S&P 500 top-10 weight: 1985 = 21%; 1995 = 18%; 2000 (dot-com peak) = 27%; 2015 = 18%; 2025 = 38-39%; mid-2026 = 43% (record). Sources: JPMorgan visualization via Landmark Wealth; RBC Wealth Management via Investment News; Forbes/ClaritX via Madison Partners; ATB Financial.
The $1 Illustration: Where Your Index Money Actually Goes
The simplest way to grasp what S&P 500 concentration means in practice is the dollar illustration used by ATB Financial and Madison Partners. ATB’s July 2026 analysis wrote it plainly: ‘For every $1 you invest in the S&P 500, $0.40 goes directly into just ten stocks.’ At the current 43% concentration reported by Investment News, that figure is closer to $0.43. The remaining $0.57 is split among the other 490 companies. Some of those 490 are genuinely substantial companies — JPMorgan Chase, Johnson & Johnson, Procter & Gamble. But many are small enough within the index that their individual contribution is negligible. A company at the 400th position in the S&P 500 by market cap might represent 0.03-0.05% of the index. A 10% decline in that company is essentially invisible in a cap-weighted fund.PortfolioPilot’s diversification analysis captured the logical implication: ‘Diversification by name count does not equal diversification by risk contribution.’ The S&P 500’s name says 500, but its risk profile says something closer to 10+490. The good news, as ATB Financial’s July 2026 guide was clear about: ‘This concentration risk doesn’t require abandoning the S&P 500. Restoring balance is simple.’ The five ETF types that follow are the tools for that restoration.
For every $1 invested in a standard S&P 500 index fund in mid-2026, approximately $0.43 goes to just 10 stocks. The remaining 490 companies share $0.57. 'Diversification by name count does not equal diversification by risk contribution.' Sources: ATB Financial July 2026; Madison Partners; PortfolioPilot.
ETF Type 1: Equal-Weight S&P 500 ETFs
RSP (Invesco S&P 500 Equal Weight ETF)
The most direct structural response to S&P 500 top-heaviness is the equal-weight version of the same index. Rather than weighting each company by its market capitalisation — which gives Apple, Nvidia, and Microsoft their outsized 5-8% individual slots — an equal-weight ETF gives all 500 companies exactly the same allocation, approximately 0.2% each. The Invesco S&P 500 Equal Weight ETF (RSP) is the most widely cited example. The practical effect is dramatic: the top 10 concentration falls from more than 40% to approximately 2%. You own the same 500 companies. You are just not betting that the 10 biggest will keep outperforming. Madison Partners’ mid-2026 concentration analysis made a revealing comparison: there is a gap of nearly 4 to 5 percentage points between RSP and a standard cap-weighted S&P 500 fund despite both owning the exact same stocks. That performance gap — in either direction — is the pure expression of the weighting difference. In periods when the mega-caps outperform, cap-weighted wins. In periods when the broader market catches up, equal-weight wins. Landmark Wealth Management’s July 2026 analysis noted that investors are increasingly exploring equal-weighted S&P 500 strategies to reduce single-stock risk. The journal paper by Feldman, Roper, and Naveed (Journal of Wealth Management, 2026) concluded that investors should diversify outside major indexes when top-10 concentration reaches 40% or above — a threshold clearly exceeded in 2026.Equal weighting the S&P 500 reduces top 10 concentration from 40%+ to ~2% — same 500 stocks, dramatically different risk distribution. A 4-5 percentage point performance gap vs cap-weighted is the cost or benefit of the weighting method. Sources: Madison Partners; RSP Invesco; Landmark Wealth July 2026.
ETF Type 2: International Equity ETFs
VXUS (Vanguard Total International), EFA (iShares MSCI EAFE)
The simplest way to diversify away from US mega-cap concentration is to add exposure to companies in other countries, which have entirely different indices, sector compositions, and concentration profiles. International equity ETFs like Vanguard’s VXUS (Total International Stock ETF) provide exposure to thousands of non-US equities across developed and emerging markets. The iShares MSCI EAFE ETF (EFA) covers developed markets in Europe, Australasia, and the Far East. Investment News’ July 2026 analysis of how advisers are managing S&P 500 concentration risk specifically cited international equity as a direct response: one adviser singled out international and healthcare as the primary rotation destinations for clients concerned about US concentration. The logic is structural: the top 10 of the FTSE All-World ex-US index looks nothing like the top 10 of the S&P 500 — it is populated by European financials, Japanese industrials, and consumer goods companies rather than American AI-infrastructure mega-caps. Adding international exposure does not eliminate risk; it changes the risk character of the portfolio. Madison Partners’ concentration guide noted explicitly: ‘International funds carry currency risk.’ Investors should understand that international ETFs introduce exposure to foreign exchange movements and different economic cycles.International ETFs (VXUS, EFA) add thousands of non-US stocks with a completely different sector and concentration profile. Directly addresses US tech-megacap dominance. Investment News July 2026: one adviser specifically rotates into international equity to manage S&P 500 concentration risk. Currency risk applies.
ETF Type 3: Value-Oriented ETFs
IVE (iShares S&P 500 Value ETF), VTV (Vanguard Value ETF)
Value ETFs select and tilt toward lower-valuation companies within the S&P 500 universe — those trading at lower price-to-earnings, price-to-book, or price-to-sales multiples relative to the market. Since the mega-cap tech companies driving S&P 500 concentration trade at high valuations, a value-oriented ETF naturally reduces their weighting in favour of financial, energy, healthcare, and industrial companies. Landmark Wealth Management’s July 2026 analysis specifically listed value-oriented ETFs as one of the structural tools investors are exploring to reduce single-stock risk from S&P 500 concentration. The iShares S&P 500 Value ETF (IVE) and Vanguard Value ETF (VTV) both apply value tilts to US large-cap equities. Value investing has a long academic pedigree as a factor that has historically produced superior risk-adjusted returns over full market cycles, though it has significantly underperformed in the recent growth-and-tech-dominated environment. The concentration data from the Baird Wealth analysis is relevant here: the top five companies (Apple, NVIDIA, Microsoft, Amazon, Alphabet) comprised 28.7% of the S&P 500 at end-2024, the highest concentration in the top 5 since 1980. Value-tilted ETFs reduce all five of these positions significantly.Value ETFs (IVE, VTV) tilt away from high-valuation mega-caps toward financials, energy, healthcare and industrials — naturally reducing tech concentration. Landmark Wealth July 2026: increasingly explored to reduce single-stock risk. Long-run value premium supported by academic research.
ETF Type 4: Small and Mid-Cap ETFs
IWM (iShares Russell 2000), VO (Vanguard Mid-Cap ETF)
The S&P 500’s top 10 concentration problem is, at its root, a large-cap problem: the companies that have grown to dominate the index are the largest companies in American history by market capitalisation. The most direct structural antidote is to shift allocation toward smaller companies — those in the 500 to 2,000 range by size — where no single company dominates and the sector composition looks very different from a tech-dominated mega-cap index. The iShares Russell 2000 ETF (IWM) provides exposure to approximately 2,000 small-cap US companies. The Vanguard Mid-Cap ETF (VO) covers the middle tier of the US market. ATB Financial’s July 2026 guide to managing S&P 500 concentration noted that the concentration risk ‘doesn’t require abandoning the S&P 500’ but benefits from broadening exposure. Small and mid-cap ETFs are one mechanism for that broadening. Landmark Wealth’s July 2026 analysis framed the historical parallel: in July 2026, the top positions include Eli Lilly, Tesla, Meta, Micron, Broadcom, Amazon, Microsoft, Alphabet, Apple, and Nvidia — a composition almost entirely absent from the small and mid-cap universe. Adding small/mid-cap exposure directly addresses the concentration by adding a large block of stocks that are structurally uncorrelated with the mega-cap dominance story.Small and mid-cap ETFs (IWM, VO) add companies entirely outside the S&P 500's concentration problem. The top 10 S&P 500 companies represent a negligible share of the Russell 2000. Broadens exposure without abandoning US equities. ATB Financial July 2026: concentration risk doesn't require abandoning S&P 500.
ETF Type 5: Low Volatility ETFs
SPLV (Invesco S&P 500 Low Volatility ETF)
TD Global Investment Solutions’ research on S&P 500 concentration specifically recommended low-volatility strategies as one mechanism for managing the concentration risk problem: ‘How Low Vol May Help Manage Concentration.’ The mechanism is indirect but effective. Low-volatility ETFs reweight the S&P 500 universe toward its less volatile constituents — utilities, consumer staples, healthcare, and REITs — and away from its more volatile components, which in 2026 include many of the tech and AI-adjacent mega-caps that dominate the cap-weighted index. The Invesco S&P 500 Low Volatility ETF (SPLV) holds the 100 least-volatile stocks in the S&P 500, rebalanced quarterly. The result is a portfolio that still draws from S&P 500 constituents but has a fundamentally different sector composition — and therefore a fundamentally different concentration profile — from the standard cap-weighted version. TD’s analysis found that the top 10 S&P 500 stocks now account for nearly half of the total volatility in the index — meaning a low-vol strategy mechanically reduces exposure to the most concentrated names. For investors whose primary concern is drawdown protection and lower overall portfolio volatility — particularly those approaching retirement — a low-vol ETF can address both the concentration risk and the volatility risk simultaneously.Low-vol ETFs (SPLV) reweight away from volatile tech mega-caps toward utilities, consumer staples, and healthcare — addressing concentration indirectly through volatility reduction. TD Global Investment: top 10 now drive nearly half of S&P 500 volatility. Useful for drawdown-conscious investors.
The Trade-Offs: Why Concentration Also Has Defenders
A balanced treatment of S&P 500 concentration requires acknowledging a serious counterargument: the concentration happened because a small group of companies genuinely became extraordinarily valuable. They are not inflated because of euphoria alone. Landmark Wealth Management’s July 2026 analysis acknowledged this directly: ‘The companies driving today’s concentration have delivered remarkable innovation and shareholder value.’Investment News’ July 2026 roundtable of wealth advisers produced a nuanced framework from one of its contributors: ‘Guinness Global Investors published analysis in July 2026 noting that the top 10’s earnings growth share had declined from a 2024 peak toward 50%, suggesting the rest of the index has begun contributing again. That broadening, they argue, is healthy even if headline concentration figures remain historically extreme.’ And BlackRock’s data, cited by Madison Partners, shows that the top 20 S&P 500 companies delivered 10.5% revenue growth over the past year — nearly double the rate of the remaining 480. The companies are genuinely performing. The counterargument to concentration diversification is not that risk does not exist — it is that the risk is being compensated by genuine earnings power. Investment News summarised the framework: ‘Concentration is justified — until it isn’t.’
Investment News July 2026: 'Concentration is justified — until it isn't.' Guinness Global Investors (July 2026): the top 10's earnings growth share has declined from 2024 peak, suggesting the rest of the index is contributing more. BlackRock: top 20 companies delivered 10.5% revenue growth — nearly double the remaining 480. Sources cited.
The ETF Comparison Table
Note: ETF tickers are examples only. Costs, holdings, and structures change regularly. Not all ETFs are available in all markets or accounts. Verify current fees, holdings, and structure before investing. Not financial or investment advice. Not affiliated with any cited fund provider.
Conclusion
The S&P 500’s concentration problem is real, documented, and historically extreme. The top 10 stocks control approximately 43% of the index, a record level nearly double the historical average. The academic research is clear: when top-10 concentration reaches 40% or above, investors should consider diversifying outside the index (Journal of Wealth Management, 2026). The historical data is instructive: the dot-com era concentration — at 27%, significantly lower than today — preceded a 7-year recovery period.But the solution is not to abandon the S&P 500 — a point made explicitly by ATB Financial’s July 2026 analysis. The solution is to complement it. An equal-weight version of the same 500 stocks immediately addresses the weighting distortion. International ETFs add geographical and sectoral breadth. Value-tilted ETFs reduce tech-megacap exposure within US equities. Small and mid-cap ETFs capture the 490+ companies the cap-weighted index effectively ignores.
Low-vol ETFs address the risk contribution asymmetry identified by TD Global Investment Solutions. None of these involves dramatic portfolio changes. Each involves adding or shifting to a complementary structure that distributes the $0.43-per-dollar mega-cap concentration across a broader range of risks. Investment News’ advisers were clear in July 2026: concentration is not automatically wrong — but ignoring it is a choice, not a default. Not investment advice. Consult a qualified financial adviser before making any investment decisions.
Frequently Asked Questions
How concentrated is the S&P 500 in 2026?As of mid-2026, the top 10 stocks in the S&P 500 account for approximately 43% of the index's total market capitalisation, according to Investment News citing RBC Wealth Management data. This is a record high, nearly double the historical average of 18-23% that held from 1990 to 2015. For comparison, at the peak of the dot-com bubble in 2000, the top 10 stocks represented approximately 27% of the index — still significantly below the current level. The top 5 companies alone (Apple, NVIDIA, Microsoft, Amazon, Alphabet) constituted 28.7% of the index at end-2024, the highest concentration in the top 5 since 1980. TD Global Investment Solutions notes that the top 10 stocks now account for nearly half of the S&P 500's total volatility — meaning the risk contribution of those companies is disproportionate even to their dominant weight. Sources: Investment News July 2026; RBC Wealth Management; Baird Wealth; TD Global Investment Solutions.
What is the risk of S&P 500 concentration for passive investors?
The core risk is that what appears to be broad diversification across 500 companies is, in practice, a significant bet on 10 mega-cap companies. PortfolioPilot's analysis summarises this: 'Diversification by name count does not equal diversification by risk contribution.' For every $1 invested in a standard cap-weighted S&P 500 fund, approximately $0.43 goes to just 10 stocks. The historical parallel is instructive: following the dot-com concentration peak in 2000, the S&P 500 took nearly seven years to fully recover. ATB Financial's historical research found that during the 1950s and 1960s — the last time the top 10 exceeded 30% of the S&P 500 — the market experienced three separate bear markets with declines of 20% or more. The Journal of Wealth Management's 2026 academic research concluded that investors should diversify outside major indexes when top-10 concentration reaches 40% or above. Sources: PortfolioPilot; ATB Financial July 2026; Journal of Wealth Management 2026.
What is an equal-weight S&P 500 ETF and how does it help?
An equal-weight S&P 500 ETF gives each of the 500 companies in the S&P 500 exactly the same allocation — approximately 0.2% each — regardless of its market capitalisation. This contrasts with the standard cap-weighted S&P 500, where the largest companies receive the largest allocations (5-8% each for the top names). The Invesco S&P 500 Equal Weight ETF (RSP) is the most widely cited example. The practical effect on concentration is dramatic: the top 10 weighting falls from approximately 43% in the cap-weighted version to approximately 2% in the equal-weight version, despite owning the exact same 500 stocks. Madison Partners' analysis found a 4-5 percentage point return gap between RSP and a cap-weighted S&P 500 fund — this gap represents the return difference from weighting alone. In periods when mega-caps outperform, cap-weight leads. In periods when the broader market catches up, equal-weight leads. Sources: Madison Partners; Landmark Wealth July 2026; Invesco RSP. Not investment advice. Verify current costs and structure with Invesco.
Do I need to stop investing in S&P 500 index funds to reduce concentration risk?
No. ATB Financial's July 2026 guide was explicit on this point: 'This concentration risk doesn't require abandoning the S&P 500. Restoring balance is simple.' The approaches available range from the minimalist (adding a single international equity ETF or equal-weight S&P 500 ETF to complement an existing cap-weighted position) to the more comprehensive (adding value, small/mid-cap, and international allocations). Even a modest allocation — adding 10-20% international or equal-weight exposure to a cap-weighted S&P 500 core — meaningfully reduces the mega-cap concentration without abandoning the structural advantages of broad US market exposure. The key question for each investor is: what share of my portfolio am I comfortable having in the top 10 US tech mega-caps? Once answered, the allocation can be adjusted incrementally. Sources: ATB Financial July 2026; Investment News July 2026.
Is concentration in the S&P 500 necessarily a bad thing?
Not automatically. The investment case for the current concentration is that the companies involved — Nvidia, Apple, Microsoft, Amazon, Alphabet, Meta, and others — genuinely earned their valuations through extraordinary revenue growth, earnings, and competitive moats. BlackRock's data, cited by Madison Partners, shows that the top 20 S&P 500 companies delivered 10.5% revenue growth over the past year, nearly double the rate of the remaining 480. Investment News' July 2026 coverage cited Guinness Global Investors' analysis noting that the top 10's earnings growth share has declined from its 2024 peak, suggesting the rest of the index is contributing more — a healthy broadening. The framework articulated by Investment News' advisers is: 'Concentration is justified — until it isn't.' The risk is not that the concentration necessarily produces worse returns in the short term. The risk is that it produces significantly worse recovery in the event of a reversal, particularly if the reversal is driven by sector-specific factors affecting the AI/tech mega-caps. Sources: Investment News July 2026; Madison Partners; Landmark Wealth July 2026.
0 Comments
Be the first to share your thoughts on this article.