
Finance
The Complete US Inflation Guide: 2026 Data & Analysis

Key Statistics (BLS Release 12 August 2026): Headline CPI (July 2026): 3.4% year-over-year. Core CPI (all items less food and energy, July 2026): 2.5% YoY. Monthly CPI (July 2026): +0.1% MoM (rebounding from -0.4% in June). CPI Index level: 333.92 (July 2026), down from 333.95 (June) and 335.12 (May). Energy index: +14.7% YoY (July 2026). Gasoline: +24.6% YoY (July 2026). Fuel oil: +39.1% YoY. Food index: +3.0% YoY. Shelter inflation: +3.2% YoY (slowing from +3.3%). Peak inflation: 9.1% in June 2022 (highest in 40 years). 2025 annual average inflation: 2.6%. 2025 calendar year inflation (Dec-to-Dec): 2.7%. Fed funds rate (May 2026): 3.63% (down from peak of 5.33% in August 2023). Federal Reserve 2% inflation target (PCE). Philadelphia Fed Survey of Professional Forecasters Q2 2026: headline CPI 2026 = 3.5% Q4/Q4; core CPI 2026 = 2.9% Q4/Q4. 10-year average CPI forecast: 2.40% annually (SPF Q2 2026). Urban Honolulu, HI: highest local inflation at 5.6% (July 2026). Wealthvieu: bottom 50% of income earners experience inflation 0.5–1.5 percentage points above the headline CPI. $1 in 2020 is worth approximately $0.82 in purchasing power in 2026 (BLS CPI data).
This is the story of a disinflation in progress — an economy in which prices are still rising, but at a rate that is roughly a third of what it was at the peak in June 2022, when inflation hit 9.1 percent. The journey from 9.1 percent to 3.4 percent has been long, uneven, and painful for many households. The journey from 3.4 percent to the Federal Reserve’s 2 percent target will likely take longer than the journey so far.
This guide provides everything you need to understand US inflation in 2026: what it is, how it is measured, what caused it, what has reduced it, where it still bites hardest, how it affects different Americans differently, and what individuals can do to protect their finances from its continued effects.
Key Data: July 2026 Headline CPI: 3.4% YoY. Core CPI: 2.5% YoY. Monthly: +0.1% (MoM). CPI Index: 333.92. BLS Release: 12 August 2026.
The practical meaning of 3.4 percent inflation: a basket of goods and services that cost $1,000 in July 2025 costs approximately $1,034 in July 2026. For households spending $5,000 per month, a 3.4 percent inflation rate translates to approximately $170 more per month in spending required to maintain the same standard of living — $2,040 more per year, without any improvement in what is consumed.
Inflation is not a single price rising. It is an average across hundreds of categories. Some prices — gasoline, fuel oil — are rising far faster than the 3.4 percent headline. Others, particularly core goods, have moderated significantly or even fallen. The headline figure conceals an internal landscape of winners and losers within the household budget.
Core CPI vs. Headline CPI
Headline CPI measures price changes across all items in the basket, including food and energy. Core CPI strips out food and energy because these categories are particularly volatile — driven by weather events, geopolitical shocks, and seasonal patterns that do not reflect underlying inflationary pressure. Core CPI is therefore considered a better signal of persistent inflation trends. In July 2026, headline CPI is 3.4 percent while core CPI is 2.5 percent; the gap of 0.9 percentage points reflects the contribution of elevated energy prices (particularly gasoline and fuel oil related to the Iran conflict energy shock) to headline inflation.
Wealthvieu, May 2026: The Federal Reserve targets 2% annual inflation as the sweet spot — enough to encourage spending and investment without eroding living standards too quickly.
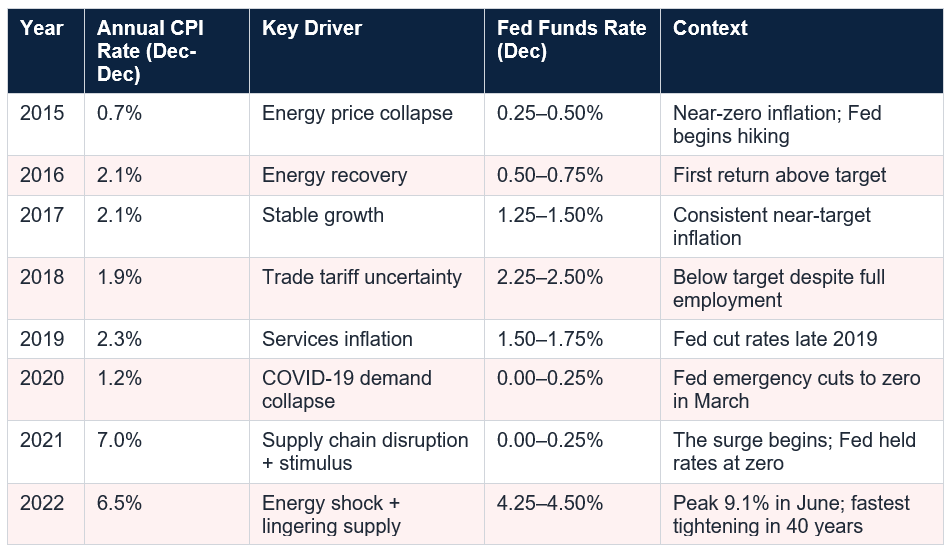
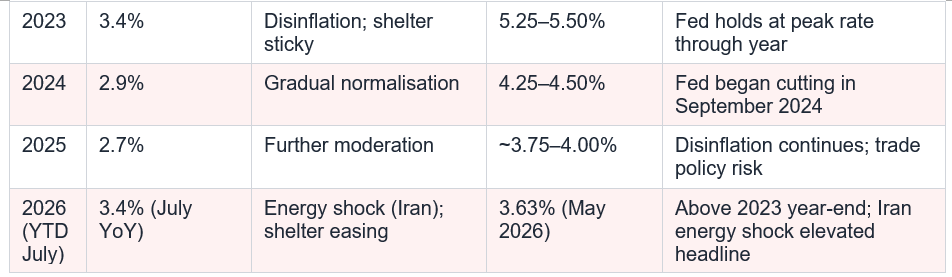
The timeline reveals the most important fact about US inflation in 2026: the rate in July 2026 (3.4 percent) is actually higher than the year-end 2023 rate (3.4 percent) and the year-end 2024 rate (2.9 percent) and 2025 year-end rate (2.7 percent). The disinflation that had progressed steadily through 2024 and 2025 was interrupted in 2026 by an energy shock related to the US-Iran conflict, which pushed gasoline prices up 24.6 percent and fuel oil prices up 39.1 percent year-over-year. Without this energy shock, the underlying inflation trajectory would likely have reached the Fed’s 2 percent PCE target by early 2026.
Higher interest rates reduced inflation through several channels: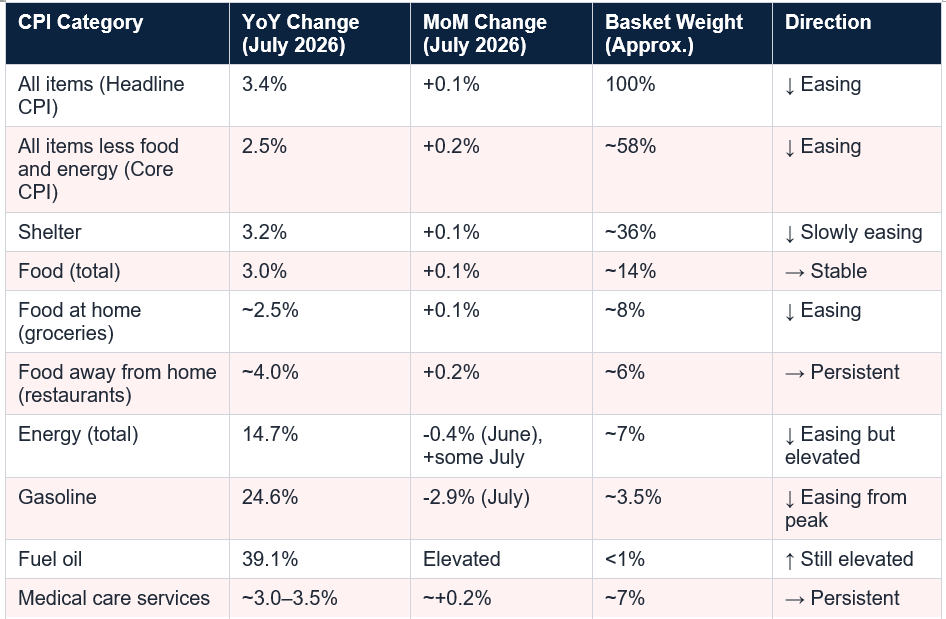
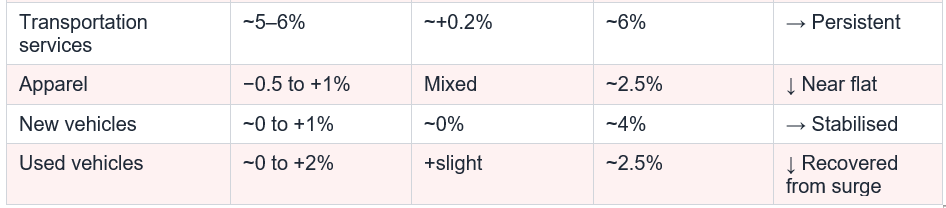
Why shelter inflation is so slow to fall: the CPI shelter measure tracks rent changes on existing leases, including long-term tenants whose rents are re-set infrequently. Real-time rent indices (such as Apartment List and Zillow observed rent indices) have been running at or near 0 percent for over a year — meaning new leases are not more expensive than a year ago in most markets. But the CPI shelter measure incorporates this market signal with a lag of 12 to 18 months. The pipeline of lower rent readings from real-time market data is still working its way into the official CPI measure in 2026.
The implication: shelter inflation will continue to ease through the rest of 2026 and into 2027, as the slower-moving CPI measure catches up with what the real-time market data has been showing for over a year. This is one of the most predictable pieces of the inflation outlook, and it supports forecasters’ expectation that headline and core CPI will continue to fall toward the Fed’s target range.
What This Means For You: If you’re renting and due for a renewal in late 2026, check real-time rent indices for your market before accepting your landlord’s proposed renewal price. In many markets, real-time rents have been flat for over a year, meaning comparable units are available at or below your current rent.
The positive signal from the July data: gasoline prices fell 2.9 percent on a monthly basis in July, suggesting the peak of the Iran-related energy shock has passed. If this pattern continues through August and September, energy will begin to subtract from rather than add to the headline inflation rate, pulling the 3.4 percent headline figure meaningfully lower.
Key Data: Energy inflation July 2026: +14.7% YoY. Gasoline: +24.6% YoY but -2.9% in July (MoM). Fuel oil: +39.1% YoY. Monthly CPI: +0.1% (energy-related monthly decline offsets other increases).
The practical grocery reality: although grocery inflation is running at approximately 2.5 percent year-over-year, this is on top of cumulative grocery inflation of approximately 25 percent since 2020. A weekly grocery bill of $200 in 2019 now requires approximately $250 to $260 to purchase the same basket of goods. The year-over-year rate is moderating, but the cumulative price increase has not reversed and is not expected to reverse — prices return to normal growth rates, not normal price levels.
Geographic Location
USAFacts July 2026 data shows that the Urban Honolulu, Hawaii Metro Area had the highest local inflation rate at 5.6 percent year-over-year — 64 percent above the national average. Geographic variation in inflation is driven by local housing markets, local energy prices, and regional economic conditions. A worker in Houston (a major energy-producing city) faces different energy price dynamics than a worker in New England, where home heating oil (fuel oil +39.1 percent YoY) is a primary heating fuel.
What This Means For You: The official CPI headline rate is not your personal inflation rate. Calculate your personal inflation by tracking your own spending categories and comparing your year-on-year spending in food, housing, energy, and other major categories.
The federal funds rate is the interest rate at which banks lend to each other overnight. When the Fed raises this rate, the cost of borrowing flows through to consumers (in credit card rates, mortgage rates, auto loan rates, and business loan rates), reducing purchasing power and slowing the economy.
The specific transmission channels:
The FOMC’s March 2026 projections set the context for where rates are headed. The March meeting projections indicated continued gradual easing, with the longer-run neutral rate assessed at approximately 3 percent. The Philadelphia Fed’s Q2 2026 Survey of Professional Forecasters, conducted with a broad panel of professional economic forecasters, projects headline CPI at 3.5 percent Q4/Q4 in 2026 and 10-year annual-average CPI inflation of 2.40 percent — suggesting the market expects inflation to return broadly to near-target levels over the medium term, even if 2026 remains above target due to energy.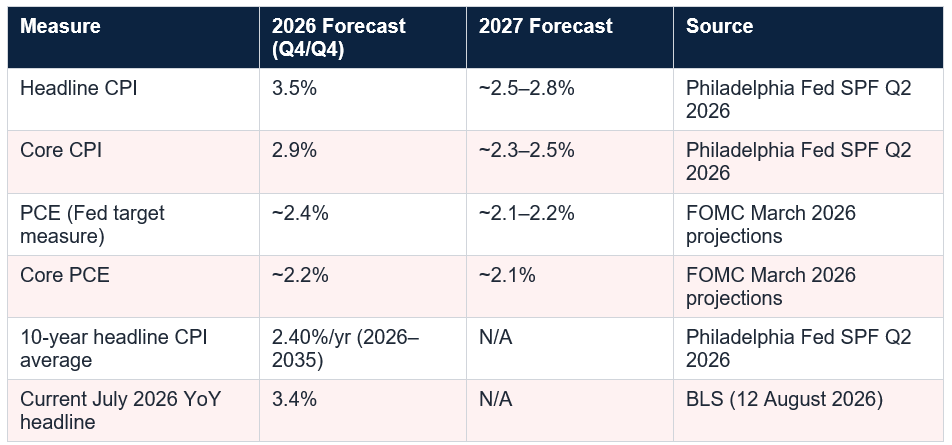
The forecaster consensus points to a 2026 where headline inflation remains elevated by energy (3.4 to 3.5 percent for the year) but core inflation continues its gradual descent toward the Fed’s 2 percent target. The 10-year forecast of 2.40 percent annual CPI — just above the Fed’s implicit CPI target, which is approximately 2.4 to 2.5 percent (equivalent to 2 percent PCE) — suggests the market believes inflation returns to near-normal over the medium term.
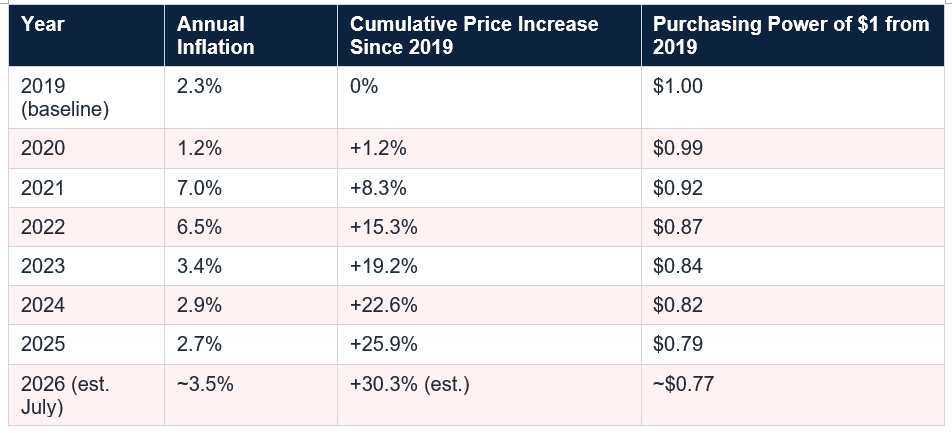
The cumulative purchasing power column tells the real story of the inflation cycle. A dollar that bought $1.00 of goods and services in 2019 buys approximately $0.77 worth in 2026 — a 23 percent reduction in purchasing power in seven years. This is the accumulated weight that households have been carrying even as the year-over-year rate has fallen from 9.1 percent to 3.4 percent. The disinflation is real. The cumulative damage is also real, and prices do not return to 2019 levels when inflation falls — they simply rise more slowly from the elevated base.
What This Means For You: If your salary has not increased by approximately 30% since 2019, your real purchasing power has declined, even if nominal wages have risen. Use the BLS CPI inflation calculator at bls.gov to calculate exactly how much your salary would need to have grown to keep pace with cumulative inflation since any year you choose.
But the 2 percent target has not been reached. Core inflation at 2.5 percent is closer to target than headline inflation, and the shelter component is poised to decline further as real-time rent data filters through the official measure. Energy is the wild card: the Iran-related energy shock that pushed headline inflation above where it otherwise would have been in early 2026 is showing early signs of easing — gasoline prices fell 2.9 percent on a monthly basis in July 2026 — but remains elevated in year-over-year terms.
For households, the most important context is the cumulative one. The 3.4 percent year-over-year figure describes the pace of inflation today. The 30 percent cumulative price increase since 2019 describes the distance already travelled. Inflation returning to 2 percent does not restore the purchasing power that 2021 and 2022 destroyed. It simply stops destroying more at an accelerated rate. The household budget strategies and investment approaches that protect against inflation remain relevant even as the headline number continues its gradual descent toward the Fed’s target.
The annual headline CPI inflation rate for the United States was 3.4 percent for the 12 months ending July 2026, according to the Bureau of Labor Statistics report released on 12 August 2026. This is down from 3.5 percent in the 12 months ending June. Core inflation (all items less food and energy) was 2.5 percent year-over-year, easing from 2.6 percent in June. On a monthly basis, the CPI rose 0.1 percent in July, rebounding from a 0.4 percent decline in June.
What is the Federal Reserve’s inflation target?
The Federal Reserve targets 2 percent inflation as measured by the PCE (Personal Consumption Expenditures) price index, not the CPI. The PCE tends to run 0.3 to 0.5 percentage points below the CPI, so the Fed’s 2 percent PCE target is approximately equivalent to 2.3 to 2.5 percent on the CPI. By this measure, core PCE inflation in mid-2026 is running at approximately 2.2 to 2.4 percent — still above the Fed’s target but considerably closer than the headline CPI figure suggests.
What is causing energy inflation to be so high in 2026?
Energy inflation in 2026 is primarily driven by the conflict with Iran, which disrupted global oil supply and caused gasoline prices to rise 24.6 percent and fuel oil prices to rise 39.1 percent year-over-year as of July 2026. This energy shock is responsible for much of the difference between headline CPI (3.4 percent) and core CPI (2.5 percent) in 2026. The July data showed the first signs of easing, with gasoline prices falling 2.9 percent on a monthly basis in July.
What is the difference between CPI and PCE?
CPI (Consumer Price Index) is published by the Bureau of Labor Statistics and tracks a fixed basket of goods and services representing approximately 90 percent of the US population. PCE (Personal Consumption Expenditures) is published by the Bureau of Economic Analysis and is broader, using different weighting methods that better capture how consumers substitute between products as prices change. PCE typically runs 0.3 to 0.5 percentage points below CPI. The Federal Reserve uses PCE as its official inflation target measure, while CPI is more widely reported in media.
How has inflation damaged purchasing power since 2020?
Cumulative inflation from 2020 to mid-2026 has reduced the purchasing power of the dollar by approximately 23 to 25 percent. A basket of goods and services that cost $1.00 in 2019 costs approximately $1.30 in 2026. A worker whose salary has not grown by approximately 30 percent since 2019 has experienced a real wage decline, even if their nominal pay has increased. The BLS CPI inflation calculator at bls.gov allows individuals to calculate exactly how much their purchasing power has changed between any two dates.
What is core inflation and why does it matter?
Core inflation measures price changes for all items in the CPI basket except food and energy, which are excluded because they are particularly volatile. Core CPI is considered a better signal of underlying, persistent inflation trends because it filters out the temporary spikes and drops caused by commodity price movements, weather events, and geopolitical shocks. The Federal Reserve focuses on core inflation when assessing whether its policy is effectively controlling prices. Core CPI in July 2026 was 2.5 percent — meaningfully below the headline rate of 3.4 percent, with the gap explained by energy price elevation.
What can I do to protect my finances from inflation?
Key strategies include: investing in assets that historically outpace inflation (equity index funds have averaged 7 to 10 percent annually); purchasing Treasury Inflation-Protected Securities (TIPS) or I Bonds from TreasuryDirect.gov, which are specifically designed to provide returns above the CPI; locking in fixed-rate debt (particularly mortgages) which is eroded in real value by inflation; reviewing and negotiating salary annually with reference to current inflation data; and eliminating high-interest consumer debt, whose real cost is compounded by inflation eroding both income and savings.
Table of Contents
- Where Inflation Stands Right Now
- What Is Inflation? A Plain-English Definition
- How Inflation Is Measured: CPI, PCE, and Core vs. Headline
- The US Inflation Timeline: A Decade in Numbers (with Chart)
- What Caused the 2021–2022 Inflation Surge?
- What Has Brought Inflation Down?
- Where Inflation Still Bites: Category-by-Category Breakdown
- Shelter Inflation: The Stickiest Problem
- Energy Inflation: The Iran War Effect
- Food Inflation: 3% and Holding
- Who Suffers Most? The Unequal Distribution of Inflation
- How the Federal Reserve Fights Inflation
- Current Fed Policy and the 2026 Rate Environment
- What the Forecasters Are Saying for 2026 and 2027
- How Inflation Erodes Purchasing Power Over Time
- How to Protect Yourself from Inflation
- Conclusion: Lower, But Not Gone
- Frequently Asked Questions
Where Inflation Stands Right Now
The Bureau of Labor Statistics released its Consumer Price Index report for July 2026 on 12 August 2026. The headline number: inflation is running at 3.4 percent year-over-year, down from 3.5 percent in June. Core inflation — which strips out the volatile food and energy categories — came in at 2.5 percent, also easing from 2.6 percent in June. Monthly price movement was virtually flat: the CPI index fell fractionally from 333.95 in June to 333.92 in July.This is the story of a disinflation in progress — an economy in which prices are still rising, but at a rate that is roughly a third of what it was at the peak in June 2022, when inflation hit 9.1 percent. The journey from 9.1 percent to 3.4 percent has been long, uneven, and painful for many households. The journey from 3.4 percent to the Federal Reserve’s 2 percent target will likely take longer than the journey so far.
This guide provides everything you need to understand US inflation in 2026: what it is, how it is measured, what caused it, what has reduced it, where it still bites hardest, how it affects different Americans differently, and what individuals can do to protect their finances from its continued effects.
Key Data: July 2026 Headline CPI: 3.4% YoY. Core CPI: 2.5% YoY. Monthly: +0.1% (MoM). CPI Index: 333.92. BLS Release: 12 August 2026.
What Is Inflation? A Plain-English Definition
Inflation is the rate at which the general level of prices for goods and services rises over time. When inflation is positive, each dollar you hold buys a little less than it did the year before. When inflation is negative (deflation), prices are falling — which sounds attractive but can signal dangerous economic contraction, which is why central banks generally aim to avoid it.The practical meaning of 3.4 percent inflation: a basket of goods and services that cost $1,000 in July 2025 costs approximately $1,034 in July 2026. For households spending $5,000 per month, a 3.4 percent inflation rate translates to approximately $170 more per month in spending required to maintain the same standard of living — $2,040 more per year, without any improvement in what is consumed.
Inflation is not a single price rising. It is an average across hundreds of categories. Some prices — gasoline, fuel oil — are rising far faster than the 3.4 percent headline. Others, particularly core goods, have moderated significantly or even fallen. The headline figure conceals an internal landscape of winners and losers within the household budget.
How Inflation Is Measured: CPI, PCE, and Core vs. Headline
Consumer Price Index (CPI-U)
The CPI-U (Consumer Price Index for All Urban Consumers) is the most widely cited measure of US inflation. It is published monthly by the Bureau of Labor Statistics and tracks price changes in a fixed ‘basket’ of goods and services representing the spending patterns of approximately 90 percent of the US population. The basket includes categories for shelter, food, transportation, medical care, education, apparel, and recreation. Each category is weighted by its share of typical consumer spending: shelter is the largest single component at approximately 36 percent of the basket.Core CPI vs. Headline CPI
Headline CPI measures price changes across all items in the basket, including food and energy. Core CPI strips out food and energy because these categories are particularly volatile — driven by weather events, geopolitical shocks, and seasonal patterns that do not reflect underlying inflationary pressure. Core CPI is therefore considered a better signal of persistent inflation trends. In July 2026, headline CPI is 3.4 percent while core CPI is 2.5 percent; the gap of 0.9 percentage points reflects the contribution of elevated energy prices (particularly gasoline and fuel oil related to the Iran conflict energy shock) to headline inflation.
PCE (Personal Consumption Expenditures) Price Index
The Federal Reserve’s preferred inflation measure is not the CPI but the PCE, published monthly by the Bureau of Economic Analysis. The PCE is broader than the CPI, uses different weighting methods, and tends to run 0.3 to 0.5 percentage points below the CPI. The Fed’s 2 percent inflation target is stated in terms of PCE, not CPI. When Fed officials discuss whether inflation is near the 2 percent target, they are referring to PCE, not CPI. As of the most recent data, PCE inflation is running at approximately 2.2 to 2.4 percent — closer to target than headline CPI but still above it.Wealthvieu, May 2026: The Federal Reserve targets 2% annual inflation as the sweet spot — enough to encourage spending and investment without eroding living standards too quickly.
The US Inflation Timeline: A Decade in Numbers
The following table shows the annual headline CPI inflation rate by year, measured December-to-December. This data forms the basis of the interactive chart that accompanies this article.The timeline reveals the most important fact about US inflation in 2026: the rate in July 2026 (3.4 percent) is actually higher than the year-end 2023 rate (3.4 percent) and the year-end 2024 rate (2.9 percent) and 2025 year-end rate (2.7 percent). The disinflation that had progressed steadily through 2024 and 2025 was interrupted in 2026 by an energy shock related to the US-Iran conflict, which pushed gasoline prices up 24.6 percent and fuel oil prices up 39.1 percent year-over-year. Without this energy shock, the underlying inflation trajectory would likely have reached the Fed’s 2 percent PCE target by early 2026.
What Caused the 2021–2022 Inflation Surge?
The inflation surge of 2021 and 2022 — which took the headline rate from 1.2 percent in 2020 to a peak of 9.1 percent in June 2022 — was the product of multiple forces hitting the economy simultaneously in a way that had not occurred since the 1970s:Pandemic-Era Supply Chain Disruption
COVID-19 caused global manufacturing shutdowns, port closures, shipping container shortages, and factory closures that reduced the supply of goods at precisely the moment demand was recovering. Semiconductor shortages idled automobile production lines. Shipping costs increased tenfold. Consumer goods that had previously been reliably available at stable prices became scarce and expensive.Fiscal Stimulus
The federal government deployed approximately $6 trillion in pandemic relief spending between March 2020 and early 2021, including three rounds of direct stimulus payments. Combined with enhanced unemployment benefits, this produced the unusual phenomenon of household incomes rising during a severe recession, while the supply of goods and services contracted. Excess demand chasing reduced supply is the textbook condition for inflation.Energy and Food Commodity Shocks
Russia’s invasion of Ukraine in February 2022 removed a major global supplier of oil, natural gas, wheat, and fertiliser from global commodity markets. Energy prices surged, feeding directly into the CPI energy component and indirectly into food prices and the cost of producing virtually every other good and service.Housing Market Dynamics
Ultra-low mortgage rates during 2020 and 2021 stimulated extraordinary housing demand at a time when housing supply was constrained. Home prices rose 20 to 30 percent in many markets in 2021 alone, and rental costs followed with a lag of 12 to 18 months — entering the CPI shelter component and providing a persistent, slow-moving source of inflationary pressure that persisted long after goods inflation had moderated.What Has Brought Inflation Down?
The Federal Reserve’s response to the 2021-2022 inflation surge was the most aggressive monetary policy tightening in 40 years. The federal funds rate was raised from 0 percent in March 2022 to a peak of 5.25 to 5.50 percent by August 2023 — a 525 basis point increase in 17 months. The Fed held rates at this peak level until September 2024, when it began a gradual easing cycle. By May 2026, the rate had fallen to 3.63 percent.Higher interest rates reduced inflation through several channels:
- Demand destruction: higher borrowing costs reduced consumer spending on credit, mortgage activity, car purchases, and business investment. Lower demand meant less upward pressure on prices.
- Reduced money supply growth: the Fed simultaneously ran down its balance sheet (quantitative tightening), reducing the money supply that had expanded dramatically during the pandemic.
- Supply chain normalisation: independently of monetary policy, global supply chains recovered as pandemic disruptions eased. Semiconductor production increased. Shipping costs fell back toward historical levels. Goods deflation — falling prices for physical goods — was a major component of headline CPI decline in 2023 and 2024.
- Energy market stabilisation: after the initial Ukraine shock, energy markets gradually adjusted, moderating the energy component of inflation through 2023 and 2024 (though the Iran conflict in 2026 has re-elevated energy prices).
Where Inflation Still Bites: Category-by-Category Breakdown
Shelter Inflation: The Stickiest Problem
Shelter — which includes rent, owners’ equivalent rent (OER), and hotel prices — represents approximately 36 percent of the CPI basket. It is the single largest component of consumer prices and the most persistent source of above-target inflation in the current cycle. Shelter inflation came in at 3.2 percent in July 2026, down from 3.3 percent in June, accounting for roughly two-thirds of the monthly CPI increase.Why shelter inflation is so slow to fall: the CPI shelter measure tracks rent changes on existing leases, including long-term tenants whose rents are re-set infrequently. Real-time rent indices (such as Apartment List and Zillow observed rent indices) have been running at or near 0 percent for over a year — meaning new leases are not more expensive than a year ago in most markets. But the CPI shelter measure incorporates this market signal with a lag of 12 to 18 months. The pipeline of lower rent readings from real-time market data is still working its way into the official CPI measure in 2026.
The implication: shelter inflation will continue to ease through the rest of 2026 and into 2027, as the slower-moving CPI measure catches up with what the real-time market data has been showing for over a year. This is one of the most predictable pieces of the inflation outlook, and it supports forecasters’ expectation that headline and core CPI will continue to fall toward the Fed’s target range.
What This Means For You: If you’re renting and due for a renewal in late 2026, check real-time rent indices for your market before accepting your landlord’s proposed renewal price. In many markets, real-time rents have been flat for over a year, meaning comparable units are available at or below your current rent.
Energy Inflation: The Iran War Effect
The single largest contributor to US headline inflation running above its 2024 and 2025 levels in 2026 is energy. Gasoline prices rose 24.6 percent year-over-year in July 2026, fuel oil prices rose 39.1 percent, and the total energy index rose 14.7 percent. As Trading Economics’ analysis notes, inflation moved further below the 2023 high of 4.2 percent as the impact of the energy shock caused by the war with Iran continued to ease — gasoline prices rose 24.6 percent in July, down from 26.7 percent in June.The positive signal from the July data: gasoline prices fell 2.9 percent on a monthly basis in July, suggesting the peak of the Iran-related energy shock has passed. If this pattern continues through August and September, energy will begin to subtract from rather than add to the headline inflation rate, pulling the 3.4 percent headline figure meaningfully lower.
Key Data: Energy inflation July 2026: +14.7% YoY. Gasoline: +24.6% YoY but -2.9% in July (MoM). Fuel oil: +39.1% YoY. Monthly CPI: +0.1% (energy-related monthly decline offsets other increases).
Food Inflation: 3% and Holding
Food inflation came in at 3.0 percent year-over-year in July 2026, unchanged from June. Within food, the two sub-categories tell different stories. Food at home (groceries) is running at approximately 2.5 percent — near the overall core inflation rate and consistent with the gradual return toward normal price levels after the extraordinary grocery inflation of 2021 to 2023. Food away from home (restaurants and fast food) is running closer to 4 percent, reflecting the stickiness of labour costs in food service, which remain elevated even as broader wage growth has moderated.The practical grocery reality: although grocery inflation is running at approximately 2.5 percent year-over-year, this is on top of cumulative grocery inflation of approximately 25 percent since 2020. A weekly grocery bill of $200 in 2019 now requires approximately $250 to $260 to purchase the same basket of goods. The year-over-year rate is moderating, but the cumulative price increase has not reversed and is not expected to reverse — prices return to normal growth rates, not normal price levels.
Who Suffers Most? The Unequal Distribution of Inflation
The headline inflation rate is an average. It conceals very significant variation in the inflation experience of different households. Three dimensions of this inequality are particularly important:Income Level
Lower-income households spend a larger proportion of their income on the categories that have inflated most severely: food, energy, and shelter. They spend a smaller proportion on the categories that have moderated or deflated: core goods, technology, and services where prices have stabilised. The Wealthvieu May 2026 analysis states explicitly: if you are in the bottom 50 percent of income earners, the inflation rate you personally experience is likely 0.5 to 1.5 percentage points higher than the headline CPI number. This means that while the BLS reports 3.4 percent headline CPI, a lower-income household in a city with high energy costs and still-elevated rents may be experiencing effective inflation of 4 to 5 percent on their actual spending basket.Geographic Location
USAFacts July 2026 data shows that the Urban Honolulu, Hawaii Metro Area had the highest local inflation rate at 5.6 percent year-over-year — 64 percent above the national average. Geographic variation in inflation is driven by local housing markets, local energy prices, and regional economic conditions. A worker in Houston (a major energy-producing city) faces different energy price dynamics than a worker in New England, where home heating oil (fuel oil +39.1 percent YoY) is a primary heating fuel.
Renters vs. Homeowners
Homeowners who locked in a fixed-rate mortgage at 3 to 4 percent before 2022 have seen their single largest housing cost remain constant while rents for comparable properties have risen 25 to 40 percent since 2020. Renters, particularly those who have moved to new leases at market rates, have faced housing cost increases that dwarf the official shelter inflation figures for long-term residents.What This Means For You: The official CPI headline rate is not your personal inflation rate. Calculate your personal inflation by tracking your own spending categories and comparing your year-on-year spending in food, housing, energy, and other major categories.
How the Federal Reserve Fights Inflation
The Federal Reserve has two tools to fight inflation: the federal funds rate (interest rate policy) and its balance sheet (asset purchase and reduction programmes). Both work through the same fundamental mechanism: making credit more expensive, which reduces borrowing, spending, and ultimately demand, cooling upward price pressure.The federal funds rate is the interest rate at which banks lend to each other overnight. When the Fed raises this rate, the cost of borrowing flows through to consumers (in credit card rates, mortgage rates, auto loan rates, and business loan rates), reducing purchasing power and slowing the economy.
The specific transmission channels:
- Housing: higher mortgage rates reduce housing demand, cooling house price appreciation and eventually shelter inflation.
- Consumer credit: higher credit card and auto loan rates reduce consumer spending on credit-financed goods.
- Business investment: higher borrowing costs reduce business investment, slowing capacity expansion and job creation.
- Currency appreciation: higher US interest rates attract foreign capital, strengthening the dollar and making imports cheaper, which directly reduces inflation through lower import prices.
Current Fed Policy and the 2026 Rate Environment
The Federal Reserve’s rate-setting body, the Federal Open Market Committee (FOMC), began cutting rates in September 2024 after holding at the 5.25 to 5.50 percent peak for over a year. By May 2026, the federal funds rate stood at 3.63 percent — down 170 basis points from the peak but still significantly above the pre-pandemic range of 0 to 2.50 percent.The FOMC’s March 2026 projections set the context for where rates are headed. The March meeting projections indicated continued gradual easing, with the longer-run neutral rate assessed at approximately 3 percent. The Philadelphia Fed’s Q2 2026 Survey of Professional Forecasters, conducted with a broad panel of professional economic forecasters, projects headline CPI at 3.5 percent Q4/Q4 in 2026 and 10-year annual-average CPI inflation of 2.40 percent — suggesting the market expects inflation to return broadly to near-target levels over the medium term, even if 2026 remains above target due to energy.
What the Forecasters Are Saying for 2026 and 2027
The forecaster consensus points to a 2026 where headline inflation remains elevated by energy (3.4 to 3.5 percent for the year) but core inflation continues its gradual descent toward the Fed’s 2 percent target. The 10-year forecast of 2.40 percent annual CPI — just above the Fed’s implicit CPI target, which is approximately 2.4 to 2.5 percent (equivalent to 2 percent PCE) — suggests the market believes inflation returns to near-normal over the medium term.
How Inflation Erodes Purchasing Power Over Time
The cumulative impact of inflation since 2020 is perhaps the most important and least discussed dimension of the US inflation story. The year-over-year rate of 3.4 percent describes the current pace of price increase. It does not describe the cumulative damage to purchasing power from six years of above-target inflation.The cumulative purchasing power column tells the real story of the inflation cycle. A dollar that bought $1.00 of goods and services in 2019 buys approximately $0.77 worth in 2026 — a 23 percent reduction in purchasing power in seven years. This is the accumulated weight that households have been carrying even as the year-over-year rate has fallen from 9.1 percent to 3.4 percent. The disinflation is real. The cumulative damage is also real, and prices do not return to 2019 levels when inflation falls — they simply rise more slowly from the elevated base.
What This Means For You: If your salary has not increased by approximately 30% since 2019, your real purchasing power has declined, even if nominal wages have risen. Use the BLS CPI inflation calculator at bls.gov to calculate exactly how much your salary would need to have grown to keep pace with cumulative inflation since any year you choose.
How to Protect Yourself from Inflation
While monetary and fiscal policy determines the aggregate inflation rate, individual households can take specific steps to reduce their vulnerability to above-target inflation:Financial Strategies
- Invest in assets that historically outpace inflation: equity investments (stocks, equity index funds) have historically delivered returns of 7 to 10 percent annually in nominal terms — above most historical inflation rates. Bonds, particularly longer-duration bonds, can lose real value when inflation is high, but short-term Treasury bills currently yield approximately 4 to 5 percent, providing a positive real return at current inflation levels.
- • Treasury Inflation-Protected Securities (TIPS): TIPS are US government bonds whose principal adjusts with inflation. They provide a guaranteed real return above the CPI, making them specifically designed as inflation protection. Available directly from the US Treasury at TreasuryDirect.gov.
- • I Bonds: US Series I Savings Bonds carry an interest rate composed of a fixed rate plus a CPI adjustment, providing direct inflation linkage. They are available in limited quantities (up to $10,000 per year per person) at TreasuryDirect.gov.
- • Real estate (owned): homeownership in a supply-constrained market provides an inflation hedge because property values and replacement costs tend to rise with inflation over time. Mortgage debt, particularly fixed-rate debt, is effectively eroded in real value by inflation.
Practical Household Strategies
- • Lock in fixed costs where possible: fixed-rate mortgages, long-term utility contracts, and stable-rate insurances protect against future price increases in these categories.
- • Review subscriptions and recurring costs: inflation makes the real cost of unchanged subscriptions cheaper over time if nominal prices are fixed, but many service providers raise prices annually. Audit recurring costs annually.
- • Negotiate salary at least annually: because inflation compounds, allowing a salary to remain static for two or three years produces a meaningful real wage cut. Annual salary reviews with reference to current inflation data strengthen the case for regular increases.
- • Reduce high-interest consumer debt: with the Fed funds rate at 3.63 percent, credit card rates remain in the 20 to 25 percent range for most borrowers — a guaranteed negative real return that is only worsened by inflation.
Conclusion
US inflation in August 2026 is a story of progress constrained by a new shock. The headline rate of 3.4 percent is dramatically lower than the 9.1 percent peak of June 2022. The forces that drove the original surge — supply chain disruption, excess stimulus, commodity shocks — have largely resolved. The Federal Reserve’s 525 basis point rate hiking cycle has worked as intended, slowing demand and cooling price pressures across most of the CPI basket.But the 2 percent target has not been reached. Core inflation at 2.5 percent is closer to target than headline inflation, and the shelter component is poised to decline further as real-time rent data filters through the official measure. Energy is the wild card: the Iran-related energy shock that pushed headline inflation above where it otherwise would have been in early 2026 is showing early signs of easing — gasoline prices fell 2.9 percent on a monthly basis in July 2026 — but remains elevated in year-over-year terms.
For households, the most important context is the cumulative one. The 3.4 percent year-over-year figure describes the pace of inflation today. The 30 percent cumulative price increase since 2019 describes the distance already travelled. Inflation returning to 2 percent does not restore the purchasing power that 2021 and 2022 destroyed. It simply stops destroying more at an accelerated rate. The household budget strategies and investment approaches that protect against inflation remain relevant even as the headline number continues its gradual descent toward the Fed’s target.
Frequently Asked Questions
What is the current US inflation rate?The annual headline CPI inflation rate for the United States was 3.4 percent for the 12 months ending July 2026, according to the Bureau of Labor Statistics report released on 12 August 2026. This is down from 3.5 percent in the 12 months ending June. Core inflation (all items less food and energy) was 2.5 percent year-over-year, easing from 2.6 percent in June. On a monthly basis, the CPI rose 0.1 percent in July, rebounding from a 0.4 percent decline in June.
What is the Federal Reserve’s inflation target?
The Federal Reserve targets 2 percent inflation as measured by the PCE (Personal Consumption Expenditures) price index, not the CPI. The PCE tends to run 0.3 to 0.5 percentage points below the CPI, so the Fed’s 2 percent PCE target is approximately equivalent to 2.3 to 2.5 percent on the CPI. By this measure, core PCE inflation in mid-2026 is running at approximately 2.2 to 2.4 percent — still above the Fed’s target but considerably closer than the headline CPI figure suggests.
What is causing energy inflation to be so high in 2026?
Energy inflation in 2026 is primarily driven by the conflict with Iran, which disrupted global oil supply and caused gasoline prices to rise 24.6 percent and fuel oil prices to rise 39.1 percent year-over-year as of July 2026. This energy shock is responsible for much of the difference between headline CPI (3.4 percent) and core CPI (2.5 percent) in 2026. The July data showed the first signs of easing, with gasoline prices falling 2.9 percent on a monthly basis in July.
What is the difference between CPI and PCE?
CPI (Consumer Price Index) is published by the Bureau of Labor Statistics and tracks a fixed basket of goods and services representing approximately 90 percent of the US population. PCE (Personal Consumption Expenditures) is published by the Bureau of Economic Analysis and is broader, using different weighting methods that better capture how consumers substitute between products as prices change. PCE typically runs 0.3 to 0.5 percentage points below CPI. The Federal Reserve uses PCE as its official inflation target measure, while CPI is more widely reported in media.
How has inflation damaged purchasing power since 2020?
Cumulative inflation from 2020 to mid-2026 has reduced the purchasing power of the dollar by approximately 23 to 25 percent. A basket of goods and services that cost $1.00 in 2019 costs approximately $1.30 in 2026. A worker whose salary has not grown by approximately 30 percent since 2019 has experienced a real wage decline, even if their nominal pay has increased. The BLS CPI inflation calculator at bls.gov allows individuals to calculate exactly how much their purchasing power has changed between any two dates.
What is core inflation and why does it matter?
Core inflation measures price changes for all items in the CPI basket except food and energy, which are excluded because they are particularly volatile. Core CPI is considered a better signal of underlying, persistent inflation trends because it filters out the temporary spikes and drops caused by commodity price movements, weather events, and geopolitical shocks. The Federal Reserve focuses on core inflation when assessing whether its policy is effectively controlling prices. Core CPI in July 2026 was 2.5 percent — meaningfully below the headline rate of 3.4 percent, with the gap explained by energy price elevation.
What can I do to protect my finances from inflation?
Key strategies include: investing in assets that historically outpace inflation (equity index funds have averaged 7 to 10 percent annually); purchasing Treasury Inflation-Protected Securities (TIPS) or I Bonds from TreasuryDirect.gov, which are specifically designed to provide returns above the CPI; locking in fixed-rate debt (particularly mortgages) which is eroded in real value by inflation; reviewing and negotiating salary annually with reference to current inflation data; and eliminating high-interest consumer debt, whose real cost is compounded by inflation eroding both income and savings.
0 Comments
Be the first to share your thoughts on this article.