

Credits
The UK Debt Map 2026: What Every Region Really Owes

Table of Contents
- At a Glance by Nation and Region
- Introduction: £2 Trillion and Rising
- The National Snapshot: UK Debt by the Numbers
- UK Debt by Type: What the £2 Trillion Is Made Of
- The Four Nations: England, Scotland, Wales, and Northern Ireland
- England: The Full Regional Spectrum
- Scotland: Protected Trust Deeds and Rising Insolvency
- Wales: The Post-Industrial Debt Burden
- 🇮🇹 Northern Ireland: Rising Fast From a Lower Base
- The Full Regional Debt Map: Data Across All UK Nations and Regions
- The Stress Signals: Where the UK Debt Map Shows Acute Pressure
- Conclusion: £2 Trillion, Four Nations, One Direction
- Frequently Asked Questions (FAQ)
At a Glance by Nation and Region
Before the data tables and deep dives, here is the UK debt map in summary form -- each nation and major region with its headline debt and insolvency figure: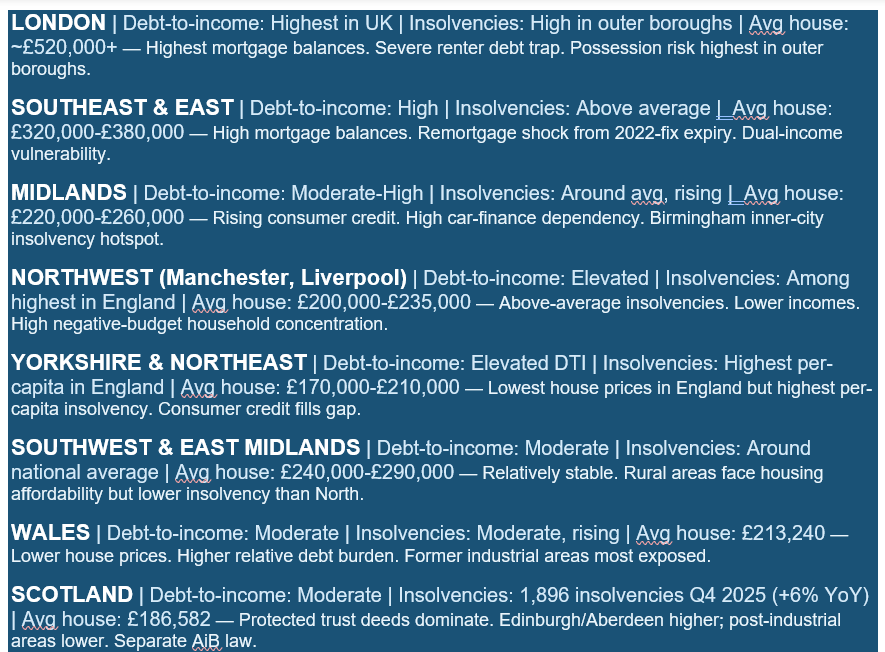

Introduction: £2 Trillion and Rising
UK households collectively owe approximately £2 trillion in mortgage and consumer credit debt, according to Bank of England data current to Q1/April 2026. That figure -- £1,746 billion in mortgage debt and £253 billion in consumer credit -- works out at an average of approximately £70,000 per household across the UK's 28.4 million households (Richify, May 29, 2026). Add the £270 billion in student loan debt held outside the main Bank of England measures, and the true total of obligations on UK household balance sheets exceeds £2.3 trillion.The trajectory is stark. TrySnowball (February 2026): 'UK households owed £1,899.7 billion at the end of March 2025, up £54.3 billion from the year before -- an extra £1,002 per adult in a single year.' Non-mortgage household debt has doubled in a decade, rising 98% to £18,392 per household. The Office for Budget Responsibility forecasts total household debt hitting £2,927 billion by 2030. The individual insolvency picture is the clearest signal of system stress: House of Commons Library (published 1 week ago) records 35,143 individual insolvencies in England and Wales in Q1 2026, 20.4% higher than Q1 2025 and continuing a trend that made 2025 the worst insolvency year since 2010.
The debt map is not uniform. The pressures are different in London versus Yorkshire, in Scotland versus Northern Ireland, in households with large mortgages versus households with no mortgage but high credit card balances. This guide maps the full picture: the national statistics, the four-nations breakdown, the regional insolvency hotspots, the debt-type composition, and the stress signals embedded in the most current available data.
The National Snapshot: UK Debt by the Numbers
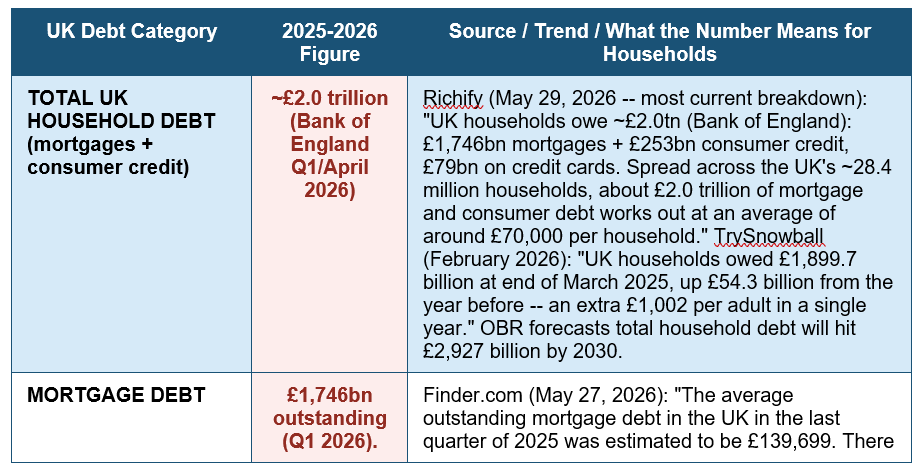
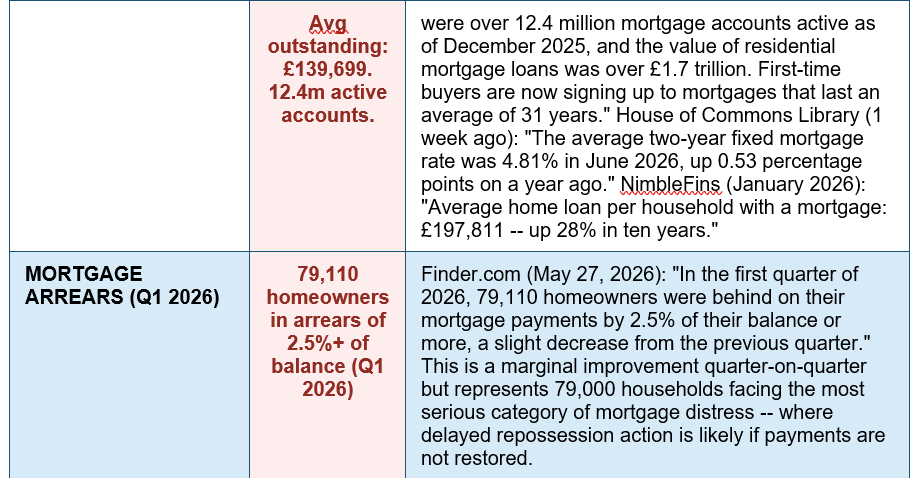
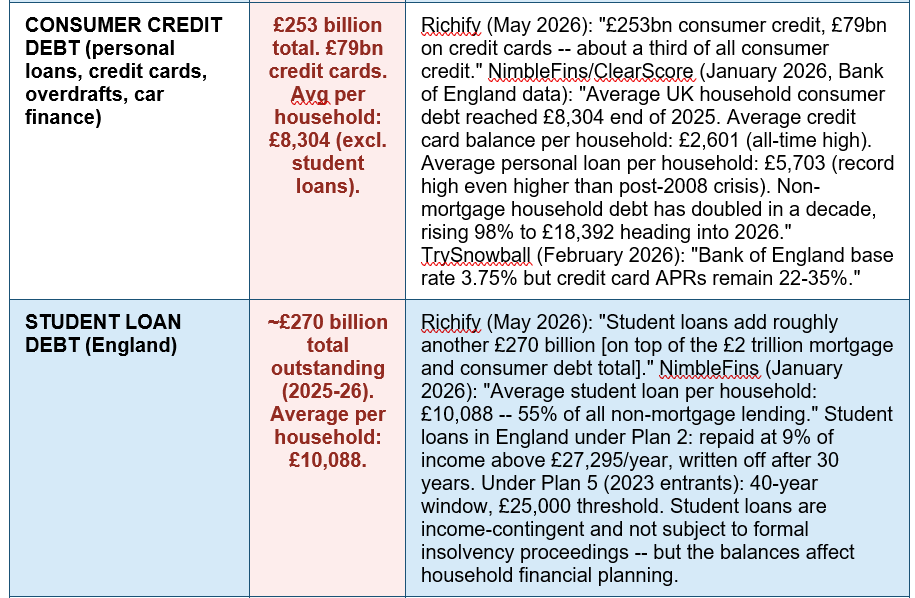
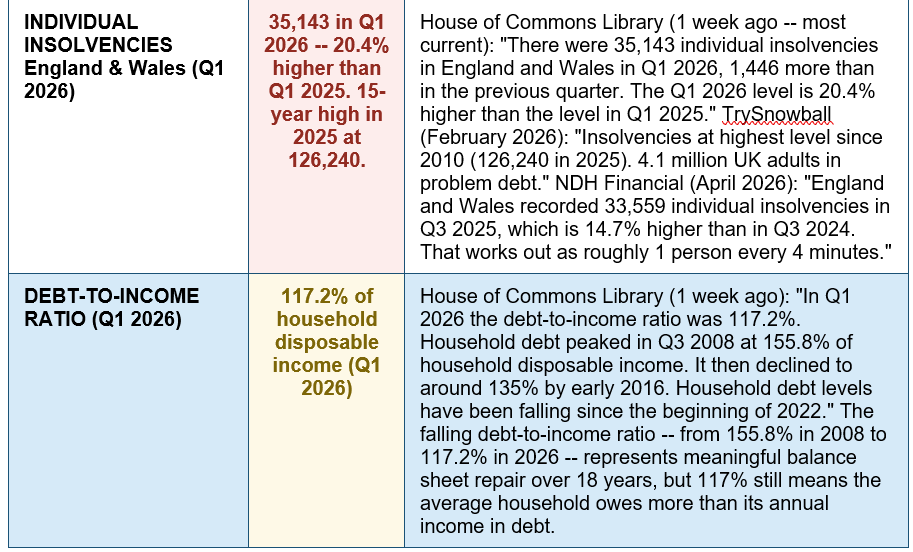
UK debt 2026 -- the national numbers: ~£2tn total. 117.2% debt-to-income ratio. 35,143 insolvencies Q1 2026 (+20.4%). £197,811 avg mortgage. £8,304 avg consumer debt. — House of Commons Library (1 week ago -- most current official indicators): '35,143 individual insolvencies England & Wales Q1 2026, 20.4% higher than Q1 2025. Debt-to-income ratio 117.2% Q1 2026. Two-year fixed mortgage rate 4.81% June 2026.' Richify (May 2026): '~£2.0tn total household debt. £1,746bn mortgages + £253bn consumer credit. £70,000 average per household.' TrySnowball (February 2026): 'Non-mortgage debt doubled in decade to £18,392. OBR forecasts £2,927bn by 2030. £1,002 extra per adult in one year.'
UK Debt by Type: What the £2 Trillion Is Made Of
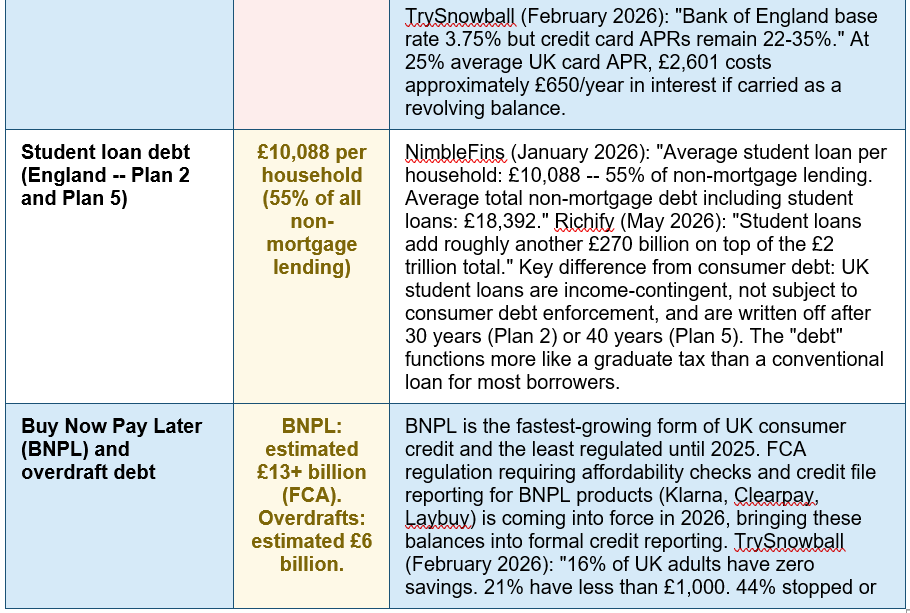
The composition of UK household debt differs significantly from the US pattern -- student loans are governed by very different rules, and the dominance of mortgage debt is even more pronounced: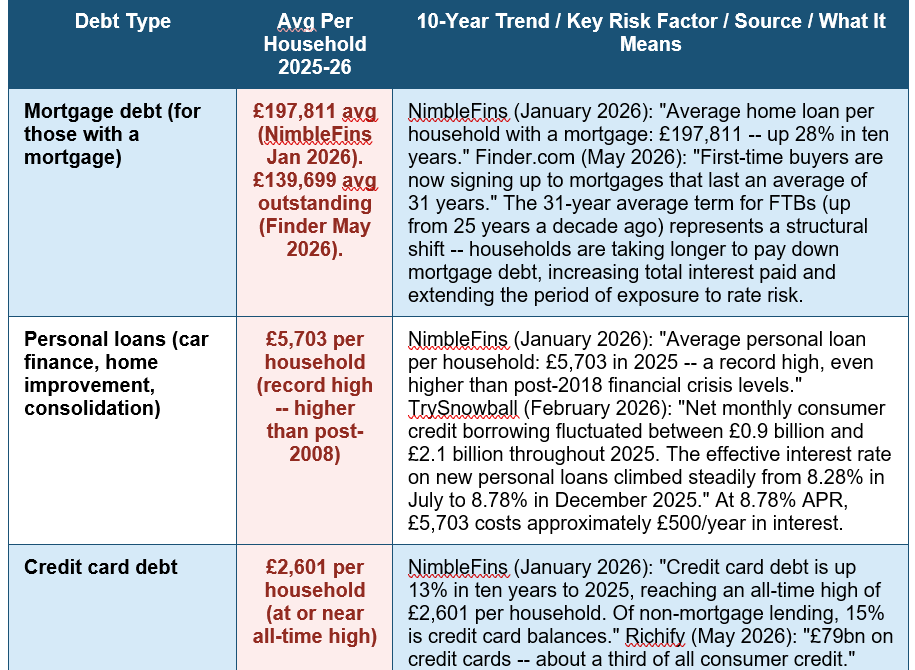

The Four Nations: England, Scotland, Wales, and Northern Ireland
England: The Full Regional Spectrum
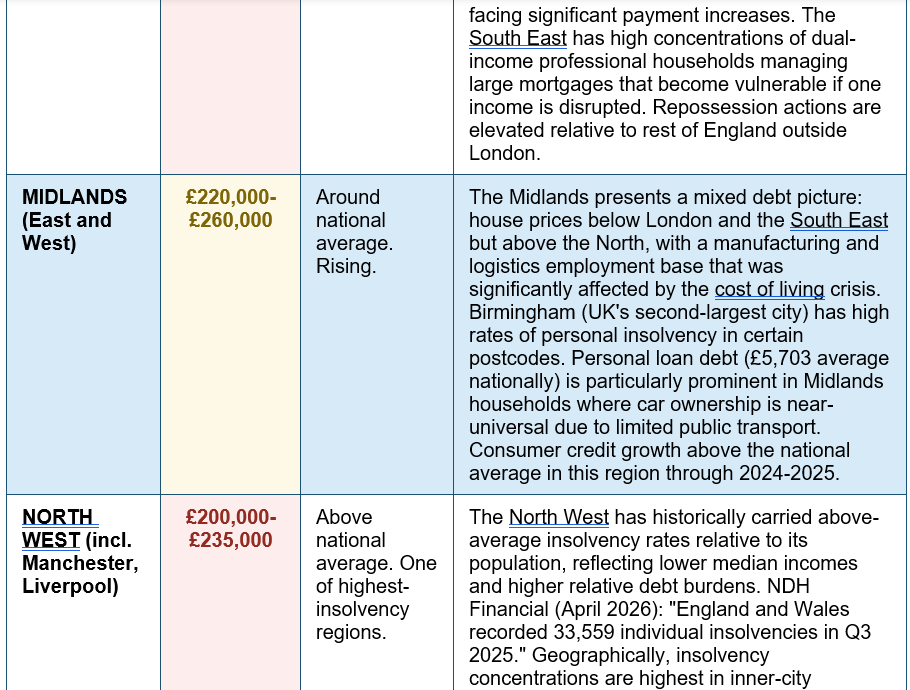
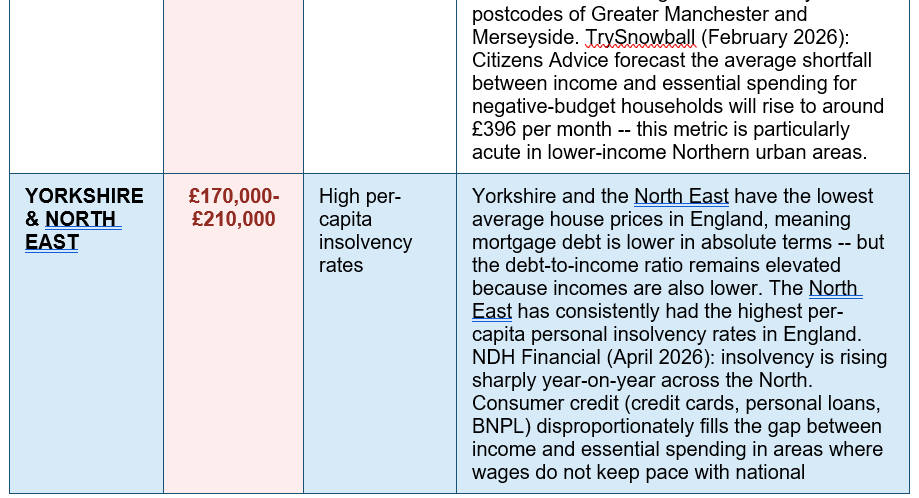
England contains the full spectrum of the UK debt map -- from London's record mortgage balances to the North East's highest per-capita insolvency rates. The average house price in England was £289,946 in March 2026 (Finder.com, May 2026), but this average masks an enormous regional spread. House of Commons Library (1 week ago): 35,143 individual insolvencies were registered in England and Wales in Q1 2026 -- the vast majority in England.London represents the mortgage-debt extreme of the English regional map. Average property prices above £500,000 in most London boroughs drive mortgage balances far above the national £197,811 average. The rental sector adds a secondary debt pressure: renters who cannot afford to buy face rents consuming 40-50% of income in much of London, leaving no buffer for unexpected expenses. NDH Financial (April 2026): 'Areas with high rents and many private renters, like London and the South East, are more likely to see possession cases.' At the other end of the English debt geography, the North East and Yorkshire have the lowest house prices in England but the highest rates of personal insolvency -- reflecting the debt-to-income reality that lower incomes produce higher relative debt burdens even when absolute balances are smaller. Consumer credit (credit cards, personal loans, BNPL) fills the gap between income and essential spending in areas where wages have consistently fallen behind national price inflation since 2021.
Scotland: Protected Trust Deeds and Rising Insolvency
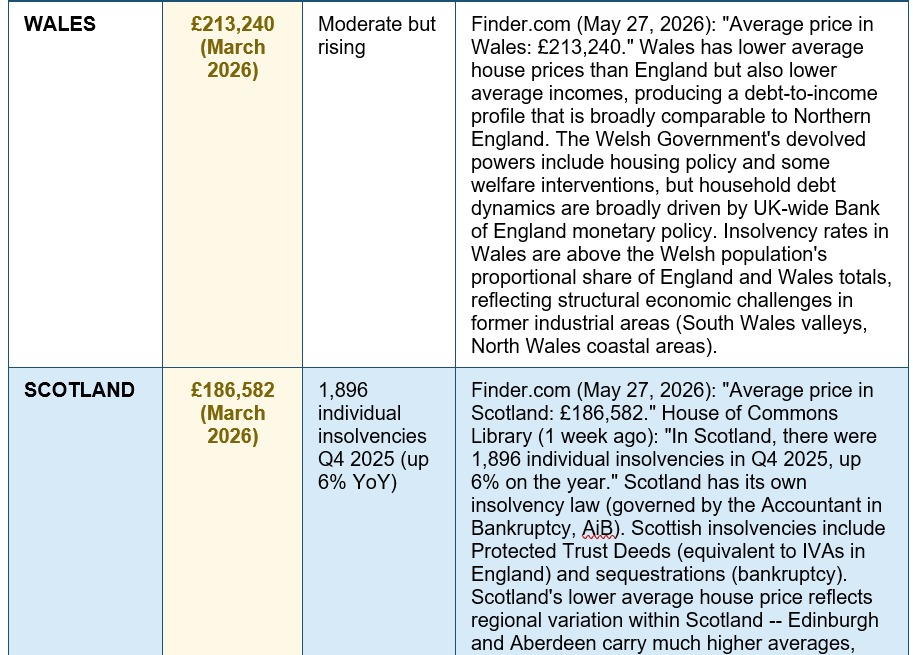
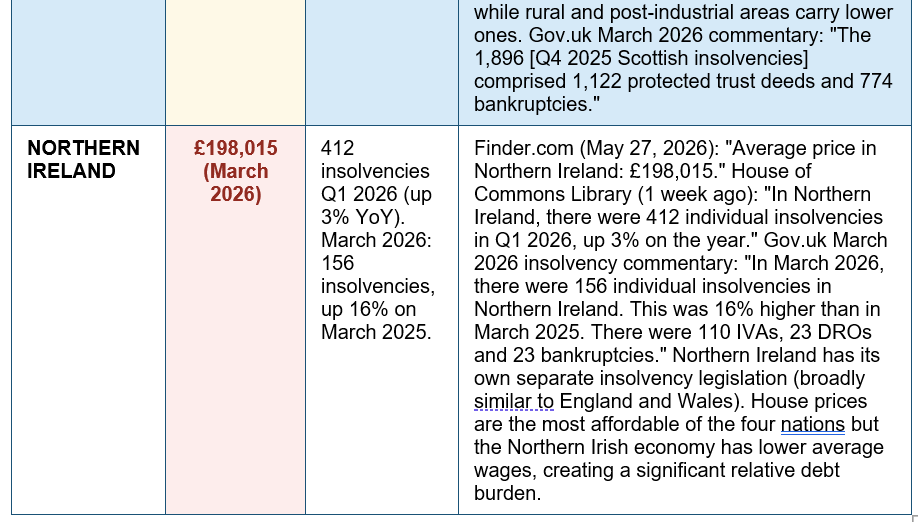
Scotland operates under separate insolvency law governed by the Accountant in Bankruptcy (AiB), with its own procedures: the Protected Trust Deed (Scotland's equivalent of the English IVA) and sequestration (Scotland's term for bankruptcy). House of Commons Library (1 week ago): 'In Scotland, there were 1,896 individual insolvencies in Q4 2025, up 6% on the year.' The GOV.UK March 2026 insolvency commentary confirms this composition: of Q4 2025 Scottish insolvencies, 1,122 were protected trust deeds and 774 were sequestrations (bankruptcies), of which 431 went via the Minimal Asset Process route (Scotland's equivalent of the English DRO).Finder.com (May 27, 2026): average house price in Scotland was £186,582 in March 2026 -- the second-lowest of the four nations. But this masks significant internal variation: Edinburgh and Aberdeen carry average prices well above the Scottish mean (Edinburgh approaching £300,000), while former industrial areas of central Scotland (Lanarkshire, Dundee, Inverclyde) carry prices well below it, and insolvency rates above the Scottish average. Scotland's debt picture is one of geographic bifurcation between a prosperous urban corridor (Edinburgh-Glasgow) and former industrial areas facing structural economic challenges that translate directly into above-average personal debt stress.
Wales: The Post-Industrial Debt Burden
Wales has an average house price of £213,240 (March 2026, Finder.com) -- above Scotland and Northern Ireland but below the English average -- and an economy characterised by lower average wages relative to the UK mean, a higher proportion of public sector employment, and significant post-industrial areas in the South Wales valleys and parts of North Wales that have not fully recovered from the decline of coal and steel.Welsh insolvency rates are above the nation's proportional share of England-and-Wales combined totals -- meaning Wales generates more insolvencies per capita than England. The specific concentration is in former valley communities (Merthyr Tydfil, Blaenau Gwent, Rhondda Cynon Taf) where low incomes meet high relative debt burdens. The Welsh Government has devolved responsibilities for some aspects of housing and social welfare, but household debt dynamics are governed by UK-wide Bank of England monetary policy and FCA consumer credit regulation. NimbleFins (January 2026): the 98% increase in non-mortgage household debt over ten years applies across the UK, but in Wales this growth has occurred on a lower income base, meaning the debt-to-income deterioration has been proportionally more severe.
Northern Ireland: Rising Fast From a Lower Base
Northern Ireland has the most affordable house prices of the four nations at £198,015 average (March 2026, Finder.com) but a rising insolvency trajectory that stands out against other nations. House of Commons Library (1 week ago): 'In Northern Ireland, there were 412 individual insolvencies in Q1 2026, up 3% on the year.' The GOV.UK March 2026 insolvency commentary is more striking: 'In March 2026, there were 156 individual insolvencies in Northern Ireland. This was 16% higher than in March 2025.' A 16% year-on-year increase in a single month is a significant acceleration.Northern Ireland's debt map differs from the rest of the UK in several structural ways: it has its own separate insolvency legislation (broadly similar to England and Wales but with different procedural details); it has lower average incomes than Great Britain; and it has historically had lower house prices following the severe property price crash of 2007-2013 that was more severe in Northern Ireland than anywhere else in the UK. The recovery in property values since 2013 has been steady but has not reached the levels of England's South East. Consumer credit patterns are broadly similar to the UK national picture -- the £8,304 average non-mortgage consumer debt and £2,601 average credit card balance apply with regional variation. The rising insolvency trajectory in 2025-2026 suggests that the cost of living crisis has had a delayed but significant impact on Northern Irish households.
The Full Regional Debt Map: Data Across All UK Nations and Regions
The following table maps every UK nation and major English region with its key debt and insolvency data from the most current available sources: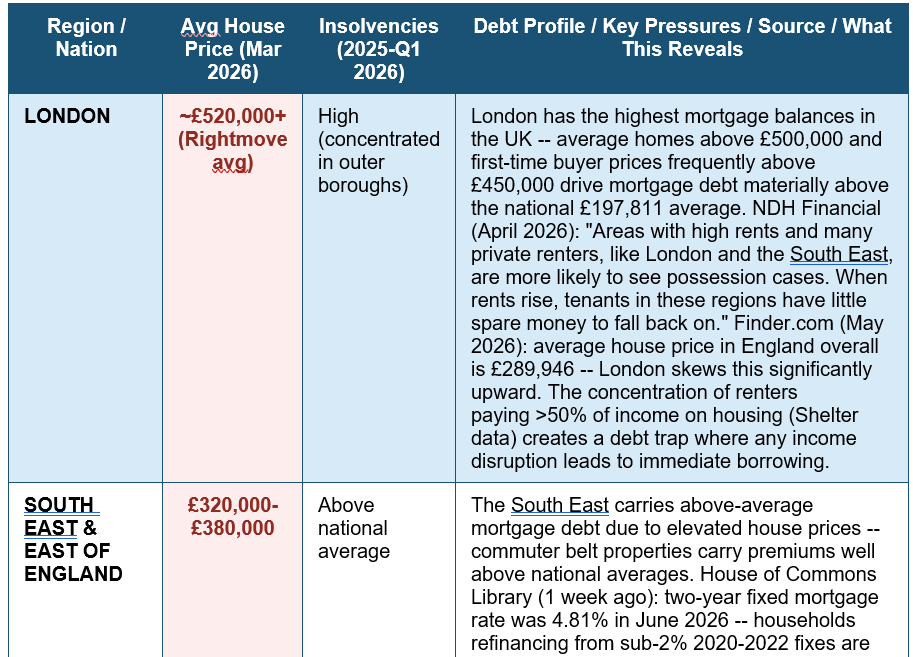

The Stress Signals: Where the UK Debt Map Shows Acute Pressure
- Insolvency rising faster than incomes across all four nations: House of Commons Library (1 week ago): Q1 2026 insolvencies in England and Wales up 20.4% year-on-year. Scotland up 6% in Q4 2025. Northern Ireland up 16% in March 2026 alone. These are not single-month anomalies -- they reflect a sustained deterioration from the cost-of-living crisis impact on household balance sheets that has not been reversed by the partial easing of CPI inflation.
- Non-mortgage debt doubling while savings vanish: TrySnowball (February 2026): non-mortgage debt up 98% in a decade to £18,392 per household. Simultaneously: 16% of UK adults have zero savings, 44% stopped or reduced saving in the past 12 months, and 23% used savings to cover everyday expenses. The collapse of the savings buffer makes each £18,392 in non-mortgage debt dramatically more vulnerable -- one unexpected expense triggers new high-interest borrowing.
- Mortgage term extension masking affordability stress: Finder.com (May 2026): first-time buyers now take out mortgages averaging 31 years -- up from 25 years a decade ago. This reduces monthly payments but increases total interest paid over the life of the loan and extends the period of exposure to rate risk. A 31-year mortgage taken at 5% by a 30-year-old runs until the borrower is 61. Two rate cycles of increase will occur within that term.
- 79,110 homeowners in mortgage arrears (Q1 2026): Finder.com (May 2026): 79,110 homeowners behind by 2.5% or more of their balance in Q1 2026. This represents a slight decrease from Q4 2025 -- a marginal positive signal. But 79,000 households in formal arrears is the population most immediately at risk of repossession proceedings if payments cannot be restored. Arrears are concentrated in lower-income areas and in households that refinanced from sub-2% deals to current market rates of approximately 4.81%.
- Credit card APRs at 22-35% against a 3.75% Bank Rate: TrySnowball (February 2026): "Bank of England base rate at 3.75% but credit card APRs remain 22-35%." This represents the largest spread between the Bank Rate and consumer credit card rates in modern UK banking history. On the £2,601 average credit card balance per household, a 25% APR costs approximately £650/year. Total estimated UK credit card interest payments at £79 billion outstanding: approximately £17-20 billion per year.
The debt-to-income ratio in context: better than 2008, but still 117%. House of Commons Library (1 week ago): 'Household debt peaked in Q3 2008 at 155.8% of household disposable income. It then declined to around 135% by early 2016. Household debt levels have been falling since the beginning of 2022. In Q1 2026 the debt-to-income ratio was 117.2%.' This trajectory -- from 155.8% in 2008 to 117.2% in 2026 -- represents 18 years of gradual balance sheet repair. The UK financial system is in meaningfully better shape than it was at the peak of the pre-2008 credit expansion. But 117.2% still means that UK households collectively owe more than their entire annual disposable income -- a ratio that, in normal times, would be considered elevated. The OBR forecast of £2,927 billion in household debt by 2030 implies that this ratio will remain above 100% for the foreseeable future, unless income growth materially outpaces debt growth. The households most insulated from this: the approximately 35% of households who own their homes outright with no mortgage, who carry no credit-card debt, and who have substantial savings. The households most exposed: renters carrying consumer credit balances, households who have recently remortgaged from sub-2% to 4-5%+ rates, and the 4.1 million adults in problem debt (TrySnowball).
FIVE STRESS SIGNALS REQUIRING IMMEDIATE ATTENTION FOR UK HOUSEHOLDS: (1) MORTGAGE ARREARS: 79,110 HOMEOWNERS BEHIND BY 2.5%+ (Q1 2026). If you are in or approaching mortgage arrears, contact your lender before missing a payment. UK lenders are regulated to offer forbearance, payment holidays, and term extensions. Free advice: MoneyHelper 0800 138 7777; Shelter 0808 800 4444. Do not wait for a possession notice to act. (2) INSOLVENCIES UP 20.4% IN Q1 2026 YEAR-ON-YEAR. If you are considering insolvency (DRO, IVA, bankruptcy), seek free regulated advice before making any decision. The right solution depends on your specific debt amount, income, assets, and debt types. StepChange 0800 138 1111. National Debtline 0808 808 4000. The wrong solution can be more expensive and more damaging than the debt itself. (3) CREDIT CARD APRs AT 22-35% AGAINST BASE RATE OF 3.75%. For anyone carrying a credit card balance at 22%+ APR: this is the most expensive regulated consumer debt in the UK market. Priority: check eligibility for a 0% balance transfer card (0% for 12-30 months available to good-credit borrowers). Or accelerate repayment using the debt avalanche method (highest APR first). (4) NON-MORTGAGE DEBT DOUBLED IN A DECADE: £18,392 AVERAGE. Non-mortgage household debt has grown 98% in 10 years while real wages have grown materially less. For the average household: £18,392 in non-mortgage debt at an average blended rate of 10-15% is costing £1,839-£2,759/year in interest. Identify the highest-rate debt and redirect the maximum possible monthly payment toward it. (5) 16% OF UK ADULTS HAVE ZERO SAVINGS (TrySnowball, Feb 2026). Without an emergency fund, any unexpected expense -- a car repair, a broken boiler, a period of illness -- converts immediately into high-interest debt. The first financial priority for anyone with zero savings and consumer debt: build a £500-£1,000 emergency buffer at a high-yield savings account (currently 4.5-5.0% AER in July 2026) before addressing other financial goals.
YOUR UK DEBT MAP PERSONAL AUDIT: STEP 1 -- MAP YOUR OWN DEBT (20 minutes): List every debt: balance, interest rate, type (mortgage, credit card, personal loan, student loan, BNPL, overdraft). Compare each to the national averages in this guide: Is your mortgage above or below £197,811? Is your credit card balance above or below £2,601? Do you have savings below the £1,000 threshold that 37% of UK adults are at or below? STEP 2 -- UNDERSTAND YOUR INSOLVENCY RISK REGION: Are you in the North East, North West, or inner-city postcodes with above-average insolvency rates? Citizens Advice and StepChange both publish regional data on insolvency concentrations. STEP 3 -- IDENTIFY YOUR HIGHEST-COST DEBT FIRST: Credit cards at 22-35% APR are the most expensive. Balance transfer to 0% (check MSE Best Balance Transfers at moneysavingexpert.com). If not eligible: debt avalanche -- minimum on all cards except the highest-rate one, then maximum possible on that one each month. STEP 4 -- CHECK YOUR MORTGAGE RISK WINDOW: When does your current fixed rate expire? Finder.com (May 2026): average two-year fixed 4.81%. L&C Mortgages, Habito, or Trussle can provide whole-of-market comparison at no fee. Start comparing 6 months before expiry -- offers can be locked in advance. STEP 5 -- GET FREE HELP IF NEEDED: StepChange 0800 138 1111 | National Debtline 0808 808 4000 | Citizens Advice citizensadvice.org.uk | MoneyHelper 0800 138 7777 | Shelter (housing/mortgage) 0808 800 4444. ALL FREE. ALL REGULATED. The evidence is consistent: 61% of those who sought debt advice found their situation became more manageable (FCA).
Conclusion
The UK household debt map in 2026 shows approximately £2 trillion in mortgage and consumer credit debt, rising steadily year-on-year. The debt-to-income ratio of 117.2% is significantly improved from its 155.8% peak in 2008, but still means UK households collectively owe more than their annual disposable income. Individual insolvencies in England and Wales are 20.4% higher than a year ago. Scotland's insolvencies rose 6%. Northern Ireland's rose 16% in a single month (March 2026 vs March 2025). Non-mortgage debt has doubled in a decade.The regional map is not uniform. London carries the highest absolute mortgage debt, driven by housing costs that dwarf every other UK region. The North East and Yorkshire carry the highest per-capita insolvency rates, reflecting the debt-to-income reality of lower incomes and the consumer credit that fills the gap between wages and the cost of living. Scotland, Wales, and Northern Ireland each have distinct debt profiles shaped by their separate legal frameworks, economic structures, and housing markets -- but all three nations show rising insolvency trajectories in 2025-2026.
The OBR forecasts UK household debt reaching £2,927 billion by 2030. The Bank of England base rate at 3.75% is falling but remains well above the near-zero rates of 2009-2021. Credit card APRs at 22-35% bear no relationship to the Bank Rate. And 4.1 million UK adults are already in problem debt. The debt map is a record of financial decisions made across 28 million households over decades. For the households within it, the map's most important feature is not the national total but the specific lines on their own balance sheet -- and what they cost, every single month.
Frequently Asked Questions (FAQ)
How much does the average UK household owe in 2026?The answer depends on which debts are included. Richify (May 29, 2026 -- most current): 'UK households owe ~£2.0tn: £1,746bn mortgages + £253bn consumer credit, with £79bn on credit cards. Spread across the UK's ~28.4 million households, about £2.0 trillion of mortgage and consumer debt works out at an average of around £70,000 per household.' This is an average across all households, including those with no mortgage -- which only 29% of households carry (NimbleFins, January 2026). For households with a mortgage, the average outstanding balance was £139,699 (Finder.com, May 2026), with the average total home loan at £197,811 (NimbleFins). For consumer credit (excluding mortgages and student loans): the average household carries £8,304, broken down as £2,601 in credit card debt, £5,703 in personal loans (NimbleFins, January 2026). Average non-mortgage debt including student loans: £18,392 per household. TrySnowball (February 2026): 'UK households owed £1,899.7 billion at the end of March 2025, up £54.3 billion from the year before -- that's an extra £1,002 per adult in a single year.' The OBR forecasts total UK household debt reaching £2,927 billion by 2030, implying average per-household debt of approximately £98,190 across all households.
Which region of the UK has the most debt?
In absolute terms, London carries the most debt of any UK region, driven by its housing market. Average property prices in London exceed £500,000 -- more than double the national average house price of £268,132 in March 2026 (Finder.com, May 2026) and nearly double the England average of £289,946. This directly drives mortgage balances substantially above the national average of £197,811 per mortgaged household. NDH Financial (April 2026): 'Areas with high rents and many private renters, like London and the South East, are more likely to see possession cases.' In relative terms (debt-to-income), the picture changes: the North East and Yorkshire, despite having the lowest absolute house prices in England, have the highest per-capita personal insolvency rates. Lower incomes in these regions mean that even smaller debt balances represent a higher proportion of annual earnings. Consumer credit (credit cards, personal loans, BNPL) fills the income-spending gap in these areas, creating relative debt burdens that are as severe as those in high-price Southern regions despite much lower absolute balances. For the devolved nations: Scotland and Northern Ireland both show rising insolvency trajectories in 2025-2026, with Northern Ireland registering a 16% year-on-year increase in insolvencies in March 2026 (GOV.UK, April 2026). The 'most debt' question has no single answer -- it depends whether you measure by absolute balance, relative-to-income, or by the insolvency distress that results from unmanageable debt.
How many UK insolvencies were there in 2025 and Q1 2026?
The insolvency statistics are among the most concrete indicators of UK household debt stress in 2026. TrySnowball (February 2026): '126,240 individual insolvencies in 2025 -- the highest level since 2010.' NDH Financial (April 2026): '33,559 individual insolvencies in England and Wales in Q3 2025, which is 14.7% higher than Q3 2024. That works out as roughly 1 person every 4 minutes.' House of Commons Library (1 week ago -- most current): 'There were 35,143 individual insolvencies in England and Wales in Q1 2026, 1,446 more than in the previous quarter. The Q1 2026 level is 20.4% higher than the level in Q1 2025.' For the devolved nations (House of Commons Library, 1 week ago): Scotland recorded 1,896 individual insolvencies in Q4 2025 (up 6% year-on-year); Northern Ireland recorded 412 individual insolvencies in Q1 2026 (up 3% year-on-year). The GOV.UK March 2026 insolvency commentary provides more granular March figures: 156 insolvencies in Northern Ireland in March 2026, up 16% on March 2025. The UK insolvency figures include IVAs (Individual Voluntary Arrangements), DROs (Debt Relief Orders), and bankruptcy orders. Informal solutions like Debt Management Plans are NOT included in these statistics -- meaning the true number of people in formal or informal debt resolution is significantly higher than 126,240. StepChange alone reported 17,998 new clients in January 2026.
What is the current UK mortgage rate and how is it affecting debt?
House of Commons Library (1 week ago -- most current): 'The average two-year fixed mortgage rate was 4.81% in June 2026, up 0.53 percentage points on a year ago.' Parliament's household debt research briefing (3 weeks ago) adds: 'At the end of June 2026, the average interest rate was 4.81% on a two-year fixed rate mortgage and 4.65% for a five-year fixed rate mortgage.' The Bank of England base rate is 3.75% (SalaryWise, July 2026) -- down from its 5.25% peak. The mortgage rate context is critical: approximately 1.5-2 million UK households had fixed-rate mortgage deals expire in 2023 and 2024, having fixed at rates of 1-2% in 2020-2022. Refinancing to the current 4.81% two-year fix represents a payment increase of approximately £200-400/month on a typical £200,000 mortgage -- an annual increase of £2,400-£4,800. Finder.com (May 27, 2026): '79,110 homeowners were behind on their mortgage payments by 2.5% of their balance or more in Q1 2026, a slight decrease from the previous quarter.' First-time buyers face an additional structural pressure: 'First-time buyers are now signing up to mortgages that last an average of 31 years' (Finder.com, May 2026), up from 25 years a decade ago -- a response to affordability pressure that extends the debt burden and total interest paid. For households approaching the end of a fixed-rate deal: start comparing six months before expiry. Use a whole-of-market broker (L&C Mortgages, Habito -- no fee) to access the full available market rather than a single lender's product range.
How does UK student loan debt work and is it included in the £2 trillion?
UK student loan debt is largely separate from the £2 trillion Bank of England household debt figure. Richify (May 2026): 'That excludes student loans, which add roughly another £270 billion.' NimbleFins (January 2026): 'Average student loan per household: £10,088 -- 55% of all non-mortgage lending.' The key difference between UK student loan debt and both UK consumer debt and US student loan debt: UK student loans are income-contingent. Repayments only begin when earnings exceed the threshold: £27,295/year for Plan 2 borrowers (pre-2023 university entrants), £25,000/year for Plan 5 borrowers (2023 university entrants onward). Repayments are 9% of income above the threshold, collected automatically through payroll. Unpaid balances under Plan 2 are written off after 30 years; under Plan 5, after 40 years. Because of this income-contingent structure, UK student loans are not subject to conventional debt enforcement, default proceedings, or consumer debt insolvency procedures. They do not appear on credit files. This makes them fundamentally different from consumer debt in their practical financial impact -- though the balances affect graduate household finances and spending decisions. The £270 billion outstanding is a real obligation, but its income-contingent, write-off structure means it functions more like a graduate income supplement tax than a conventional bank loan. For individual borrowers: check your specific plan at studentloans.gov.uk, understand your threshold, and model whether voluntary overpayments make financial sense given your expected career trajectory.

0 Comments Comments