
Credits
UK Debt Statistics 2026: The Complete Data Guide
Table of Contents
- The Headline Numbers: Key UK Debt Statistics 2026
- Mortgage Debt: The Largest Household Liability
- Consumer Credit: Credit Cards, Personal Loans, and Car Finance
- Credit Cards
- Personal Loans
- Overdrafts
- The Interest Rate Environment: The Cost of UK Debt in 2026
- Student Loan Debt: A Generational Shift in the Debt Profile
- Individual Insolvencies: The Stress Signal
- Who Carries Debt: The Demographic Picture
- Practical Implications: What the Data Means for Households
- Conclusion
- Frequently Asked Questions (FAQ)
- External References & Further Reading
The United Kingdom carries one of the highest household debt burdens among major developed economies, with the average household consumer debt sitting at approximately £18,392 entering 2026 - a figure that has nearly doubled over the past decade. This number does not include mortgages; when secured property debt is factored in, the picture becomes considerably larger still, with the average UK household that holds a mortgage now carrying an outstanding balance of £197,811 against their home.
Understanding the current state of UK household debt requires looking beyond any single headline figure, however. The debt landscape in 2026 is shaped by several distinct, simultaneous forces: mortgage costs that remain elevated relative to pre-2022 norms even as the Bank of England's base rate has begun to decline; credit card and overdraft interest rates that sit above 21%, making revolving consumer credit particularly costly to carry; a student loan book that has grown to over £230 billion for England alone; and an individual insolvency rate that rose 20.4% year-on-year in Q1 2026, signalling that a meaningful share of households are finding their debt position unsustainable.
This guide draws together the most current, authoritative UK debt statistics from the Bank of England, the Office for National Statistics, the Financial Conduct Authority, the Insolvency Service, and the House of Commons Library to provide a comprehensive, data-grounded picture of where UK households stand in 2026. It covers each major debt category in turn, examines the interest rate environment shaping the cost of that debt, identifies the demographic patterns in who carries it, and offers a practical framework for households assessing their own debt position against this national backdrop.
The Headline Numbers: Key UK Debt Statistics 2026
The table below brings together the most current, nationally authoritative statistics on UK household debt across all major categories: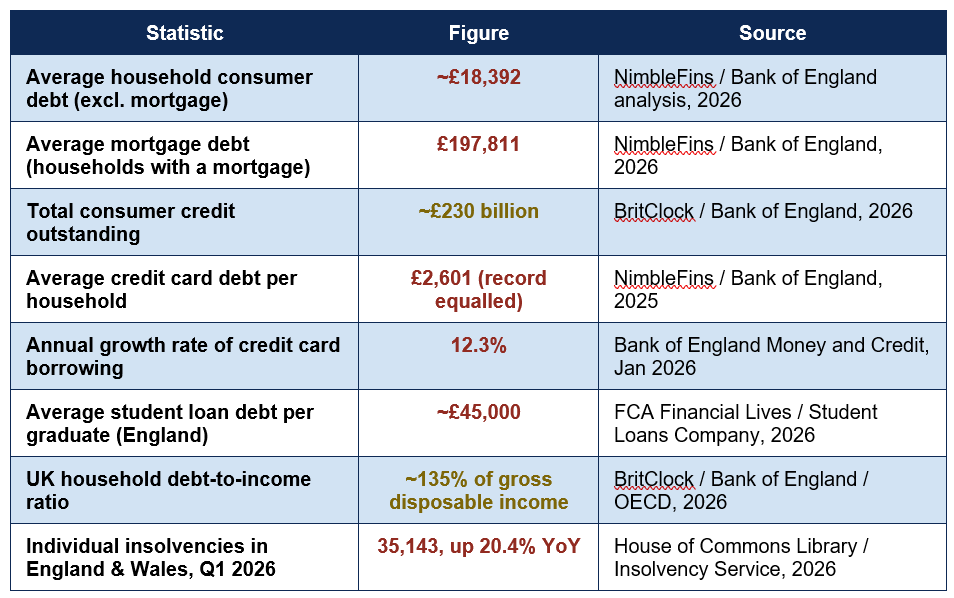
Household consumer debt doubling in a decade: £18,392 in 2026 vs ~£9,200 in 2016 — a 98% increase over ten years in average household consumer debt excluding mortgages, even as the period included a pandemic, a cost-of-living shock, and significant inflation in both asset and consumer prices (NimbleFins / Bank of England, 2026).
- Why the FCA's definition of 'over-indebted' matters: The FCA estimates approximately 8.9 million UK adults are in serious financial difficulty, defined as having missed or made late payments on bills or credit in the last six months. This figure - equivalent to roughly one in six UK adults - is distinct from simply having debt, which is nearly universal; it specifically captures those for whom existing debt obligations are proving genuinely unmanageable, and is the primary FCA indicator used to assess the scale of active debt harm in the UK population.
Mortgage Debt: The Largest Household Liability
Mortgage debt remains, by a substantial margin, the largest single component of UK household debt, accounting for approximately 91% of total household debt when included. The average outstanding mortgage balance for households that hold one stood at £197,811 in 2026, an increase of 28% over the past decade, reflecting both rising house prices and the longer mortgage terms now common as affordability pressures have pushed many borrowers toward extending their repayment period.The Bank of England's January 2026 Money and Credit release reported net mortgage borrowing of £4.1 billion for that month, below the previous six-month average of £4.5 billion, reflecting the ongoing moderation in new purchase activity described in the broader mortgage market data from the Q1 2026 MLAR release. The annual growth rate of net mortgage lending was 3.3% in January 2026, broadly stable but meaningfully lower than the rates of growth seen during the pandemic-era housing boom of 2020-2021.
The UK household debt-to-income ratio sits at approximately 135% of gross disposable income, placing the UK above the OECD average of around 100% and significantly higher than Germany (approximately 95%), though below the highest ratios seen among comparable economies such as Denmark (approximately 250%) and Australia (approximately 215%). This positioning reflects both the UK's comparatively high owner-occupier homeownership aspiration and the structural constraint of limited housing supply, which has kept property values elevated relative to incomes even through periods of significant mortgage rate pressure.
Consumer Credit: Credit Cards, Personal Loans, and Car Finance
Beyond mortgages, consumer credit - encompassing credit cards, personal loans, car dealership finance, and overdrafts - has shown consistent and rapid growth in recent years. Total consumer credit outstanding stands at approximately £230 billion, with the Bank of England reporting net consumer credit borrowing of £1.8 billion in January 2026, in line with the previous six-month average, suggesting stable and sustained demand rather than either a significant acceleration or a sharp pullback.Credit Cards
Credit card debt reached an average of £2,601 per household in 2025, equalling the record high set seven years earlier - a figure that, given the substantially higher interest rate environment of 2025/2026 relative to that earlier peak, represents a considerably more costly burden for households carrying a revolving balance. The annual growth rate of credit card borrowing was 12.3% in January 2026, among the highest rates of growth of any major debt category. The effective rate on interest-charging credit cards stood at 21.75% in January 2026, meaning a household carrying a £2,601 credit card balance and making only minimum payments faces annual interest costs of approximately £565.Personal Loans
The average personal loan balance per household stood at approximately £5,703 in 2025, a record high that surpassed even the post-financial-crisis peaks seen in 2018-2019. The effective rate on new personal loans rose to 9.03% in January 2026, up from 8.78% in December 2025. The other consumer credit category, which includes car dealership finance and other personal loans, showed annual growth of 6.5% in January 2026, slightly below the credit card growth rate but still well above general economic growth.Overdrafts
Overdraft interest rates present perhaps the starkest illustration of the cost of short-term consumer borrowing in the current UK environment. The effective rate on interest-charging overdrafts reached 22.03% in January 2026 - a rate that, for a household regularly relying on an overdraft facility to bridge income and expenditure gaps, generates a genuinely significant interest burden on what are often perceived as minor or routine borrowings.The Interest Rate Environment: The Cost of UK Debt in 2026
The table below summarises the current interest rate environment across all major categories of UK household debt, providing a clear picture of the cost of borrowing by product type: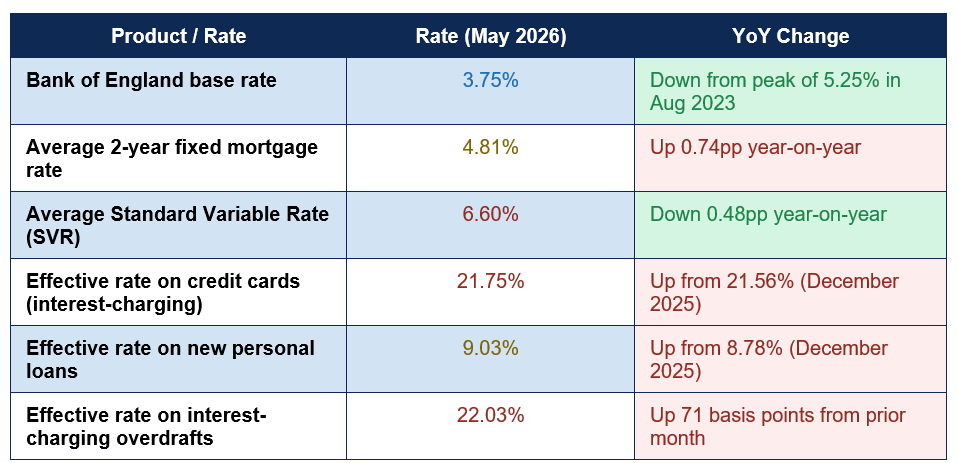
Gap between base rate and credit card rates: 3.75% base vs 21.75% credit cards — the spread between the Bank of England base rate and the effective rate on interest-charging credit cards is an extraordinary 18 percentage points, illustrating the vast difference in cost between secured and unsecured borrowing (Bank of England, January 2026).
This rate environment creates a genuinely bifurcated cost landscape for UK household debt. Mortgage borrowers, with secured debt backed by property, access rates in the 4-7% range depending on product type and LTV - meaningfully higher than pre-2022 norms but still representing relatively low-cost, long-term capital. Unsecured consumer credit borrowers, particularly those using credit cards or overdrafts, face rates above 21%, creating a substantial drag on household finances for the approximately 8.9 million adults the FCA identifies as in serious financial difficulty.
Student Loan Debt: A Generational Shift in the Debt Profile
Student loan debt has been one of the fastest-growing components of UK household debt over the past decade, driven by the introduction of the post-2012 tuition fee system, which increased annual fees to up to £9,000 (now £9,535) and moved the majority of the cost of higher education from upfront taxation to income-contingent repayment. The outstanding student loan book for England alone now exceeds £230 billion and is growing, with the average graduate from English universities now carrying approximately £45,000 in student loan debt on graduation.The growth in student debt is reflected clearly in NimbleFins' decade-long analysis of UK household debt, which identifies student loans as the fastest-growing component of non-mortgage household debt, with a nearly fourfold increase over ten years. For the younger age groups specifically, student loans dramatically reshape the debt picture: median debt among 18-24 year-olds rises from just £400 excluding student loans to £7,900 when student loans are included, illustrating how completely student loan debt dominates the financial liabilities of the youngest adult cohort.
Importantly, student loan repayments are income-contingent and are written off after a defined period (30 years in England under the most recent system), meaning the financial burden differs structurally from commercial debt. However, the repayment obligation affects disposable income throughout the working life of borrowers who earn above the repayment threshold, reducing the cash available for saving, home deposit accumulation, and other financial goals throughout the period of active repayment.
Individual Insolvencies: The Stress Signal
The most direct indicator of acute debt stress in the UK is the individual insolvency statistics published quarterly by the Insolvency Service. Entering 2026, these figures have shown significant deterioration: individual insolvencies in England and Wales rose to 35,143 in Q1 2026, representing a year-on-year increase of 20.4% and 1,446 more cases than in the previous quarter. Parallel figures from Scotland (1,896 insolvencies in Q4 2025, up 6% year-on-year) and Northern Ireland (412 in Q1 2026, up 3%) confirm that the trend is UK-wide rather than regionally concentrated.Individual insolvencies include Debt Relief Orders, Individual Voluntary Arrangements, and bankruptcies - each representing a formal, legally-structured response to an unsustainable debt burden. A 20.4% year-on-year increase is a material and significant deterioration rather than a minor statistical fluctuation, and the House of Commons Library has highlighted it as one of the key indicators of household financial stress in its most recent economic briefings.
- Who is most at risk: FCA Financial Lives data consistently identifies households experiencing negative life events (job loss, relationship breakdown, bereavement), those with low financial resilience (limited savings and no accessible credit for emergencies), and those with poor health as the most vulnerable to unsustainable debt. Geographically, areas with lower average incomes and higher concentrations of insecure employment show systematically higher rates of problem debt than more affluent areas, a distributional pattern that sits beneath the aggregate national statistics discussed elsewhere in this guide.
Who Carries Debt: The Demographic Picture
FCA Financial Lives Survey data and ONS Wealth and Assets Survey data together provide a detailed demographic picture of UK debt distribution that is considerably more nuanced than the headline national averages suggest.- By age: Average debt levels excluding student loans peak in middle age, with 35-44 and 45-54 year-olds both averaging approximately £3,800 in consumer debt. The 35-44 age group (60%) and 45-54 age group (58%) are also the most likely to hold consumer credit products, reflecting peak household expenditure periods associated with child-rearing, home improvement, and family formation. Among the under-25s, student loans dominate the liability side of the balance sheet.
- By income: High-income households are most likely to hold debt in absolute terms, particularly mortgage debt, because taking out large loans requires qualifying income. However, low-income households are disproportionately likely to be over-indebted - carrying debt they cannot comfortably service relative to their income - and disproportionately likely to rely on high-cost credit products where the effective interest rate is significantly higher than for mainstream credit.
- Buy-now-pay-later as a growing category: The FCA estimates that 10.9 million UK adults (20%) used buy-now-pay-later credit in the twelve months to May 2024, up from 8.8 million (17%) in 2022. Government regulation of BNPL products has been in development since 2024, reflecting growing policy concern about a credit category that has grown rapidly outside the regulatory framework that governs other forms of consumer credit.
Practical Implications: What the Data Means for Households
Drawing on the statistics reviewed in this guide, several practical implications stand out for households assessing their own debt position:- Prioritise high-cost, unsecured debt above all: With credit card rates at 21.75% and overdraft rates at 22.03%, revolving consumer debt is dramatically more expensive than mortgage or personal loan debt in the current rate environment. Any household carrying a credit card balance or regular overdraft usage that is not being cleared monthly should treat reduction of this specific debt as the highest-priority financial action available to them.
- Understand your mortgage rate exposure: With 1.8 million UK fixed-rate mortgages expiring in 2026 and the average 2-year fixed rate at 4.81%, many households face a significant increase in their monthly mortgage costs compared with the sub-2% rates available in 2021-2022. Planning for this transition, including reviewing both internal product transfer and full remortgage options several months ahead of expiry, is the single most important financial planning action for homeowners approaching the end of a fixed-rate term.
- Do not treat student loans as conventional debt: Student loans in England operate on an income-contingent, time-limited basis, meaning the financial priority attached to them in conventional personal debt management frameworks may be misleading for many borrowers. For most graduates, student loan repayments are effectively a graduate income tax; only those who are certain of repaying the full balance before write-off should consider making voluntary overpayments.
- Use official resources if debt becomes unmanageable: If debt is becoming genuinely unmanageable, the first step is always to contact lenders directly and as early as possible, before payments are missed, when the most flexible forbearance options are still available. Free, regulated debt advice is available through the MoneyHelper service, StepChange Debt Charity, and Citizens Advice, all of which offer genuinely independent guidance without the commercial incentives that affect fee-charging debt management companies.
Conclusion
UK household debt in 2026 is simultaneously very large and broadly managed, with the aggregate figures reflecting a population in which mortgage debt dominates the balance sheet, consumer credit is growing at double-digit rates, and student loan debt has become a defining feature of younger cohorts' financial starting position. The average household enters 2026 carrying approximately £18,392 in non-mortgage consumer debt - a figure that has nearly doubled in a decade - against an interest rate environment in which revolving unsecured credit costs over 21% per year to carry.The most acute signal of stress within this overall picture is the 20.4% year-on-year rise in individual insolvencies in Q1 2026, which indicates that a meaningful and growing share of UK households are finding their debt positions genuinely unsustainable. The FCA's estimate of 8.9 million UK adults in serious financial difficulty provides further context: this is not a marginal or statistical problem but a large-scale, structurally embedded feature of the UK household debt landscape, concentrated disproportionately among lower-income households, those in precarious employment, and those who have experienced adverse life events that disrupted their ability to service debt obligations.
For the majority of households whose debt remains manageable, the most practically important findings from this body of data are the interest rate comparisons between debt categories, the cost implications of the 2026 fixed-rate mortgage maturity wave, and the importance of early engagement with lenders or regulated debt advisers if financial circumstances deteriorate. The statistics in this guide do not tell the story of a debt crisis - they tell the story of a high-debt economy in which the cost and distribution of that debt are becoming increasingly important factors in household financial wellbeing.
Frequently Asked Questions (FAQ)
What is the average household debt in the UK in 2026?
Average total UK household consumer debt (excluding mortgages) stood at approximately £18,392 entering 2026, comprising average credit card debt of £2,601, average personal loans of £5,703, and average student loan debt of approximately £10,088. For households with a mortgage, average outstanding mortgage debt reached £197,811. Total debt levels have nearly doubled over the past decade when measured on a non-mortgage consumer credit basis.Why are individual insolvencies rising so sharply?
Individual insolvencies in England and Wales rose 20.4% year-on-year in Q1 2026 to 35,143 cases. Multiple factors are contributing: the residual effect of high energy and food inflation on household budgets over the preceding two years, persistently high unsecured credit interest rates (above 21% for credit cards and overdrafts), the expiry of mortgage forbearance arrangements that supported some households through the 2022-2023 rate shock, and the gradual normalisation of insolvency proceedings following reduced activity during pandemic-era restrictions.What is the interest rate on UK credit cards in 2026?
The effective interest rate on interest-charging credit cards in the UK was 21.75% in January 2026, according to the Bank of England's Money and Credit statistics. This represents a substantial increase from pre-2022 norms and means a household carrying a £2,601 average credit card balance and paying only minimum repayments faces approximately £565 in annual interest charges on that balance alone, before any additional spending.How does UK household debt compare to other countries?
The UK household debt-to-income ratio of approximately 135% of gross disposable income is above the OECD average of around 100% and higher than Germany (approximately 95%), but below the highest-ratio developed economies such as Denmark (approximately 250%) and Australia (approximately 215%). The UK's elevated ratio relative to the OECD average largely reflects the structural feature of high and sustained house prices relative to incomes, which requires proportionally larger mortgage borrowing to achieve homeownership.Where can I get free debt advice if I am struggling?
Free, regulated debt advice is available in the UK through MoneyHelper (the government-backed financial guidance service), StepChange Debt Charity (the UK's leading not-for-profit debt advice organisation), and Citizens Advice. All three provide genuinely independent, fee-free guidance and can help with budgeting, negotiating with creditors, and formal debt solutions including Debt Relief Orders and Individual Voluntary Arrangements. Contacting your lender directly as early as possible, before payments are missed, also typically unlocks the most flexible forbearance and payment arrangement options.
External References
The following authoritative sources were used in researching this article and are recommended for further reading:1. Bank of England - Money and Credit Statistics
https://www.bankofengland.co.uk/statistics/money-and-credit
2. House of Commons Library - Household Debt: Economic Indicators
https://commonslibrary.parliament.uk/research-briefings/sn02885/
3. House of Commons Library - Household Debt: Statistics and Impact on Economy
https://commonslibrary.parliament.uk/research-briefings/cbp-7584/
4. Financial Conduct Authority - Financial Lives Survey 2024
https://www.fca.org.uk/publications/research/financial-lives
5. Insolvency Service - Insolvency Statistics (England and Wales)
https://www.gov.uk/government/organisations/insolvency-service
6. Office for National Statistics - Household Debt (Wealth and Assets Survey)
https://www.ons.gov.uk/peoplepopulationandcommunity/personalandhouseholdfinances/debt
7. NimbleFins - Average Household Debt in the UK 2026
https://www.nimblefins.co.uk/average-household-debt-uk
8. MoneyHelper - Free Debt Advice and Guidance
https://www.moneyhelper.org.uk/en/money-troubles/dealing-with-debt

0 Comments Comments