
Investing
What Is the 52-Week High/Low in Stocks? Complete Guide


Table of Contents
- Why 52 Weeks?
- What Is the 52-Week High and Low? The Core Definition
- The 52-Week Range as a Context Tool
- 52-Week High vs 52-Week Low: The Complete Strategy Comparison
- Why the 52-Week High Matters: The Psychology of Anchoring
- Where to Find 52-Week High/Low Data and How to Use It
- The 52-Week High Breakout Strategy: How Momentum Traders Use It
- Setting Stop Losses on Breakout Trades
- The 52-Week Low: Value Opportunities and Value Traps
- Using Both Signals Together: The Blended Approach
- Limitations and Risks: What the 52-Week High/Low Cannot Tell You
- Conclusion
- Frequently Asked Questions (FAQ)
- External References
Why 52 Weeks?
Open any financial data platform — Yahoo Finance, Bloomberg, the Financial Times, your stockbroker's app — and you will find the 52-week high and 52-week low displayed on the summary page of every publicly traded stock. It appears alongside the current price, the market capitalisation, the dividend yield, and the P/E ratio. It is one of the few data points prominent enough to appear on a stock's default summary view, yet many investors scroll past it without understanding what it tells them — or how seriously the professionals who move markets actually take it.The 52-week high is the highest price at which a stock has traded during the past 52 consecutive weeks, typically rolling to the most recent trading day. The 52-week low is the lowest. Together, they define the stock's one-year trading range and answer the question that is foundational to understanding any investment: where does this stock currently sit relative to where it has been over the past year? Is it near its peak, near its trough, or somewhere in the middle?
What makes these two numbers more than a curiosity is the body of academic research that has accumulated around them since the early 2000s. Thomas George and Chuan-Yang Hwang's landmark paper in the Journal of Finance (2004) — 'The 52-Week High and Momentum Investing' — found that a strategy based on how close a stock is to its 52-week high outperforms pure price momentum strategies in terms of both raw and risk-adjusted returns. Subsequent peer-reviewed research has confirmed that the 52-week low also contains predictive information about future stock returns — and that combining both signals can produce a hedge that nearly doubles the Sharpe ratio of a standard momentum strategy. This guide explains all of this: what the 52-week high and low mean, why they matter, what the research shows, how traders and investors use them in practice, and what the limits and risks of these approaches are.
What Is the 52-Week High and Low? The Core Definition
The 52-week high and low are trailing price statistics that represent the maximum and minimum prices at which a stock, ETF, or other exchange-traded security has traded during the rolling 52-week period ending on the most recent trading day. They are displayed in real time during market hours and updated at the close of each trading session.To be precise about the calculation: on any given trading day, the 52-week high is the highest intraday trading price (not just the closing price) recorded on any day during the preceding 52 weeks, including the current day. If a stock reaches a new intraday price that exceeds its previous 52-week high at any point during the trading day, the 52-week high is immediately updated to reflect that new level. The same logic applies to the 52-week low. Most major financial platforms show both figures in real time during market hours.
For example: a stock with a current price of £45, a 52-week high of £62, and a 52-week low of £32 tells you several things simultaneously. The stock is currently trading at approximately 73% of its 52-week high — down 27% from its peak. It is also approximately 41% above its 52-week low. The range itself — £30 from low to high — indicates a volatile 12-month period. These ratios, and the position of the current price within the 52-week range, are the starting point for the analysis described throughout this guide.
The 52-Week Range as a Context Tool
Beyond the individual high and low data points, the 52-week range as a whole provides immediate context for a stock's recent history. A stock trading at 95% of its 52-week high — very close to the top of its range — is telling you something different from a stock trading at 25% of its range (close to its low). Neither position is inherently better or worse without additional context, but the relative position within the range is the starting point for both momentum analysis (favours stocks near 52-week highs) and value or contrarian analysis (favours stocks near 52-week lows with strong fundamentals).The academic benchmark: 52-week high momentum: 0.65% per month raw return; 1.06% per month outside January (George & Hwang, Journal of Finance, 2004) — the George and Hwang paper analysed US equity data from July 1963 through December 2001 and found that a self-financing 52-week high momentum strategy — long stocks nearest to their 52-week high, short stocks furthest — outperformed both the Jegadeesh-Titman 6-month momentum strategy (0.38%/month) and the Moskowitz-Grinblatt industry momentum strategy (0.25%/month) in risk-adjusted terms.
52-Week High vs 52-Week Low: The Complete Strategy Comparison
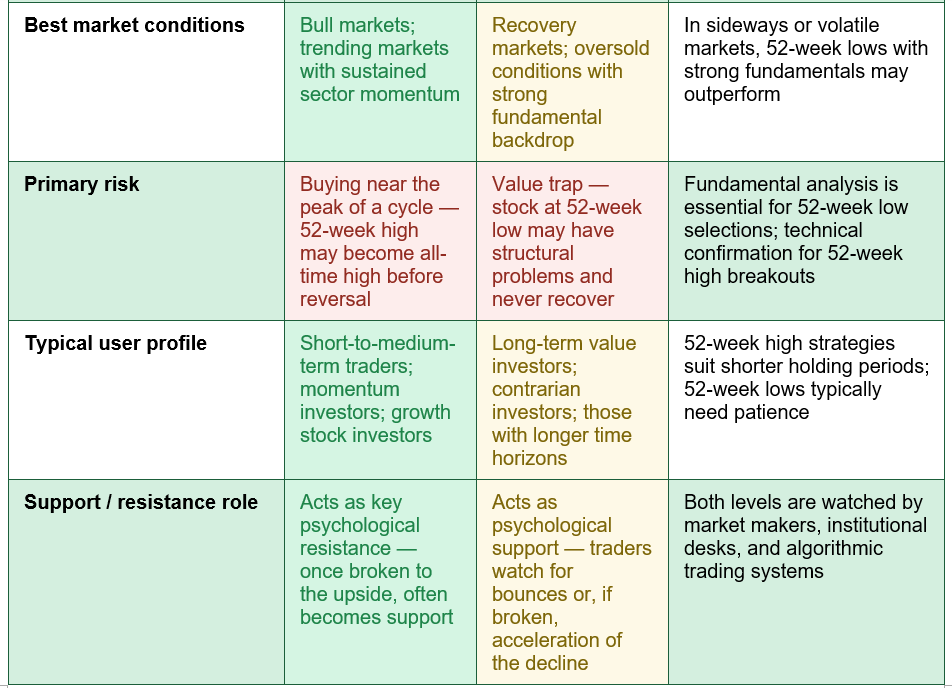
The two major analytical frameworks built around 52-week data — the 52-week high momentum strategy and the 52-week low value/contrarian approach — differ in philosophy, psychological basis, risk profile, and optimal market conditions. The table below provides a comprehensive comparison: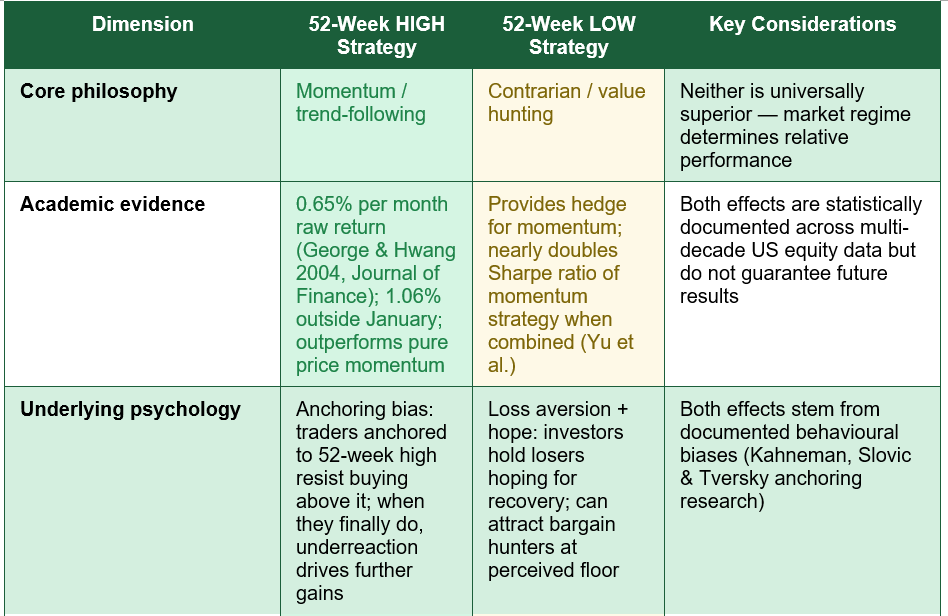
Why the 52-Week High Matters: The Psychology of Anchoring
The explanatory power of George and Hwang's research rests on a psychological mechanism: anchoring bias, first documented by Kahneman, Slovic, and Tversky in their foundational 1982 work on human decision-making under uncertainty. Anchoring bias is the tendency for people to rely too heavily on the first piece of information they encounter when making decisions — the 'anchor' — and to adjust their judgments insufficiently away from it even when new information warrants a larger update.In the context of stock prices, the 52-week high functions as a powerful psychological anchor for market participants. When a stock's price is near its 52-week high, many investors — and this includes professional analysts setting price targets — experience a reluctance to buy because the price 'feels expensive' relative to recent history. They underreact to positive news about the company, anchoring their judgement to the recent high as a reference point for what the stock should be worth. The practical effect, as George and Hwang document, is that good news about stocks near their 52-week highs is incorporated into prices more slowly than it should be — the stock continues to rise as the market gradually catches up. This underreaction is the mechanism that generates the documented momentum premium.
The reverse dynamic operates near the 52-week low. Investors anchored to higher recent prices may be reluctant to sell at what they perceive to be a temporary low, causing them to hold when they should sell. At the same time, value-oriented investors may be attracted to a stock near its 52-week low as a potential bargain. The interplay between these forces creates the support characteristics that the 52-week low is known for in technical analysis.
The January effect and 52-week high momentum: George and Hwang's research found that 52-week high momentum returns are significantly higher outside of January — 1.06% per month versus 0.65% per month including January. This is consistent with the 'January effect' documented in broader momentum research, where tax-loss selling in December depresses prices of recent losers and their recovery in January temporarily weakens momentum strategies. Investors using 52-week high strategies should be aware that performance in January has historically been weaker, and the strongest momentum signal typically operates outside of that month.
Where to Find 52-Week High/Low Data and How to Use It
The 52-week high and low are published and updated in real time across all major financial data platforms. The table below maps the key sources available to both retail and professional investors, with guidance on what each provides and how to use it most effectively: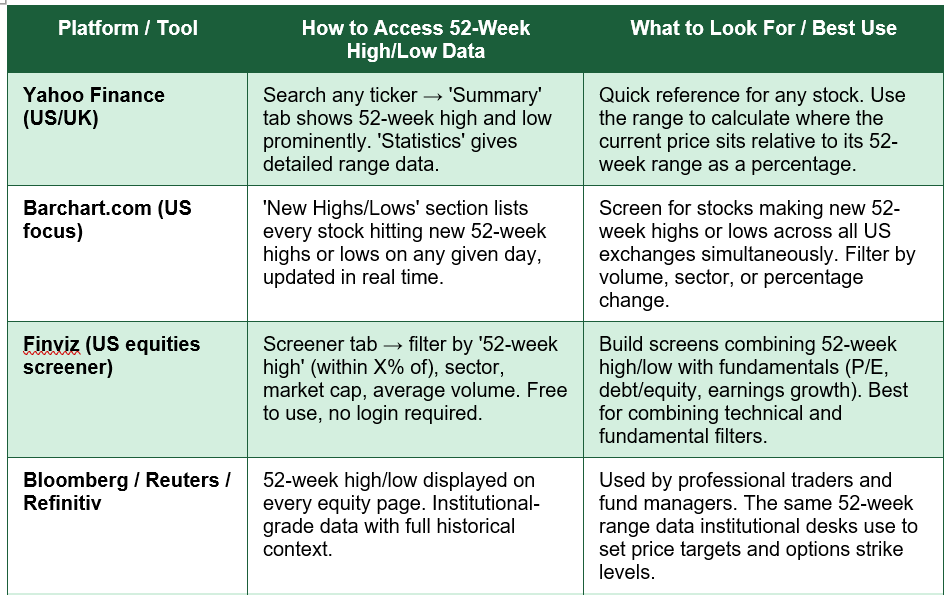
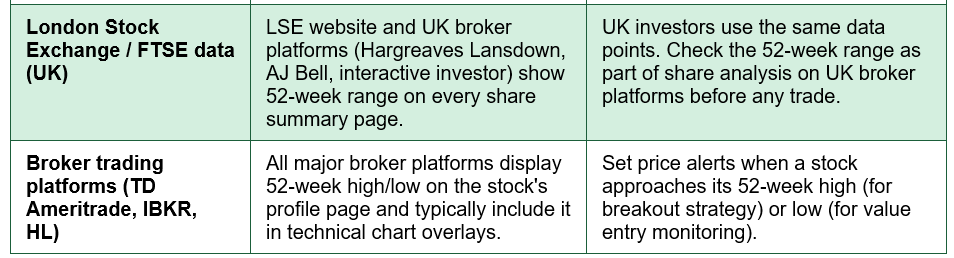
The 52-Week High Breakout Strategy: How Momentum Traders Use It
The most widely used active trading application of the 52-week high is the breakout strategy — buying a stock when it breaks through its 52-week high on high volume, on the hypothesis that the break of this psychologically significant resistance level signals continued upward momentum. The logic is directly tied to the anchoring mechanism: the 52-week high represents a level where many investors who bought earlier are sitting on breakeven positions and who will sell as the price approaches their entry point (creating what technical analysts call 'supply' or resistance). When this supply is exhausted and the price breaks through the level with conviction, the overhang is cleared, and the stock can move freely higher.Volume is the critical confirmation factor. A stock breaking its 52-week high on significantly above-average volume is a meaningfully stronger signal than the same break on below-average volume. High volume at a breakout indicates broad participation and conviction — institutions, funds, and retail investors all buying simultaneously rather than just algorithmic order flow. Low-volume breakouts are more prone to failure and reversal. Most active breakout traders set this as a non-negotiable filter: the volume on the breakout day should be at least 150% to 200% of the average daily volume.
The second key element is the price action leading up to the 52-week high. Stocks that consolidate — trade sideways in a tight range — just below their 52-week high for several weeks before breaking out tend to produce more reliable and more powerful breakouts than stocks that run sharply and immediately into new highs. The consolidation period represents a balance between buyers and sellers at elevated prices; when buyers finally overwhelm sellers and push through the high, the move is typically decisive.
Setting Stop Losses on Breakout Trades
Any active trading strategy around 52-week highs must include a defined exit plan if the trade does not work. The most common approach among breakout traders is to place a stop loss below the breakout level — typically 3% to 8% below the 52-week high price — or below the bottom of the pre-breakout consolidation range. This limits the loss on any individual trade while allowing the position time to develop if the breakout is genuine.THE VOLUME RULE: When a stock breaks its 52-week high, always check that day's volume against the 50-day or 90-day average daily volume. A breakout on volume less than the average daily volume is a technical signal that often fails. Target breakouts on at least 150% of average daily volume as a minimum confirmation threshold — the larger the volume relative to average, the stronger the signal.
The 52-Week Low: Value Opportunities and Value Traps
While the academic research is most definitive about the 52-week high's momentum implications, the 52-week low carries its own set of strategic applications — and its own distinctive risk. A stock at or near its 52-week low has experienced a sustained decline from what was its highest price over the prior year, and is likely carrying some combination of negative sentiment, analyst downgrades, earnings disappointments, or sector-wide pressure.The contrarian investor's case for examining 52-week lows rests on two foundations. First, the behavioural finance literature documents that stocks can be oversold beyond what fundamentals justify when negative sentiment peaks — the same anchoring mechanism that causes underreaction to good news near 52-week highs can cause overreaction to bad news near 52-week lows, creating potential mispricing. Second, the peer-reviewed research by Yu and colleagues found that including 52-week low information as a hedge to a pure momentum strategy nearly doubles the Sharpe ratio of the combined approach — suggesting the 52-week low contains real, independently useful information.
The critical risk at the 52-week low is the value trap: a stock that appears cheap relative to its recent price history but has genuinely deteriorated fundamentally and will not recover. Many stocks at 52-week lows are there for good reason — a competitive disruption, a failed product, a regulatory sanction, a deteriorating balance sheet, or a sector in structural decline. Unlike a 52-week high, where the stock's recent price history suggests strength, a 52-week low can reflect either a temporary setback in a fundamentally sound business or the beginning of a long terminal decline.
THE VALUE TRAP WARNING: A stock at its 52-week low is not automatically cheap or a buying opportunity. Many stocks at 52-week lows are there because their businesses have deteriorated — earnings are falling, debt is rising, or the competitive landscape has permanently shifted against them. 'Many stocks remain at 52-week lows for years without recovery. This is why fundamental analysis is non-negotiable,' as Swastika Investmart's 2026 market analysis states. Before buying any stock near its 52-week low on a contrarian thesis, verify: Is the underlying business profitable? Is the balance sheet solvent? What has specifically caused the decline? Is the decline sector-wide or company-specific?
Using Both Signals Together: The Blended Approach
The most sophisticated application of 52-week high and low data does not choose one signal over the other — it uses both in a coordinated framework that takes advantage of the documented academic properties of each. The peer-reviewed research by Yu and colleagues confirmed that combining nearness-to-52-week-low information with a momentum strategy provides a hedge for the momentum strategy — significantly improving the risk-adjusted return profile compared with either signal used in isolation.In practical terms, the blended approach operates as follows: a portfolio manager or analyst screens for stocks near their 52-week highs with strong momentum indicators as candidates for long positions (the momentum leg), and simultaneously screens for stocks near their 52-week lows with strong fundamental metrics as candidates for a second, separately managed set of positions (the value/contrarian leg). The two legs behave differently in different market regimes: the momentum leg performs best in sustained bull markets, while the value/contrarian leg has historically provided positive returns during market reversals when momentum strategies suffer their worst drawdowns.
In 2026, smart investors increasingly use a blended approach as highlighted by Swastika Investmart's market analysis: 'In trending bull markets, 52-week high strategies tend to outperform as capital chases winners. In volatile or sideways markets, selective 52-week low investing may deliver better long-term returns if backed by strong fundamentals. Smart investors in 2026 increasingly use a blended approach.' This does not require complex technology — it requires using both screeners consistently and applying rigorous fundamental filters to the 52-week low candidates while using volume and momentum filters on the 52-week high candidates.
Limitations and Risks: What the 52-Week High/Low Cannot Tell You
The academic evidence for the predictive power of 52-week high and low data is robust across multi-decade periods, but it comes with important caveats that every investor should understand before making decisions based on these signals:- Past performance: The documented returns from 52-week high momentum strategies were measured in historical data from July 1963 through December 2001 in the original George and Hwang study. Markets, trading mechanisms, and the composition of market participants have changed significantly since then. Algorithmic trading, high-frequency trading, and the proliferation of momentum ETFs have altered how quickly price signals are incorporated into prices, potentially reducing the scale of the documented anomaly.
- Transaction costs: The theoretical strategy described in academic research — going long the stocks nearest to their 52-week highs and short those furthest away — involves transaction costs that can substantially reduce or eliminate net returns, particularly for retail investors. The gross return figures from research should not be interpreted as net returns achievable in practice.
- The 52-week high changes daily: Because the 52-week high is a rolling calculation, a stock that was at its 52-week high last month may be 20% below it today if the market has moved. The relevance of the signal is continuous and context-dependent, not a fixed label.
- Context dependence: A 52-week high in a sector where all stocks are rising is meaningfully different from a 52-week high reached while the broader market is declining. Sector context, market regime, and macroeconomic conditions all affect the interpretation of the signal.
- Not a standalone signal: No investment research article or financial professional recommends using the 52-week high or low as a standalone buy or sell signal without additional context from fundamental analysis, sector analysis, broader market conditions, and risk management parameters.
Conclusion
The 52-week high and low are among the most widely displayed and most consistently misunderstood data points in financial markets. They are not merely historical curiosities or data that platforms display by convention — they are levels at which documented psychological forces operate, that peer-reviewed academic research has shown to contain genuine predictive information about future stock returns, and that professional traders, institutional investors, and algorithmic trading systems actively monitor and respond to.George and Hwang's landmark 2004 Journal of Finance paper established that a strategy based on proximity to the 52-week high yields 0.65% per month in raw returns — outperforming both pure price momentum and industry momentum strategies. Outside of January, this rises to 1.06% per month. The mechanism is anchoring bias: investors underreact to positive information about stocks near their 52-week highs, causing price continuation that the market gradually corrects. Subsequent research has shown that the 52-week low contains complementary information — particularly as a hedge for momentum strategies — that improves risk-adjusted returns when both signals are used together.
For practical investors, the most important takeaways from this guide are: understand where a stock currently sits within its 52-week range as a fundamental contextual data point before any trade; use high volume as the essential confirmation requirement for 52-week high breakout strategies; apply rigorous fundamental analysis before acting on any 52-week low — the value trap risk is real and documented; be aware of the January effect in momentum strategies; and recognise that neither signal is sufficient on its own. The 52-week high and low are tools — powerful ones, backed by serious research — but they are most effective when used within a framework that also includes fundamental analysis, risk management, and awareness of the broader market environment.
Frequently Asked Questions (FAQ)
What does the 52-week high mean for a stock?
The 52-week high is the highest price at which a stock has traded during the past 52 consecutive weeks (one year), updated on a rolling daily basis. It represents the peak of recent price performance and serves as a key psychological reference point for both buyers and sellers. In technical analysis, the 52-week high frequently acts as a resistance level — a price zone where selling pressure has historically exceeded buying pressure — until the stock breaks through it with sufficient volume and conviction, at which point the former resistance often becomes support. Stocks trading near their 52-week highs have academic evidence suggesting continued near-term outperformance (George & Hwang, 2004), driven by anchoring bias that causes investors to underreact to positive news at elevated prices.Is it good or bad when a stock hits a 52-week high?
A stock hitting a new 52-week high is neither inherently good nor bad — context determines whether it is a signal to act on. In a strong bull market with positive company fundamentals and high volume supporting the new high, breaking the 52-week high can signal continued momentum — the academic research supports the idea that such stocks tend to outperform on average over the following months. However, it could also represent the peak of a cycle, particularly if the move has been driven by market-wide speculation or if valuations have stretched beyond what fundamentals support. A stock at a 52-week high in a sector-wide declining market, or accompanied by low volume, is a weaker and less reliable signal. Always combine the 52-week high data point with fundamental analysis and volume confirmation.Should I buy a stock near its 52-week low?
A stock near its 52-week low requires extremely careful analysis before any purchase decision. The key question is why the stock is at its 52-week low. If the decline reflects a temporary, external factor (broader market sell-off, short-term sector rotation) affecting a fundamentally sound business with growing earnings, low debt, and a durable competitive position, the 52-week low may represent a genuine value opportunity. If the decline reflects deteriorating fundamentals — falling earnings, rising debt, competitive disruption, or a regulatory problem — the stock is likely a value trap and could decline further or remain depressed for years. Research by Swastika Investmart's 2026 analysis explicitly states: 'Many stocks remain at 52-week lows for years without recovery. This is why fundamental analysis is non-negotiable.' Never buy a stock solely because it is near its 52-week low.How do I calculate where a stock is within its 52-week range?
The standard formula for calculating a stock's position within its 52-week range as a percentage is: (Current Price − 52-Week Low) ÷ (52-Week High − 52-Week Low) × 100. For example, a stock with a current price of £45, a 52-week low of £30, and a 52-week high of £60 sits at: (£45 − £30) ÷ (£60 − £30) × 100 = £15 ÷ £30 × 100 = 50% of its 52-week range. A stock at 80% to 100% of its 52-week range is near its high; a stock at 0% to 20% of its range is near its low. This percentage position, rather than the raw price data, is the metric used in the George and Hwang academic research to rank stocks by proximity to their 52-week highs.Where can I see which stocks are hitting 52-week highs or lows today?
Multiple financial platforms publish daily lists of stocks hitting new 52-week highs or lows. In the US, Barchart.com's 'New Highs/Lows' section provides real-time, filterable lists of all stocks making new 52-week highs or lows across all US exchanges, updated continuously during market hours. Yahoo Finance's 'Markets' section includes daily high/low lists. Finviz allows screeners filtered by proximity to 52-week highs or lows combined with other fundamental and technical filters. For UK stocks, the London Stock Exchange website, Hargreaves Lansdown, and interactive investor all display 52-week range data on individual stock pages. Bloomberg and Reuters provide institutional-grade screening tools. Most full-service broker platforms also allow alerts to be set when any stock in a watchlist approaches its 52-week high or low.External References
1. George, T.J. and Hwang, C-Y. (2004) — The 52-Week High and Momentum Investing. Journal of Finance, Vol. 59, No. 5 (the foundational academic paper on this topic)https://www.bauer.uh.edu/tgeorge/papers/gh4-paper.pdf
2. Yu, H. et al. — Nearness to the 52-Week High and Low Prices, Past Returns, and Average Stock Returns (peer-reviewed research confirming Sharpe ratio doubling from combined strategy)
https://acfr.aut.ac.nz/__data/assets/pdf_file/0011/56468/657406-H-Yu-Nearness-to-the-52-week-high-and-low-prices,-past-returns,-and-average-stock-returns.pdf
3. Barchart.com — 52-Week New Highs and New Lows (live US equity data, updated in real time)
https://www.barchart.com/stocks/highs-lows
4. Finviz — Stock Screener with 52-Week High/Low Filters (free to use)
https://finviz.com/screener.ashx
5. Vested Finance — 52-Week High and Low: Meaning, Importance and Trading Tips (educational guide)
https://vestedfinance.com/blog/us-stocks/what-is-52-week-high-low/
6. Swastika Investmart — 52-Week High vs 52-Week Low Strategy in 2026 (2026 market analysis)
https://www.swastika.co.in/blog/52-week-high-vs-52-week-low-strategy-in-2026-which-works-better-for-indian-investors
7. Quantified Strategies — 52-Week High Trading Strategy: Backtest and Example (backtest results, December 2025)
https://quantifiedstrategies.substack.com/p/52-week-high-trading-strategy-backtest
8. Yahoo Finance — 52-Week High/Low Data for any US or UK Listed Stock (free)
https://finance.yahoo.com/
0 Comments
Be the first to share your thoughts on this article.