
Investing
What Is Volatility? The Basics Every Investor Must Know

The VIX hit 31 in March 2026. It briefly hit 60 in April 2025. The S&P 500 still averaged 11.47%/year from 1986 to 2025. Volatility is not the enemy. Not understanding it might be. Markets have been swinging. Headlines have been loud. You have probably heard the word ‘volatility’ more times in the past twelve months than in the ten years before that. In April 2025, the VIX — the market’s real-time fear gauge — briefly went above 60 as investors panicked over global tariffs. On March 29, 2026, it stood at 31.05 — above the threshold that signals something has genuinely rattled markets. And yet here is what most of the coverage of those moments does not tell you: the S&P 500 returned an average of 11.47% per year from 1986 to 2025, through every volatility spike in that entire period. Volatility and long-term returns coexisted. They always have. This article is for the investor who has been watching their portfolio swing and wondering whether they understand what they are actually looking at. It covers what volatility is, how it is measured, what the VIX is and how to read it, the different types of volatility that matter, and the specific misconceptions that cause investors to make their most expensive mistakes during volatile periods. No jargon. Just the basics that Wall Street does not always take the time to explain.
Brian Kinahan, R.W. Baird (July 2025): 'When we talk about market volatility or the volatility of a stock price, we're really talking about how varied the returns are over time.' S&P 500 average annual return 1986-2025: 11.47% (Hartford Funds) — through every major volatility episode. 2025 volatility: only 22% of trading days had +/-1% swings (Hartford Funds). Volatility = how much a price moves around, not which direction it moves. High volatility ≠ falling market. Low volatility ≠ safe market. A market can be volatile and rising, or calm and slowly declining. What volatility tells you is how smooth or choppy the ride is — not where you are headed. For a long-term investor, volatility is the price of admission for higher returns. Hartford Funds' data shows S&P 500 averaged 11.47%/year from 1986-2025 — through every major volatility episode. The discomfort is real. The long-run return was real too.
Historical volatility: backward-looking, based on standard deviation of actual returns (mathematical definition). Implied volatility: forward-looking, derived from options prices — what traders expect NEXT. The VIX is a real-time implied volatility index. VIX long-term average (median): 17.63; typical range: 11.05-25.83 (GuruFocus/Cboe historical data). Standard deviation in plain English: if a stock returns roughly the same amount every day, its standard deviation is low. If it lurches up one day and plunges the next, its standard deviation is high. Volatility is just that: a measure of how much the return lurches. The VIX is the market's best guess at how much the S&P 500 will lurch over the next 30 days. You do not need to calculate standard deviation to use volatility information. The VIX does it for the whole US large-cap market in one number, updated in real time. Check it before making any significant portfolio decision during a period of market stress — it tells you whether markets are in a calm or a storm.
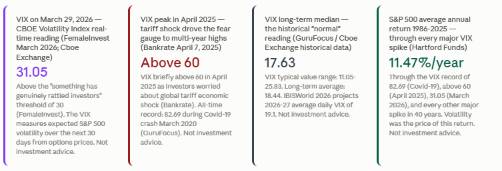
VIX on March 29, 2026: 31.05 (FemaleInvest March 2026). VIX briefly above 60 in April 2025 (tariff shock, Bankrate). VIX record high: 82.69 (Covid-19 crisis March 2020). VIX long-term median: 17.63; typical range: 11.05-25.83 (GuruFocus/Cboe). IBISWorld 2026: projected average daily VIX of 19.1 in 2026-27.
The VIX is calculated from how much investors are paying for S&P 500 options. When fear is high, people pay more for insurance against losses — and the VIX rises. When the market is calm, insurance is cheap — and the VIX falls. It is the price of market insurance expressed as a single fear number.
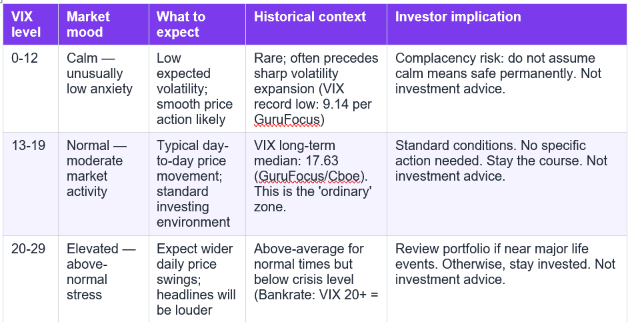
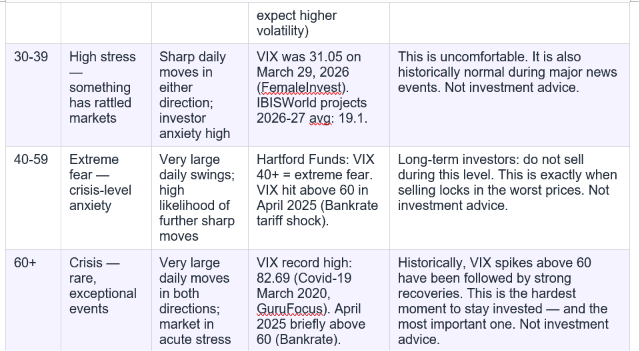
Reading the VIX: 0-12 = calm; 13-19 = normal; 20-29 = elevated stress (expect choppier markets); 30+ = something has rattled investors; 40+ = extreme fear (Hartford Funds). The VIX does NOT tell you whether the market will rise or fall — only how much movement is expected.
Historical (realised) volatility: backward-looking, calculated from past returns. Implied volatility: forward-looking, derived from options prices. Portfolio volatility: can be lower than individual component volatility through diversification (correlation benefit). VIX = implied volatility of the S&P 500 over next 30 days (Bankrate; Cboe). The key practical distinction: historical volatility tells you where the market HAS been choppy. Implied volatility (VIX) tells you where traders EXPECT choppiness to come. Both are useful. The VIX is more actionable for current decisions because it reflects present expectations rather than past history.
Diversification reduces portfolio volatility by combining assets that do not all move together. When some assets fall, others may hold steady or rise — smoothing the overall ride. This is why a mix of stocks, bonds, and other asset classes typically produces lower portfolio volatility than stocks alone.
VIX does NOT predict direction (Bankrate; April 2026 analysis). Hartford Funds: 'volatility could provide the opportunity for higher returns' for investors who can withstand day-to-day discomfort. S&P 500 returned 11.47%/year average 1986-2025 through all volatility events (Hartford Funds). Not investment advice.
Volatility ≠ loss. Volatility ≠ danger. Volatility = movement. The same way a stormy sea and a calm sea can both take you to the same destination, a volatile market and a calm market can both deliver long-term returns. The storm is uncomfortable. It is not a reason to get off the boat. If market volatility is making you want to sell, check the VIX level first. If you are at the same VIX level as the S&P 500's 11.47% average annual return years, you are at normal discomfort for a historically productive environment. Selling during volatility typically locks in temporary losses as permanent ones.
“ Expert view: Hartford Funds: 'While investing in the stock market has its ups and downs, the longer an investor stays invested, the less significant those bumps in the road appear.' S&P 500 returned 11.47% per year average from 1986-2025 — through every major volatility episode including the Covid-19 crash (VIX 82.69), the 2008 financial crisis, and the 2025 tariff shock.
The most reliable response to volatility for most investors is: nothing. Continue your regular investment contributions. Do not check the portfolio value every day during high-VIX periods. Set a review date. Show up to it. The VIX will have moved by then — and your portfolio will still be in the market when it does.
Volatility is how much an investment's price moves around over time. Brian Kinahan at R.W. Baird put it plainly in July 2025: 'When we talk about market volatility or the volatility of a stock price, we're really talking about how varied the returns are over time.' A stock that goes up 1% one day and down 1% the next has higher volatility than one that moves 0.1% in either direction. Volatility is not the same as a decline — a highly volatile market can be moving sharply upward. It is a measure of the size of movements, not their direction.
What is the VIX and how do you read it?
The VIX is the CBOE Volatility Index — a real-time measure of how much volatility the market expects over the next 30 days, calculated from the prices of options on the S&P 500. Bankrate describes it as measuring 'the stock market's expectation for volatility over the next 30 days based on option prices.' FemaleInvest calls it 'a weather forecast for market turbulence.' Reading it: 0-12 = low volatility; 13-19 = normal; 20-29 = elevated stress; 30+ = high anxiety; 40+ = extreme fear (Hartford Funds); 60+ = crisis level. On March 29, 2026, the VIX was 31.05. In April 2025, it briefly hit 60. The long-term median is 17.63 (GuruFocus). The VIX does not predict whether the market will go up or down — only how much movement is expected.
Does high volatility mean I should sell my investments?
In most cases, no — and the data suggests selling during high volatility is one of the most costly mistakes a long-term investor can make. Hartford Funds' analysis of S&P 500 data from 1986 to 2025 found an average annual return of 11.47% per year through every major volatility spike in that period, including the VIX reaching 82.69 during Covid-19 and briefly surpassing 60 in April 2025. The research consistently shows that missing the best market days — which tend to cluster around the most volatile periods — dramatically reduces long-term returns. Hartford Funds: 'The longer an investor stays invested, the less significant those bumps in the road appear.' If you are close to a major withdrawal or life event in the next 1-3 years, a portfolio review with a financial adviser is appropriate during elevated volatility.
What is the difference between historical and implied volatility?
Historical volatility (also called realised volatility) looks backward: it is calculated from actual past price movements and tells you how volatile an asset has been over a defined previous period. Implied volatility looks forward: it is derived from current options prices and tells you how much the market expects an asset to move in the future. The VIX is a measure of implied volatility for the S&P 500 over the next 30 days. As one April 2026 analysis explains: 'Implied volatility represents the market's forecast of a likely movement in the stock's price and is embedded in the premiums paid for options contracts.' The practical difference: historical volatility describes the past; implied volatility (VIX) describes current expectations.
Why does the VIX go up when markets fall?
When markets fall sharply, investors rush to buy put options — financial contracts that protect against further losses, essentially insurance for their portfolios. When lots of people want the same insurance at the same time, the price of that insurance rises. The VIX measures how much investors are paying for this insurance, so it rises when people are most afraid. FemaleInvest's March 2026 explanation captures the mechanism: 'When investors get nervous, they buy protective options to hedge against losses. The more they pay for these options, the higher the VIX goes. So the index ends up moving in the opposite direction to stock prices: when markets fall sharply, the VIX tends to spike.
Table of Contents
- What Volatility Actually Means — Not What It Sounds Like
- How Volatility Is Measured: Standard Deviation and the VIX
- The VIX: The Market’s Fear Gauge Explained
- Types of Volatility Every Investor Should Know
- What Volatility Is Not: Common Misconceptions
- The VIX Reading Guide: What Each Level Actually Means
- Why Volatility Is the Price of Long-Term Returns
- How Investors Can Respond to Volatility
- Conclusion: The Basics Investors Needed Years Ago
- Frequently Asked Questions
What Volatility Actually Means — Not What It Sounds Like
The word ‘volatility’ gets thrown around in financial news like it is synonymous with ‘danger’ or ‘crash.’ It is not. Brian Kinahan at R.W. Baird, speaking in a July 2025 interview during one of the most turbulent market years in recent memory, offered the clearest definition available: ‘When we talk about market volatility or the volatility of a stock price, we’re really talking about how varied the returns are over time.’ That is the whole definition. Varied returns. A stock that goes up 3%, then down 2%, then up 4%, then down 5% in successive weeks has high volatility — not because it is going down, but because it is moving around a lot. A stock that goes up 0.5% every single week for a year has low volatility — even though its returns are entirely positive. The critical distinction: volatility measures the size and frequency of price movements, not their direction. A highly volatile market can go sharply upward. A calm market can grind slowly downward. Hartford Funds’ volatility analysis confirms the long-run relationship: from 1986 to 2025, the S&P 500 Index returned an average of 11.47% per year despite going through every major volatility episode of the last four decades — the Black Monday crash of 1987, the dot-com bust, the 2008 financial crisis, the Covid-19 crash, and the 2025 tariff shock. Volatility was present in every one of those years. It did not prevent the long-term return.Brian Kinahan, R.W. Baird (July 2025): 'When we talk about market volatility or the volatility of a stock price, we're really talking about how varied the returns are over time.' S&P 500 average annual return 1986-2025: 11.47% (Hartford Funds) — through every major volatility episode. 2025 volatility: only 22% of trading days had +/-1% swings (Hartford Funds). Volatility = how much a price moves around, not which direction it moves. High volatility ≠ falling market. Low volatility ≠ safe market. A market can be volatile and rising, or calm and slowly declining. What volatility tells you is how smooth or choppy the ride is — not where you are headed. For a long-term investor, volatility is the price of admission for higher returns. Hartford Funds' data shows S&P 500 averaged 11.47%/year from 1986-2025 — through every major volatility episode. The discomfort is real. The long-run return was real too.
How Volatility Is Measured: Standard Deviation and the VIX
Volatility has a precise mathematical definition. In finance, it is typically measured as the standard deviation of returns over a given time period. Standard deviation measures how spread out a set of numbers is around their average. A stock with returns of exactly 1% every day for a month has a standard deviation of zero — perfectly predictable, zero volatility. A stock with returns of +10%, -8%, +6%, -12%, +9% in successive days has a very high standard deviation — high volatility. The standard deviation approach measures what has already happened: it looks backward at actual historical returns. This is called historical volatility or realised volatility. But investors also care about what is coming next. That is where implied volatility comes in — and specifically, where the VIX enters the picture. As one April 2026 analysis explains: ‘Implied volatility represents the market’s forecast of a likely movement in the stock’s price and is embedded in the premiums paid for options contracts.’ Implied volatility is derived from options prices: the more people pay for insurance against market swings, the more implied volatility rises. The VIX captures this in a single number that updates in real time.Historical volatility: backward-looking, based on standard deviation of actual returns (mathematical definition). Implied volatility: forward-looking, derived from options prices — what traders expect NEXT. The VIX is a real-time implied volatility index. VIX long-term average (median): 17.63; typical range: 11.05-25.83 (GuruFocus/Cboe historical data). Standard deviation in plain English: if a stock returns roughly the same amount every day, its standard deviation is low. If it lurches up one day and plunges the next, its standard deviation is high. Volatility is just that: a measure of how much the return lurches. The VIX is the market's best guess at how much the S&P 500 will lurch over the next 30 days. You do not need to calculate standard deviation to use volatility information. The VIX does it for the whole US large-cap market in one number, updated in real time. Check it before making any significant portfolio decision during a period of market stress — it tells you whether markets are in a calm or a storm.
The VIX: The Market’s Fear Gauge Explained
The CBOE Volatility Index, universally known as the VIX, is the most widely cited single-number measure of market volatility in the world. Bankrate’s definition is standard: ‘The VIX is an index run by the Chicago Board Options Exchange that measures the stock market’s expectation for volatility over the next 30 days based on option prices for the S&P 500 stock index.’ The VIX was first introduced in 1993. It is sometimes called the ‘fear index’ because it captures the market’s collective anxiety in a single real-time number. FemaleInvest’s March 2026 explainer captures the mechanism elegantly: ‘When investors get nervous, they buy protective options to hedge against losses. The more they pay for these options, the higher the VIX goes. So the index ends up moving in the opposite direction to stock prices: when markets fall sharply, the VIX tends to spike.’ The VIX is forward-looking: it does not measure what has already happened; it measures what traders currently expect to happen over the next thirty days. FemaleInvest describes it as ‘a weather forecast for market turbulence’ — not the storm itself, but the expectation of one. On March 29, 2026, the VIX stood at 31.05 — above the threshold FemaleInvest identifies as meaning ‘something has genuinely rattled investors.’ In April 2025, the VIX briefly surpassed 60 as tariff-shock fears gripped markets (Bankrate). The VIX record high was 82.69, reached during the Covid-19 market crisis in March 2020. The long-term median is 17.63.VIX on March 29, 2026: 31.05 (FemaleInvest March 2026). VIX briefly above 60 in April 2025 (tariff shock, Bankrate). VIX record high: 82.69 (Covid-19 crisis March 2020). VIX long-term median: 17.63; typical range: 11.05-25.83 (GuruFocus/Cboe). IBISWorld 2026: projected average daily VIX of 19.1 in 2026-27.
The VIX is calculated from how much investors are paying for S&P 500 options. When fear is high, people pay more for insurance against losses — and the VIX rises. When the market is calm, insurance is cheap — and the VIX falls. It is the price of market insurance expressed as a single fear number.
Reading the VIX: 0-12 = calm; 13-19 = normal; 20-29 = elevated stress (expect choppier markets); 30+ = something has rattled investors; 40+ = extreme fear (Hartford Funds). The VIX does NOT tell you whether the market will rise or fall — only how much movement is expected.
Types of Volatility Every Investor Should Know
The word ‘volatility’ is used in several overlapping ways in financial markets, and it is worth distinguishing them before they create confusion. Historical volatility (also called realised volatility) is backward-looking: it is calculated from actual past price movements and tells you how much a stock or index has moved over a defined previous period. It answers the question: how volatile was this asset? Implied volatility is forward-looking: it is extracted from current options prices and tells you how much the market currently expects the asset to move over a future period. The VIX is the most famous example of implied volatility. It answers the question: how volatile does the market expect the S&P 500 to be over the next 30 days? As one April 2026 analysis explains: ‘Unlike traditional stock indices that track price movements, the VIX captures the market’s collective mood.’ Portfolio volatility refers to the overall volatility of a combined investment portfolio — which can be lower than the volatility of individual holdings if those holdings move independently of each other (diversification). This is the basis of the principle that combining assets with low correlation to each other reduces overall portfolio risk even when each individual asset carries high volatility. Idiosyncratic volatility refers to the volatility specific to a single company or sector, as opposed to systemic volatility that affects the whole market.Historical (realised) volatility: backward-looking, calculated from past returns. Implied volatility: forward-looking, derived from options prices. Portfolio volatility: can be lower than individual component volatility through diversification (correlation benefit). VIX = implied volatility of the S&P 500 over next 30 days (Bankrate; Cboe). The key practical distinction: historical volatility tells you where the market HAS been choppy. Implied volatility (VIX) tells you where traders EXPECT choppiness to come. Both are useful. The VIX is more actionable for current decisions because it reflects present expectations rather than past history.
Diversification reduces portfolio volatility by combining assets that do not all move together. When some assets fall, others may hold steady or rise — smoothing the overall ride. This is why a mix of stocks, bonds, and other asset classes typically produces lower portfolio volatility than stocks alone.
What Volatility Is Not: Common Misconceptions
Financial media creates consistent confusion about volatility by using the word as a synonym for loss, crisis, or danger. This conflation causes more damage to investors’ long-term returns than almost any other single misunderstanding. Misconception 1: Volatility means the market is falling. It does not. Volatility measures movement. When the VIX was at 31.05 on March 29, 2026, the market had been moving sharply. That movement could be in either direction. The VIX does not distinguish between sharp upward moves and sharp downward moves — both register as volatility. Misconception 2: Low volatility means safety. Also false. A market with extremely low volatility can be building up suppressed risk that eventually releases all at once — a phenomenon sometimes called a ‘volatility compression and expansion’ cycle. Periods of unusually low VIX (below 12) have historically been followed by spikes, not continued calm. Misconception 3: High volatility means it is a bad time to invest. Baird’s expert notes that individual investors ‘do have tools at their disposal to try to take advantage of the movement in the market.’ Hartford Funds’ analysis makes the case: ‘If you’re able to put aside the day-to-day discomfort of market volatility, it could provide the opportunity for higher returns.’ Misconception 4: The VIX predicts market direction. Bankrate specifically clarifies: ‘The VIX is not a direct predictor of market direction. The VIX indicates expected volatility, not whether the market will rise or fall.VIX does NOT predict direction (Bankrate; April 2026 analysis). Hartford Funds: 'volatility could provide the opportunity for higher returns' for investors who can withstand day-to-day discomfort. S&P 500 returned 11.47%/year average 1986-2025 through all volatility events (Hartford Funds). Not investment advice.
Volatility ≠ loss. Volatility ≠ danger. Volatility = movement. The same way a stormy sea and a calm sea can both take you to the same destination, a volatile market and a calm market can both deliver long-term returns. The storm is uncomfortable. It is not a reason to get off the boat. If market volatility is making you want to sell, check the VIX level first. If you are at the same VIX level as the S&P 500's 11.47% average annual return years, you are at normal discomfort for a historically productive environment. Selling during volatility typically locks in temporary losses as permanent ones.
The VIX Reading Guide: What Each Level Actually Means
The VIX is useful to individual investors as a real-time barometer of market anxiety. The following guide consolidates the level interpretations from Bankrate, FemaleInvest, and Hartford Funds into a practical quick-reference.
Why Volatility Is the Price of Long-Term Returns
This is the insight that changes how volatility feels once it lands. Hartford Funds’ analysis of S&P 500 data from 1986 to 2025 found an average annual return of 11.47% per year. That 11.47% came with a VIX that periodically hit 82, briefly hit 60, and regularly crossed 30. The return and the volatility were inseparable. This is not a coincidence. It is a structural feature of capital markets. Assets that carry uncertainty — that can go up or down — must offer higher expected returns than assets that are certain. If stocks offered 1% per year with no volatility and cash offered 0% with no volatility, everyone would own stocks. The higher expected return of stocks exists because they might fall in any given year. The possibility of falling is what creates the return premium over cash. Hartford Funds frames the trade-off directly: ‘If you’re able to put aside the day-to-day discomfort of market volatility, it could provide the opportunity for higher returns.’ The R.W. Baird expert makes the complementary point: volatility is something individual investors can potentially use, not just endure. ‘Individual investors do have tools at their disposal to try to take advantage of the movement in the market.’ The practical implication: volatility is the price of the S&P 500’s 11.47% long-run return. You either pay the price by staying invested through the uncomfortable periods, or you avoid it by staying in cash — and accept the near-certainty of losing to inflation over time.“ Expert view: Hartford Funds: 'While investing in the stock market has its ups and downs, the longer an investor stays invested, the less significant those bumps in the road appear.' S&P 500 returned 11.47% per year average from 1986-2025 — through every major volatility episode including the Covid-19 crash (VIX 82.69), the 2008 financial crisis, and the 2025 tariff shock.
How Investors Can Respond to Volatility
The worst response to volatility is also the most common one: panic selling during the peak of anxiety, which locks in temporary paper losses as permanent realised losses. Hartford Funds’ research is direct on this point: ‘The longer an investor stays invested, the less significant those bumps in the road appear.’ There are, however, constructive responses that neither ignore volatility nor surrender to it. For long-term investors: the primary response to volatility is no action beyond maintaining the original investment plan and contribution schedule. Regular investing (DCA) during volatile periods automatically buys more shares at lower prices — a mechanical advantage of consistency over timing. For investors approaching major withdrawals or life events within the next 1-3 years: volatility is a legitimate signal to review the balance between growth-oriented and lower-volatility assets. Hartford Funds recommends: ‘If market volatility makes you uncomfortable, you can work with a financial professional to include investments in your portfolio that specifically seek to help minimize volatility — without abandoning growth-oriented investments.’ For the small minority of investors who can deploy genuine contrarian strategy: Baird’s expert notes that individual investors do have tools to potentially take advantage of market movement. This is not a strategy for most people. Consistent investing through volatility outperforms almost every attempt to capitalise on it in practice.The most reliable response to volatility for most investors is: nothing. Continue your regular investment contributions. Do not check the portfolio value every day during high-VIX periods. Set a review date. Show up to it. The VIX will have moved by then — and your portfolio will still be in the market when it does.
Conclusion
The VIX briefly surpassed 60 in April 2025. It stood at 31.05 on March 29, 2026. In both moments, financial media coverage used the word ‘volatility’ hundreds of times per day in contexts that implied it meant crisis, catastrophe, or the end of markets as a viable wealth-building vehicle. None of those meanings are accurate. Volatility means varied returns over time. The VIX measures what traders expect that variation to be over the next thirty days. High readings indicate anxiety; they do not predict direction. And the S&P 500 averaged 11.47% per year from 1986 to 2025 through every high-VIX moment in that 40-year period. The basics covered in this article — the definition of volatility, the standard deviation measure, the VIX and how to read it, historical versus implied volatility, the misconceptions that cause expensive mistakes, and the relationship between volatility and long-term returns — are the context that allows you to watch the VIX move and understand what you are actually seeing. That understanding is the difference between a reflex and a decision. And in investing, the difference between a reflex and a decision is often measured in returns.Frequently Asked Questions
What is volatility in simple terms?Volatility is how much an investment's price moves around over time. Brian Kinahan at R.W. Baird put it plainly in July 2025: 'When we talk about market volatility or the volatility of a stock price, we're really talking about how varied the returns are over time.' A stock that goes up 1% one day and down 1% the next has higher volatility than one that moves 0.1% in either direction. Volatility is not the same as a decline — a highly volatile market can be moving sharply upward. It is a measure of the size of movements, not their direction.
What is the VIX and how do you read it?
The VIX is the CBOE Volatility Index — a real-time measure of how much volatility the market expects over the next 30 days, calculated from the prices of options on the S&P 500. Bankrate describes it as measuring 'the stock market's expectation for volatility over the next 30 days based on option prices.' FemaleInvest calls it 'a weather forecast for market turbulence.' Reading it: 0-12 = low volatility; 13-19 = normal; 20-29 = elevated stress; 30+ = high anxiety; 40+ = extreme fear (Hartford Funds); 60+ = crisis level. On March 29, 2026, the VIX was 31.05. In April 2025, it briefly hit 60. The long-term median is 17.63 (GuruFocus). The VIX does not predict whether the market will go up or down — only how much movement is expected.
Does high volatility mean I should sell my investments?
In most cases, no — and the data suggests selling during high volatility is one of the most costly mistakes a long-term investor can make. Hartford Funds' analysis of S&P 500 data from 1986 to 2025 found an average annual return of 11.47% per year through every major volatility spike in that period, including the VIX reaching 82.69 during Covid-19 and briefly surpassing 60 in April 2025. The research consistently shows that missing the best market days — which tend to cluster around the most volatile periods — dramatically reduces long-term returns. Hartford Funds: 'The longer an investor stays invested, the less significant those bumps in the road appear.' If you are close to a major withdrawal or life event in the next 1-3 years, a portfolio review with a financial adviser is appropriate during elevated volatility.
What is the difference between historical and implied volatility?
Historical volatility (also called realised volatility) looks backward: it is calculated from actual past price movements and tells you how volatile an asset has been over a defined previous period. Implied volatility looks forward: it is derived from current options prices and tells you how much the market expects an asset to move in the future. The VIX is a measure of implied volatility for the S&P 500 over the next 30 days. As one April 2026 analysis explains: 'Implied volatility represents the market's forecast of a likely movement in the stock's price and is embedded in the premiums paid for options contracts.' The practical difference: historical volatility describes the past; implied volatility (VIX) describes current expectations.
Why does the VIX go up when markets fall?
When markets fall sharply, investors rush to buy put options — financial contracts that protect against further losses, essentially insurance for their portfolios. When lots of people want the same insurance at the same time, the price of that insurance rises. The VIX measures how much investors are paying for this insurance, so it rises when people are most afraid. FemaleInvest's March 2026 explanation captures the mechanism: 'When investors get nervous, they buy protective options to hedge against losses. The more they pay for these options, the higher the VIX goes. So the index ends up moving in the opposite direction to stock prices: when markets fall sharply, the VIX tends to spike.
0 Comments
Be the first to share your thoughts on this article.