

Investing
Accountant Explains What Is Dividend Yield?


Table of Contents
- The Metric That Tells You How Much a Stock Pays
- What Is Dividend Yield?
- The Dividend Yield Formula: How to Calculate It
- Dividend Yield Worked Examples
- Example 1 — UK Bank: Straightforward Calculation
- Example 2 — The Yield Trap: High Yield from a Falling Price
- Example 3 — S&P 500 vs Dividend Aristocrats (2026 Real Data)
- Dividend Yield by Sector: 2026 Reference Guide
- Reading Dividend Yield Alongside the Payout Ratio: The Complete Signal Framework
- What Is a Good Dividend Yield in 2026?
- Dividend Yield vs Dividend Rate: A Key Distinction
- Dividend Yield in the UK: The FTSE 100 Difference
- Conclusion
- Frequently Asked Questions (FAQ)
The Metric That Tells You How Much a Stock Pays
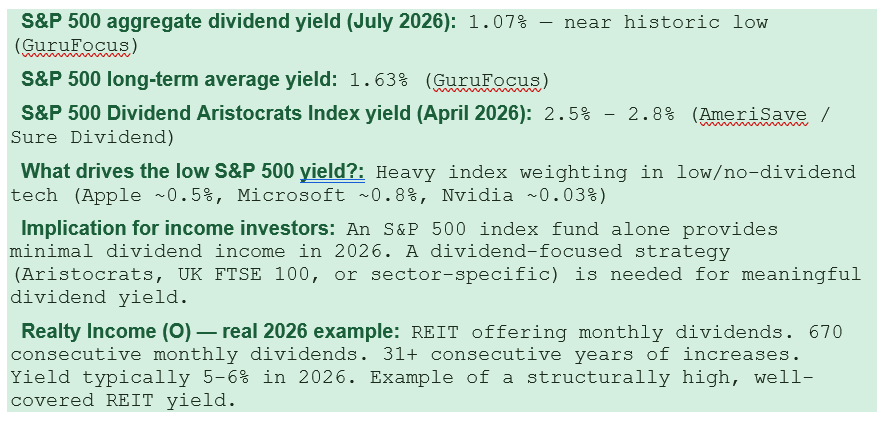
When you invest in a dividend-paying stock, you receive two potential sources of return: capital appreciation (the stock price going up) and dividend income (the cash payment the company makes to shareholders from its profits). Dividend yield is the metric that quantifies the second of these: it tells you how much annual income you receive in dividends for every pound or dollar you invest in a stock at its current price. It is expressed as a percentage, and it is one of the most widely used metrics in income investing.As of July 2026, the S&P 500's aggregate dividend yield stands at approximately 1.07% — well below its long-term historical average of 1.63% and near its all-time low, reflecting the index's high valuation and the heavy weighting of low-dividend technology companies in the current market. The S&P 500 Dividend Aristocrats Index — companies that have grown their dividends for 25 consecutive years or more — averaged a considerably more generous 2.5% to 2.8% as of April 2026. The FTSE 100 in the UK has historically offered meaningfully higher yields than the S&P 500, due to its higher weighting in banks, energy, mining, and consumer staples companies relative to technology.
Dividend yield appears deceptively simple: a single percentage that seems to summarise a stock's income-generating potential. In practice, it is one of the most nuanced metrics in investing — the same yield number can represent a healthy, mature, cash-generating business or a company in distress whose stock has fallen sharply, inflating the yield through price decline rather than dividend strength. AmeriSave's June 2026 analysis states this directly: 'The same yield number can signal a healthy, mature business or a stock under stress.' Understanding dividend yield correctly means understanding not just how to calculate it but how to interpret it in context — across sectors, alongside the payout ratio, in light of dividend growth history, and with awareness of the yield trap that catches income-focused investors who focus on the number alone.
What Is Dividend Yield?
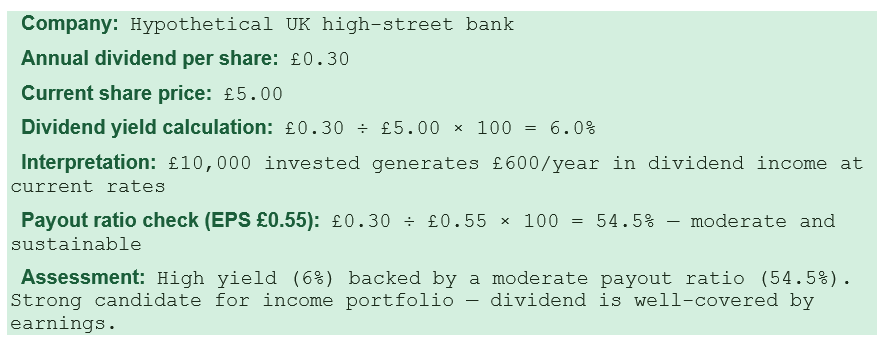
Dividend yield is a financial ratio that measures how much a company pays in annual dividends relative to its current share price. It tells investors the income return they receive from the dividend — expressed as a percentage of the price they paid (or would pay) for the stock. US500.com's definition is precise: 'A stock's dividend yield measures the annual dividends a company pays relative to its current share price, expressed as a percentage. It represents the income an investor could earn from a stock if they bought it at its current price.'The formula is straightforward: Dividend Yield = Annual Dividend Per Share ÷ Share Price × 100. If a company pays £2.00 per share in annual dividends and the share price is £40.00, the dividend yield is 5% (£2.00 ÷ £40.00 × 100). This 5% represents the annual income return on the investment from dividends alone — in the absence of any share price movement, a £10,000 investment generates £500 per year in dividend income.
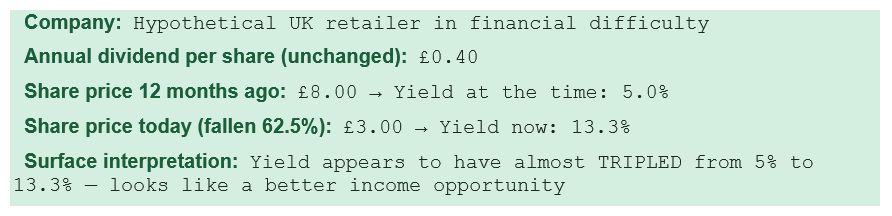
The inverse relationship between yield and price is the most important mathematical characteristic to internalise: as the share price rises, the yield falls (assuming the dividend remains constant); as the share price falls, the yield rises. A company paying a £2.00 annual dividend on a £40.00 share has a 5% yield. If the share price rises to £50.00, the yield falls to 4%. If the share price falls to £25.00, the yield rises to 8%. This inverse relationship is why high yields can be either attractive income opportunities or warning signals — depending on whether the high yield reflects a strong dividend or a collapsed price.
S&P 500 dividend yield — July 2026: 1.07% as of July 10, 2026 — 34.4% below the long-term average of 1.63% — GuruFocus (updated July 10, 2026): 'S&P 500 Dividend Yield is currently 1.07%, 34.4% below its long-term average of 1.63%. Historically, S&P 500 Dividend Yield has ranged from 1.062% to 6.659%. The median value is 2.868%.' AmeriSave (June 12, 2026): Dividend Aristocrats Index averaged 2.5%-2.8% in April 2026. US500.com: 'A yield above 4% is considered high. Usually, a safe stock will offer a yield in the range of 1% to 3%.' Realty Income Corp: 670 consecutive monthly dividends, 31+ consecutive years of increases (April 14, 2026 press release)
The Dividend Yield Formula: How to Calculate It
The dividend yield formula is:Dividend Yield (%) = (Annual Dividend Per Share ÷ Current Share Price) × 100
The annual dividend per share can be derived in two ways, producing two different versions of yield:
- Trailing dividend yield: Uses the actual dividends paid over the past 12 months. This is the most commonly quoted figure — it uses only confirmed, historical payments rather than estimates. The formula uses the sum of the last four quarterly dividend payments (for quarterly payers) or the last two semi-annual payments (for semi-annual payers). This is the version most databases and financial platforms display by default.
- Forward dividend yield: Uses the most recently announced dividend annualised — typically the most recent quarterly dividend multiplied by four (for quarterly payers). This is more forward-looking but relies on the assumption that the company will continue paying at the current rate for the next 12 months. If a company has recently increased or decreased its dividend, the forward yield may be a more accurate reflection of current income potential than the trailing yield.
The distinction between trailing and forward yield is particularly important when a company has recently changed its dividend. If a company cut its quarterly dividend from $0.50 to $0.30 last quarter, the trailing yield still incorporates the old $0.50 payments in its calculation — overstating the income the investor will actually receive going forward. The forward yield of $0.30 × 4 = $1.20/share would give a more accurate picture of the current dividend rate.
Dividend Yield Worked Examples
Example 1 — UK Bank: Straightforward Calculation
Example 2 — The Yield Trap: High Yield from a Falling Price
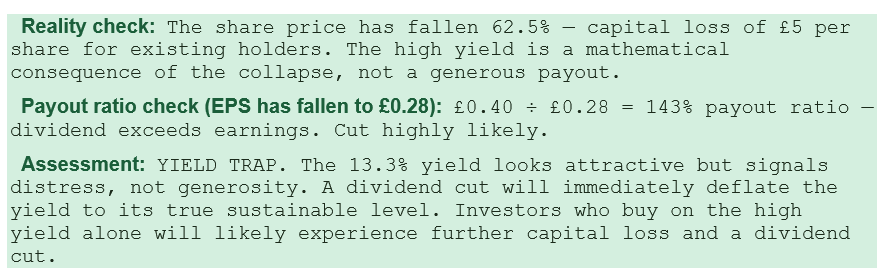
Example 3 — S&P 500 vs Dividend Aristocrats (2026 Real Data)
Dividend Yield by Sector: 2026 Reference Guide
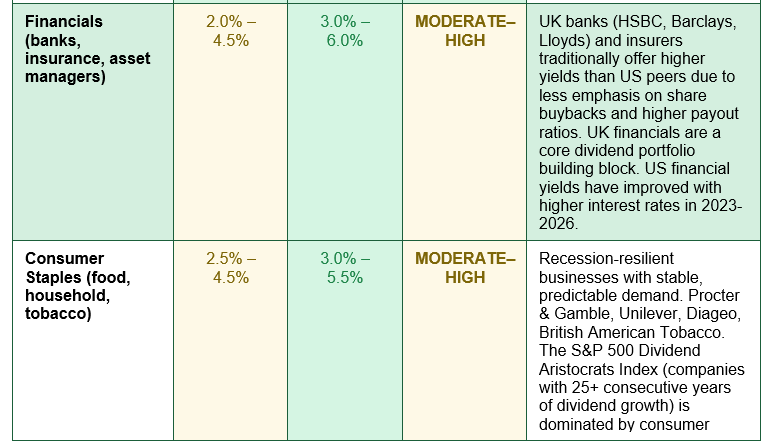
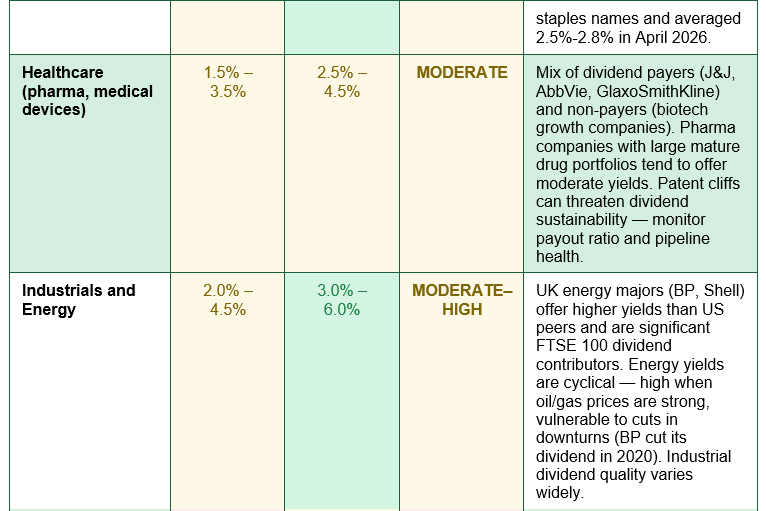
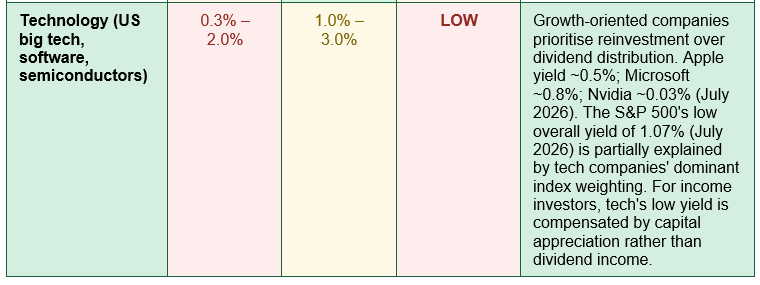
Dividend yields vary enormously by sector — reflecting the different business models, cash generation profiles, growth expectations, and payout cultures across industries. Understanding the typical yield range for each sector is essential for interpreting whether a specific stock's yield is high, low, or normal for its industry: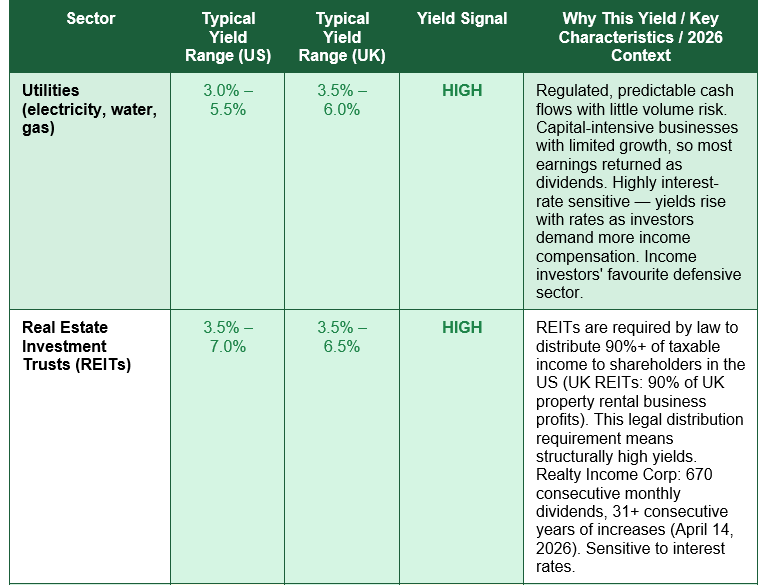
Reading Dividend Yield Alongside the Payout Ratio: The Complete Signal Framework
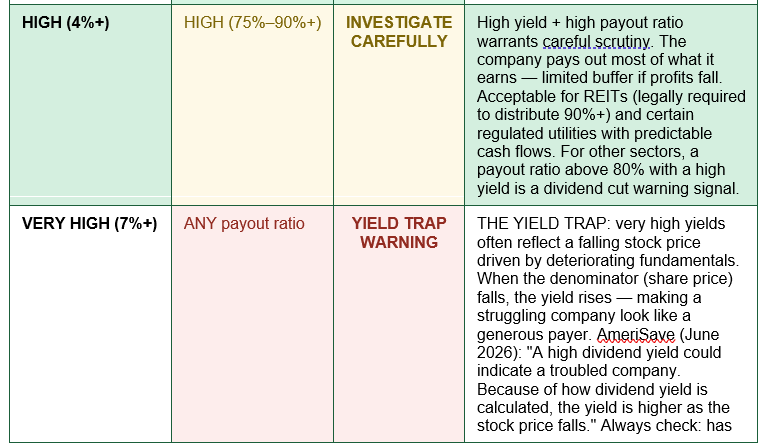
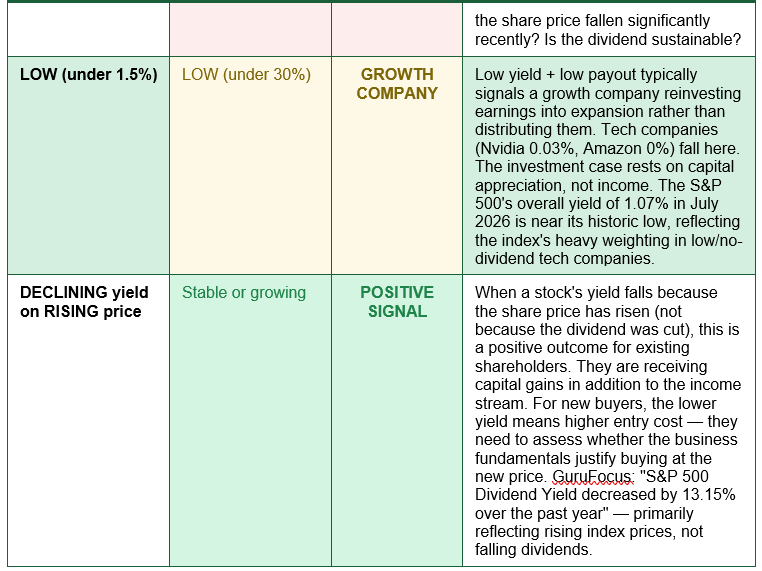
Dividend yield in isolation is an incomplete picture. The payout ratio — the percentage of earnings paid as dividends (Annual Dividend Per Share ÷ Earnings Per Share × 100) — provides the essential sustainability context that yield alone cannot. Together, they form the most important two-metric framework for dividend analysis: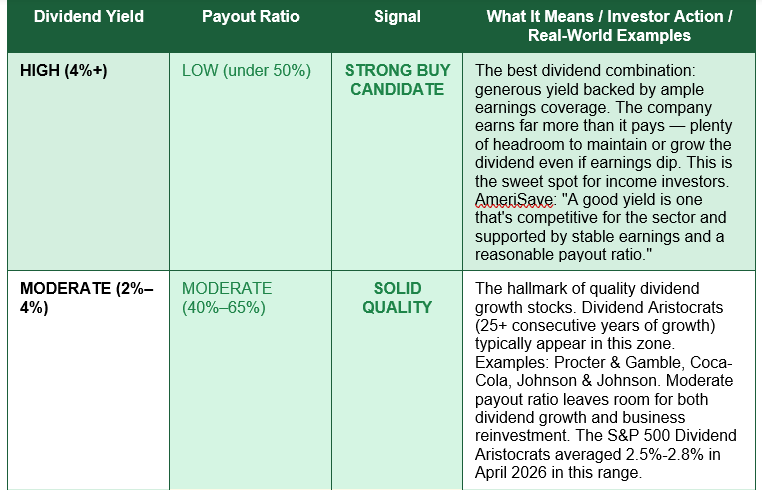
What Is a Good Dividend Yield in 2026?
The question 'what is a good dividend yield?' has no single universal answer — it depends entirely on the sector, the company's growth profile, the current interest rate environment, and what the investor is trying to achieve. AmeriSave's June 2026 guide states the principle clearly: 'A good yield is generally one that's competitive for the stock's sector and supported by stable earnings and a reasonable payout ratio, rather than the highest one on the screen.'In the context of July 2026's market, several benchmarks help frame what constitutes a meaningful dividend yield. The S&P 500's aggregate yield of 1.07% represents the bare minimum — any stock yielding less than the index average is delivering below-market income. The Dividend Aristocrats' 2.5%-2.8% average represents the yield typical of quality dividend growth companies with long histories of consistent increases. Yields in the 3%-5% range are generally considered strong for well-established businesses with moderate payout ratios. Yields above 5% merit careful scrutiny — some are genuinely exceptional (REIT structures, regulated utilities), while others may reflect yield traps.
Interest rates provide the essential comparative context for evaluating dividend yields in any given year. When risk-free rates (UK gilts, US Treasuries) offer 4-5%, a dividend yield of 3% looks less attractive — investors can earn similar income with zero equity risk by holding government bonds. When risk-free rates are near zero (as they were in 2020-2021), a 3% dividend yield looks highly attractive in comparison. In July 2026, UK gilt yields and US Treasury yields remain meaningfully elevated relative to the ultra-low rate era, which raises the income hurdle that dividend stocks must clear to be attractive relative to bonds.
Dividend yield vs dividend growth: the income investor's most important choice: Two stocks can both yield 3% today but have completely different long-term income outlooks. A company yielding 3% with a 10-year track record of growing its dividend at 8% per year will offer a yield on your original cost basis of approximately 6.5% in 10 years. A company yielding 3% with flat or declining dividends will still yield 3% in 10 years (on your original cost). The compound growth of income that dividend growth investing provides is often more valuable to long-term investors than chasing the highest current yield. The S&P 500 Dividend Aristocrats — companies with 25+ consecutive years of dividend increases — have demonstrated that disciplined companies can grow their dividends through recessions, market crashes, and competitive disruptions. AmeriSave: 'The S&P 500 Dividend Aristocrats Index averaged closer to 2.5%-2.8%' in April 2026, representing the yield on companies with the strongest dividend growth track records.
Dividend Yield vs Dividend Rate: A Key Distinction
Dividend yield and the dividend rate (also called the dividend per share or DPS) are closely related but measure different things, and confusing them is a common source of error for newer investors. AmeriSave (June 2026) is explicit: 'Dividend yield is a ratio. The dividend rate is a dollar amount. Knowing the difference matters for both screening and tax planning.'The dividend rate is the absolute cash amount the company pays per share per year — in pounds, dollars, or any other currency. A company paying £0.40 per share annually has a dividend rate of £0.40. This tells you the raw income per share. The dividend yield converts that absolute amount into a percentage relative to the share price, enabling comparison across companies with very different share prices and across time. A £0.40 dividend on a £5.00 share yields 8%. The same £0.40 dividend on a £40.00 share yields only 1%. Both companies pay the same absolute amount per share — but the income return as a percentage of investment is dramatically different.
The dividend rate is useful for calculating absolute income on a known holding (if you own 500 shares with a £0.40 dividend rate, you receive £200 per year). The dividend yield is useful for comparing income attractiveness across different stocks and benchmarks (is 4% on Stock A better than 3% on Stock B in the same sector?). Tax planning considerations — particularly the distinction between qualified and ordinary dividends in the US (taxed at 0%/15%/20% vs regular income rates up to 37%) and between UK dividend income within and outside a Stocks and Shares ISA — apply to the actual cash dividend received, not the percentage yield.
THE YIELD ON COST METRIC — WHY LONG-TERM DIVIDEND INVESTORS USE IT: Yield on cost (YOC) measures the dividend yield relative to the original purchase price of the stock — not the current market price. Example: You buy a stock at £10.00 with a £0.30 annual dividend (3% yield). Ten years later, the company has grown its dividend to £0.80/share. Current share price: £25.00. Current yield: 3.2% (£0.80 ÷ £25.00). But your personal yield on cost: 8.0% (£0.80 ÷ £10.00 original purchase price). YOC illustrates why long-term dividend growth investors who bought quality companies at reasonable prices progressively earn much higher income returns on their original capital than the published current yield suggests. It is the most compelling argument for owning high-quality dividend growers from early in their growth trajectory rather than only focusing on the current published yield.
Dividend Yield in the UK: The FTSE 100 Difference
UK investors benefit from one of the highest-yielding major market indices in the developed world. The FTSE 100 has historically offered a dividend yield significantly above the S&P 500 — typically in the range of 3.5%-4.5% in recent years, versus the S&P 500's 1%-2% range. This difference reflects fundamental structural differences in the composition of the two indices rather than any systemic difference in company quality.The FTSE 100 is overweight in high-dividend sectors: banks and financial services (Barclays, HSBC, Lloyds, Standard Chartered), oil and gas majors (BP, Shell), mining (Rio Tinto, BHP, Glencore, Anglo American), consumer staples (Unilever, Diageo, British American Tobacco, Imperial Brands), and healthcare and pharmaceuticals (AstraZeneca, GSX). Many of these companies generate large, stable cash flows and return substantial portions to shareholders as dividends. By contrast, the S&P 500 is heavily weighted toward technology companies (Microsoft, Apple, Nvidia, Amazon, Alphabet) that pay minimal or no dividends, preferring share buybacks or reinvestment.
For UK investors, the Stocks and Shares ISA provides the optimal tax wrapper for dividend income: dividends received within an ISA are entirely exempt from UK income tax, regardless of amount. Outside an ISA, the UK dividend allowance has been reduced to £500 in the 2025/26 tax year, meaning dividends above £500 are subject to income tax at 8.75% (basic rate), 33.75% (higher rate), or 39.35% (additional rate). The ISA dividend tax exemption makes UK income investing within the £20,000 annual ISA allowance (2025/26) particularly tax-efficient — especially for investors building a DRIP-based portfolio on high-yielding FTSE 100 positions.
THE YIELD TRAP — THE MOST DANGEROUS DIVIDEND INVESTING MISTAKE: The yield trap is when investors are attracted to a stock's high dividend yield without recognising that the high yield results from a falling share price, not a generous payout. As a stock's price declines, the yield rises mathematically — making a distressed company look like an attractive income opportunity precisely when it is most dangerous. The sequence typically follows this pattern: a company faces financial stress; the share price falls sharply; the dividend yield rises to 8%, 10%, or even higher; income investors are attracted by the high yield and buy; the company then cuts or eliminates the dividend because it can no longer afford to pay it at current rates; the share price falls further on the dividend cut; early buyers suffer both capital losses and income loss simultaneously. AmeriSave (June 2026): 'A high dividend yield could indicate a troubled company. Because of how dividend yield is calculated, the yield is higher as the stock price falls, so it is important to evaluate whether there has been a significant decline in share price.' The guards: always check the payout ratio (above 80% in non-REIT companies is a warning), the trend in earnings and free cash flow, analyst dividend forecasts, and whether the dividend has already been flagged as unsustainable in recent company statements.
Conclusion
Dividend yield is one of the most widely used and most frequently misread metrics in investing. Its formula is simple — annual dividend per share divided by share price, multiplied by 100 — but its interpretation requires context, comparison, and a clear understanding of what causes yields to be high or low. A yield can be high because a company is genuinely generous with its cash — backed by strong earnings, a sustainable payout ratio, and a long track record of dividend maintenance or growth. Or it can be high because the share price has fallen sharply, inflating the yield as a mathematical consequence of distress.In July 2026, the S&P 500's aggregate yield of 1.07% sits near its historic low — 34% below the long-term average of 1.63% — reflecting high valuations and the heavy weighting of low/no-dividend technology companies. The Dividend Aristocrats Index's 2.5%-2.8% represents the yield on quality, long-duration dividend growth companies with 25+ consecutive years of increases. Yields of 3%-5% backed by sustainable payout ratios and stable free cash flows represent the sweet spot for income investors who understand what they own. Yields above 7% in non-REIT, non-utility businesses almost always warrant serious investigation before purchase.
The payout ratio, the dividend growth history, the sector context, the interest rate environment, and the underlying trend in earnings and free cash flow are the five essential companions to dividend yield in any comprehensive income investment assessment. Dividend yield tells you what you are being paid today relative to what you paid. Payout ratio tells you whether that payment is sustainable. Dividend growth history tells you whether the payment has been reliable and growing. Sector context tells you whether the yield is high or low for the industry. And the underlying business tells you whether the payment is likely to continue — the only question that ultimately matters for a long-term income investor.
0 Comments
Be the first to share your thoughts on this article.