

Investing
What Is Internal Rate of Return (IRR)? Accountant Explains


Table of Contents
- The Percentage That Drives Investment Decisions
- What Is the Internal Rate of Return (IRR)?
- The IRR Formula and Why It Cannot Be Solved Directly
- How to Calculate IRR: Trial-and-Error and Excel Methods
- The Trial-and-Error Method (Conceptual)
- The Excel Method: =IRR() and =XIRR()
- IRR Worked Examples: Step by Step
- Example 1 — Manufacturing Machine Purchase (Trial-and-Error Method)
- Example 2 — CFI's Classic IRR Pitfall: Short-Duration High-IRR vs Long-Duration Lower-IRR
- IRR vs Hurdle Rate: Decision Rules and Industry Benchmarks 2026
- The Five Critical IRR Limitations: Problems and Solutions
- MIRR: The Modified IRR That Fixes the Reinvestment Problem
- IRR vs NPV: When to Use Each and When They Conflict
- Where IRR Is Used: Real-World Applications in 2026
- Conclusion
- Frequently Asked Questions (FAQ)
The Percentage That Drives Investment Decisions
When a private equity firm evaluates whether to acquire a company, when a corporation decides whether to build a new factory, when a real estate developer assesses a construction project, and when a venture capital fund chooses between competing startups, one of the first numbers they calculate is the Internal Rate of Return. The IRR is the percentage rate of return that a project or investment is expected to generate — expressed as an annualised figure that accounts for the full timing and magnitude of every cash flow over the investment's life.The Internal Rate of Return has a precise technical definition: it is the discount rate at which the Net Present Value (NPV) of an investment equals exactly zero. In other words, it is the rate at which the present value of all expected future cash inflows exactly equals the present value of all cash outflows — the break-even rate of return. If the IRR exceeds the investor's required rate of return (called the hurdle rate or cost of capital), the investment creates value and should be accepted. If IRR falls below the hurdle rate, the investment earns less than its cost of capital and should be rejected.
This guide provides the complete picture of IRR: the precise definition and its relationship to NPV, the formula and the iteration method required to solve it, step-by-step worked examples including the Excel =IRR() and =XIRR() functions, the decision rule and real-world hurdle rate benchmarks by industry, the critical limitations that every practitioner must understand (including the reinvestment rate assumption and the multiple IRR problem), the Modified IRR (MIRR) that addresses IRR's most important flaw, and the definitive answer to when to use IRR versus NPV. Understanding both what IRR tells you and what it fails to tell you is the essential competency in capital budgeting.
What Is the Internal Rate of Return (IRR)?
The Internal Rate of Return (IRR) is the discount rate that makes the Net Present Value (NPV) of an investment's cash flows exactly equal to zero. Wall Street Prep's updated July 2026 guide defines it from two angles simultaneously: 'Capital Budgeting — the internal rate of return (IRR) is the discount rate at which the net present value (NPV) on a project or investment is equal to zero. Investment Analysis — the internal rate of return (IRR) is the potential rate of return on an investment, expressed on an annualized basis.'The simplest intuitive interpretation is this: IRR is the annualised rate at which an investment breaks even in present value terms — the rate at which the discounted future cash flows exactly equal the money invested. If a company's cost of capital (WACC) is 10%, and a project's IRR is 18%, the project earns 8 percentage points more than required — it creates value. If the same project's IRR were 7%, it earns 3 percentage points less than required — it destroys value relative to the alternative of simply investing the capital at the 10% cost of capital.
The connection between IRR and NPV is mathematically precise and practically important: for a given set of project cash flows, every discount rate produces a specific NPV. As the discount rate rises, NPV falls (higher discounting reduces the present value of future inflows). The IRR is the specific discount rate at exactly the NPV = 0 point. At any discount rate below the IRR, NPV is positive (accept). At any rate above IRR, NPV is negative (reject). This is why 'IRR > hurdle rate' and 'NPV > 0' are mathematically equivalent decision rules — they are two ways of expressing the same underlying relationship.
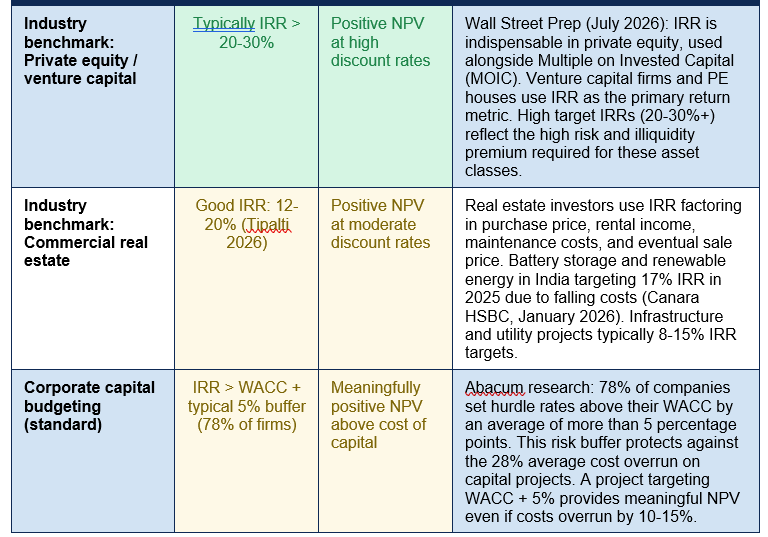
IRR as the foundation of capital allocation: PE and VC firms use IRR as their primary return metric — targeting 20-30%+ for buyouts; real estate targets 12-20% depending on risk (Tipalti, February 2026) — Wall Street Prep (updated July 1, 2026): 'The IRR is integral to capital budgeting and investment analysis, as a higher IRR implies a more profitable investment or project. By accounting for the cadence and magnitude of cash flows, IRR provides a time-weighted measure that is indispensable in private equity, commercial real estate, and capital budgeting.' IRR is used alongside MOIC (Multiple on Invested Capital) in private equity to give both a return rate and an absolute return multiple — two complementary measures of investment performance
The IRR Formula and Why It Cannot Be Solved Directly
The IRR formula is derived from the NPV formula by setting NPV equal to zero and solving for the discount rate r:0 = CF₀ + CF₁/(1+r)¹ + CF₂/(1+r)² + CF₃/(1+r)³ + ... + CFₙ/(1+r)ⁿ
• 0 = the target NPV (zero, by definition of IRR)
• CF₀ = initial cash outflow at Year 0 (negative — the initial investment)
• CF₁, CF₂ ... CFₙ = net cash flows in each subsequent year (can be positive or negative)
• r = the IRR — what we are solving for
• n = the number of periods in the project life
The critical mathematical point that distinguishes IRR from NPV is that IRR cannot be solved algebraically for projects with more than two cash flow periods. Unlike NPV, where you plug in a known discount rate and calculate the output, IRR requires finding the unknown discount rate r that satisfies the equation — and for multi-period projects, this has no closed-form algebraic solution. It must be found through iteration: systematically trying different values of r until one is found that produces NPV = 0.
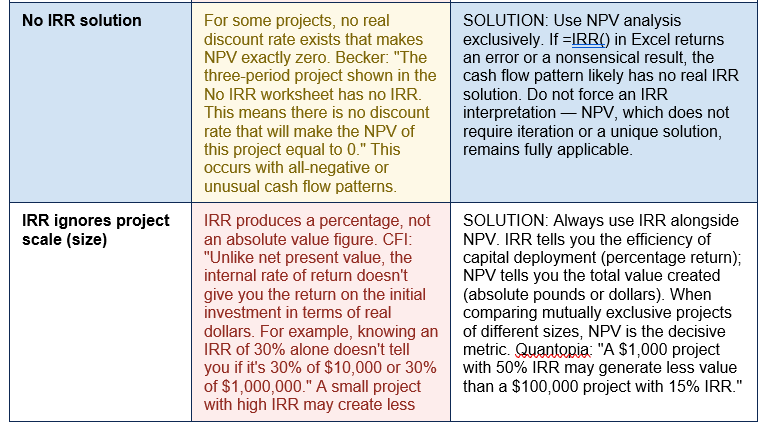
Quantopia's IRR guide explains the iteration process: 'When n is greater than 1, it often requires trial-and-error (or financial tools like Excel's IRR function) to solve for r.' In practice, no one calculates IRR by hand for real projects — Excel, financial calculators, and financial modelling software handle the iteration automatically. But understanding that the calculation is inherently iterative, not algebraic, helps explain why multiple IRRs are possible (multiple values of r can satisfy NPV = 0 in some cash flow patterns) and why certain cash flow structures produce no real IRR solution at all.
How to Calculate IRR: Trial-and-Error and Excel Methods
The Trial-and-Error Method (Conceptual)
Before Excel, IRR was calculated by manually substituting different discount rates into the NPV formula until NPV was found to be zero (or very close to it). The process:- Start with an initial guess: Begin with a discount rate that seems plausible — perhaps the company's WACC or a rate near the expected IRR. Calculate NPV at that rate.
- Adjust the rate: If NPV is positive, the discount rate is too low — the IRR must be higher. Increase the rate. If NPV is negative, the rate is too high — decrease it.
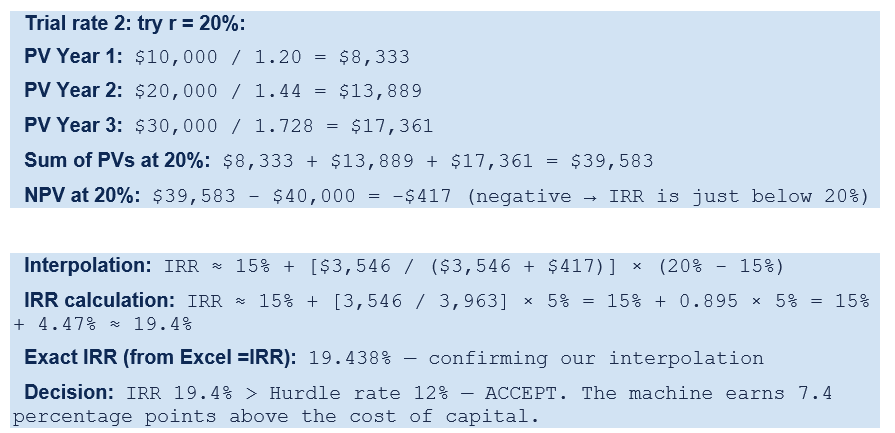
- Narrow down by interpolation: Once you have found two rates — one where NPV is slightly positive and one where NPV is slightly negative — you can interpolate between them to find the rate where NPV = 0. IRR ≈ r₁ + [NPV₁ / (NPV₁ − NPV₂)] × (r₂ − r₁), where r₁ and r₂ are the two rates that bracket zero.
- Verify the result: Plug the estimated IRR back into the NPV formula to confirm NPV ≈ 0.
The Excel Method: =IRR() and =XIRR()
In practice, IRR is calculated in Excel using one of two built-in functions. The =IRR(values, [guess]) function takes a range of cash flows (including the Year 0 negative initial investment) and returns the IRR. Becker's guide notes: 'The syntax of the IRR function is IRR(range of cash flows, [guess]). The guess argument is optional and should be a guess of what you think the IRR is. In most situations, you don't need to enter the guess argument, but it can sometimes be important.'The =XIRR(values, dates, [guess]) function is the more powerful alternative for projects where cash flows occur at irregular intervals rather than annually. Becker: 'How can we calculate IRR when cash flows don't occur at regular intervals? Excel's amazing XIRR function comes to the rescue. Simply input the dates and values of the cash flows and Excel will return an investment's annual rate of return.' XIRR produced a result of 18.3% in Becker's worked irregular cash flow example. For any real-world project with specific calendar dates rather than idealised annual periods, =XIRR() is the correct function to use.
THE MULTIPLE IRR WARNING — ALWAYS USE A RANGE OF GUESSES: Becker's CPA exam guide makes this critical point for practical Excel users: "You should enter a range of guesses" when calculating IRR. If different guesses return different IRR values, the project has multiple IRRs — a situation Becker illustrates with a project returning both -9.6% and 216.1%. In this case, neither IRR has a practical interpretation and you should switch to NPV analysis. As a safeguard: if your project's cash flows change sign more than once (positive, then negative, then positive again), run IRR with several different starting guesses. If all guesses converge to the same answer, you likely have a unique IRR. If different guesses return different answers, you have multiple IRRs.
IRR Worked Examples: Step by Step
Example 1 — Manufacturing Machine Purchase (Trial-and-Error Method)
A small manufacturing company is evaluating the purchase of a machine costing $40,000. Expected cash inflows: $10,000 in Year 1, $20,000 in Year 2, $30,000 in Year 3. The company's hurdle rate is 12%. Should they proceed?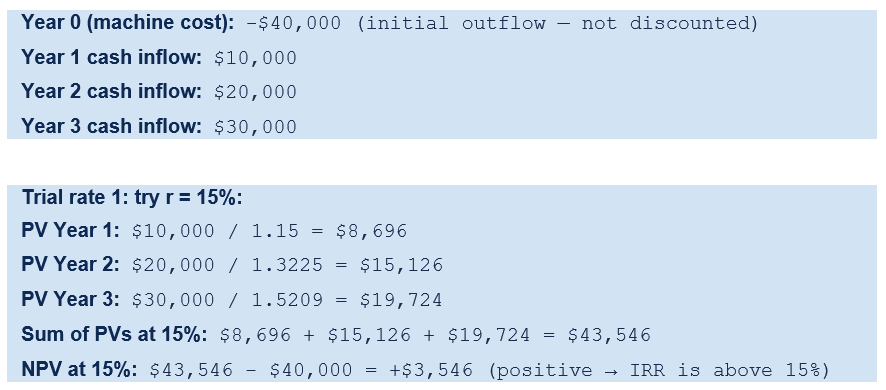
Example 2 — CFI's Classic IRR Pitfall: Short-Duration High-IRR vs Long-Duration Lower-IRR
This is the definitive CFI worked example illustrating IRR's most important practical flaw when ranking projects: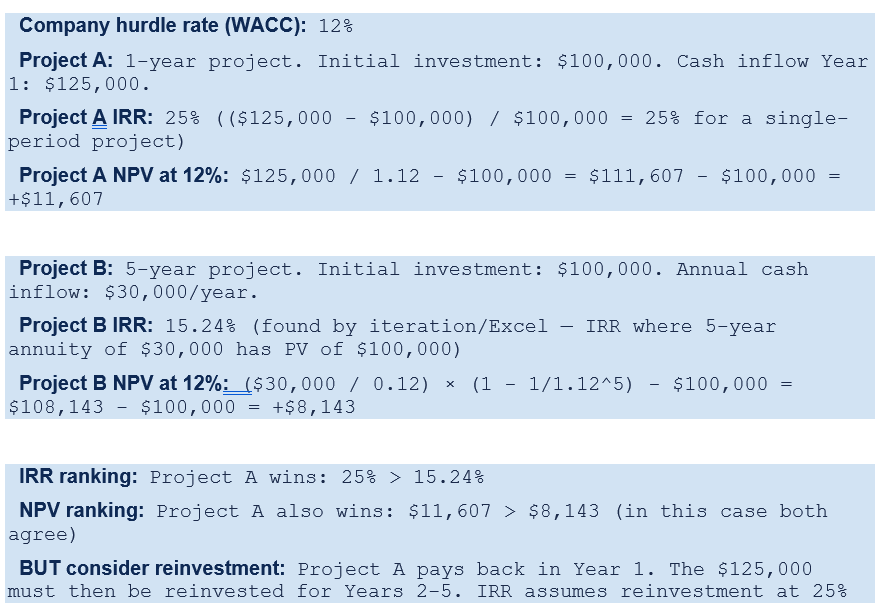

IRR vs Hurdle Rate: Decision Rules and Industry Benchmarks 2026
The IRR decision rule is binary: accept if IRR exceeds the hurdle rate; reject if it falls below. The table below maps IRR outcomes to their decision signals, NPV implications, and real-world industry hurdle rate benchmarks in 2026: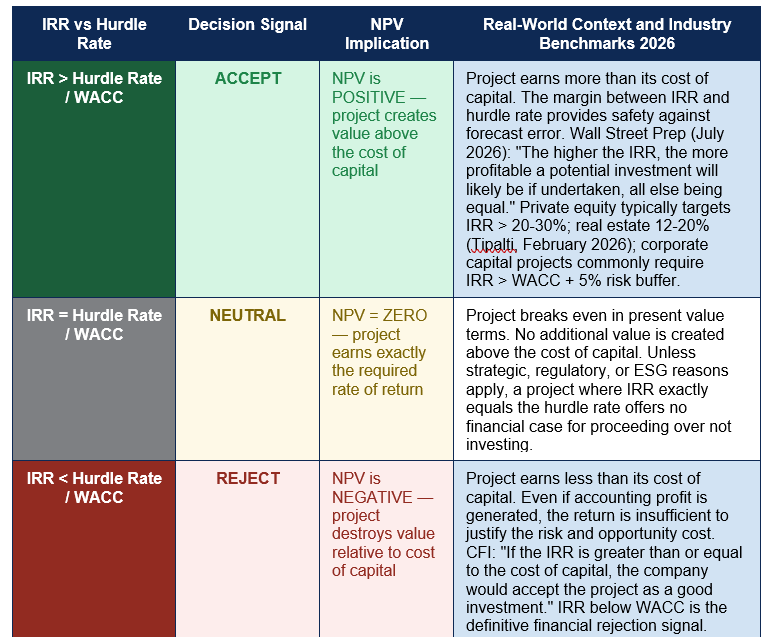
The Five Critical IRR Limitations: Problems and Solutions
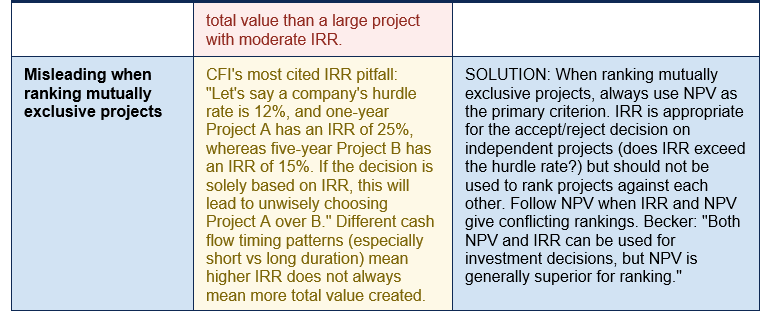
IRR is a powerful and widely used metric, but it has five significant structural limitations that any serious practitioner must understand. The table below maps each problem, what goes wrong, and the appropriate solution: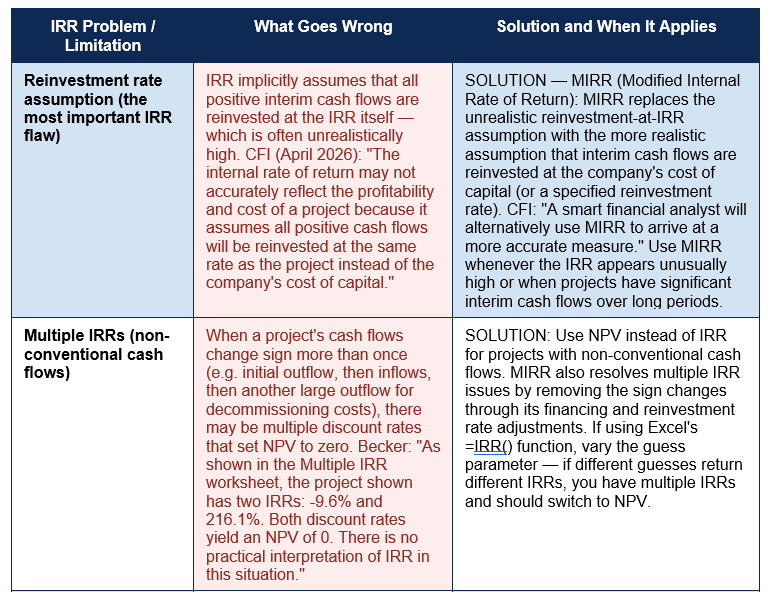
MIRR: The Modified IRR That Fixes the Reinvestment Problem
The Modified Internal Rate of Return (MIRR) addresses the most significant flaw in traditional IRR: the unrealistic assumption that all positive interim cash flows are reinvested at the IRR itself. CFI is explicit: 'A smart financial analyst will alternatively use MIRR to arrive at a more accurate measure.' MIRR replaces this assumption with two separate, more realistic rates: a financing rate (the cost of capital, used to discount negative cash flows) and a reinvestment rate (the rate at which positive interim cash flows can realistically be reinvested — typically the WACC or a conservative safe rate).The MIRR formula is: MIRR = (Terminal Value of positive cash flows / Present Value of negative cash flows)^(1/n) − 1. The terminal value of positive cash flows is calculated by compounding each positive cash flow forward to the end of the project at the reinvestment rate. The present value of negative cash flows is calculated by discounting each negative cash flow back to Year 0 at the financing rate. The result is a single, unique rate that reflects a more realistic return assumption.
In Excel, MIRR is calculated using =MIRR(values, finance_rate, reinvest_rate). Unlike =IRR(), the MIRR function always produces a unique result — it cannot produce multiple solutions because the mathematical structure of the MIRR formula prevents it. Canara HSBC's January 2026 investment guide confirms: 'MIRR fixes IRR's reinvestment flaw by assuming interim cash flows are reinvested at the cost of capital or a safe rate.' The MIRR will always be lower than the IRR when the reinvestment rate is lower than the IRR — which is almost always the case, since the IRR is typically above the WACC.
When should you use MIRR instead of IRR? Use MIRR whenever: (1) the project's IRR appears unusually high relative to the company's WACC (suggesting the reinvestment assumption is materially unrealistic); (2) the project life is long (5+ years) and interim cash flows are significant, giving the reinvestment assumption more time to compound its distortion; (3) you are comparing projects with very different IRRs, where the reinvestment rate assumption will affect the ranking; (4) the project has non-conventional cash flows (sign changes) producing multiple IRRs — MIRR always produces a unique answer. MIRR will not fully replace IRR in industry practice because IRR is the established convention in private equity and real estate, but for internal capital budgeting decisions, MIRR provides a more reliable measure of expected return.
IRR vs NPV: When to Use Each and When They Conflict
IRR and NPV are complementary tools — for independent projects with conventional cash flows (one initial outflow followed by inflows), they always agree on the accept/reject decision. The disagreement only arises when comparing or ranking mutually exclusive projects, and in those cases, NPV is the superior criterion.The core distinction, stated precisely: IRR measures the efficiency of capital deployment — the percentage return per unit of capital invested. NPV measures the absolute value created — the total pounds or dollars of value added above the cost of capital. A 50% IRR on a £10,000 project creates £5,000 of return. A 15% IRR on a £1,000,000 project creates £150,000 of return. NPV makes this scale difference explicit and decisive; IRR obscures it entirely.
Becker's analysis of two projects demonstrates the fundamental comparison problem: 'With a discount rate of 20 percent, Project 2 has a larger NPV. If we use a discount rate of 2 percent, Project 1 has a larger NPV. It's often difficult to agree on a discount rate. This is when IRR becomes useful.' IRR's value is precisely that it sidesteps the discount rate choice problem — you do not need to agree on a rate to calculate the IRR; you only need the hurdle rate for the binary accept/reject decision. But for ranking, NPV requires a discount rate and IRR-based rankings are unreliable.
The professional consensus in 2026: use IRR for the initial accept/reject screen (does the project IRR exceed the hurdle rate?), and use NPV for ranking competing projects. When the two methods conflict on ranking, NPV is always decisive. CFI, Eduyush, Becker, Ryan O'Connell CFA, and the AFP Financial Professionals guide all converge on this conclusion.
Where IRR Is Used: Real-World Applications in 2026
- Private equity and leveraged buyouts (LBOs): IRR is the primary return metric in private equity. A PE fund evaluating an LBO will model the acquisition price, the debt financing, the operational improvements expected over a 3-7 year hold period, and the eventual exit value — producing an IRR that must clear the fund's minimum return threshold (typically 20-30%+). Wall Street Prep (July 2026): 'IRR is indispensable in private equity, commercial real estate, and capital budgeting.' IRR is used alongside MOIC (Multiple on Invested Capital — the absolute return multiple) to give a complete picture of investment performance.
- Venture capital and startup investing: VC firms use IRR to assess portfolio-level performance and individual investment returns. The inherently long timelines and variable cash flow timing in venture investment make IRR's time-weighting particularly valuable — a startup investment that returns capital in Year 2 is meaningfully different from one that returns in Year 8, even if both return the same total multiple.
- Commercial real estate development and investment: IRR is the standard return metric in property development and real estate private equity. A developer assessing a new residential scheme will model construction costs, sales revenues, financing costs, and timing to produce a project IRR. Tipalti (February 2026): 'In real estate, a good IRR may vary from 12% to 20%, depending on the risk level.' Income-producing real estate targets lower IRRs reflecting lower risk; development and speculative projects require higher IRRs.
- Corporate capital budgeting: Finance teams in corporate businesses use IRR (alongside NPV) to evaluate major capital investments: new production equipment, factory expansions, technology infrastructure, product line launches, and geographic market entries. The IRR is compared against the company's WACC and hurdle rate — with 78% of companies using hurdle rates above WACC by an average of 5+ percentage points (Abacum research).
- Infrastructure and energy projects: Long-duration infrastructure investments (toll roads, renewable energy installations, power plants, pipelines) use IRR to assess decades-long cash flow profiles. India's merchant battery storage sector achieved profitability in 2024, with 2025 projects targeting 17% IRR due to falling costs (Canara HSBC, January 2026) — a real-world example of IRR as the benchmark return target for an emerging asset class.
Conclusion
The Internal Rate of Return is one of the most widely used and most frequently misunderstood metrics in finance. Its definition is precise and elegant: the IRR is the discount rate that makes the NPV of an investment's cash flows equal to zero — the annualised rate of return at which the project breaks even in present value terms. The decision rule is simple: accept if IRR exceeds the hurdle rate (typically WACC or WACC plus a risk buffer); reject if it falls below. This simplicity explains IRR's enduring appeal across private equity, real estate, venture capital, and corporate capital budgeting.The limitations, however, are equally important to understand. IRR assumes that all positive interim cash flows are reinvested at the IRR itself — an assumption that overstates returns whenever IRR significantly exceeds the realistic reinvestment rate (typically WACC). MIRR addresses this by using separate financing and reinvestment rates, producing a more realistic and always unique return estimate. IRR can produce multiple solutions (or no solution) for projects with non-conventional cash flows, making NPV the only reliable analysis tool in those cases. IRR ignores project scale entirely — a 50% IRR on a £10,000 project creates less value than a 15% IRR on a £1,000,000 project. And IRR should never be used to rank mutually exclusive projects when NPV gives conflicting rankings.
The professional consensus is clear and consistent across all the 2026 sources in this guide: use IRR for what it does well — the initial accept/reject screen, the communication of expected return as a percentage, and the standard return reporting in private equity and real estate. Use NPV for what IRR cannot do — ranking competing projects, measuring absolute value creation, and analysing non-conventional cash flow patterns. And use MIRR whenever the reinvestment rate assumption makes IRR materially misleading. The three metrics are most powerful in combination: a project that clears the hurdle rate on IRR, shows a meaningfully positive NPV, and remains robust to a realistic MIRR analysis has passed the most rigorous standard of capital budgeting validation available.
0 Comments
Be the first to share your thoughts on this article.