

Investing
What Is Net Present Value (NPV)? Accountant Explains


Table of Contents
- The Gold Standard of Investment Decision-Making
- What Is Net Present Value?
- The NPV Formula: Complete Explanation
- How to Calculate NPV: The Five-Step Process
- NPV Worked Examples: Step by Step
- Example 1 — Caterpillar Production Line Investment (Ryan O'Connell CFA, February 2026)
- Example 2 — UK Business: Choosing Between Two Mutually Exclusive Projects
- Reading NPV Results: The Complete Interpretation Guide
- NPV vs IRR vs Payback Period: The Capital Budgeting Methods Compared
- Limitations of NPV: What It Cannot Tell You
- Where NPV Is Used in the Real World
- Conclusion
- Frequently Asked Questions (FAQ)
The Gold Standard of Investment Decision-Making
Every day, businesses across the world face the same fundamental challenge: limited capital, and more investment opportunities than they can pursue. A factory expansion, a new product launch, a technology upgrade, an acquisition — each requires significant capital today in exchange for expected cash returns over the years ahead. Which investments are worth making? Which destroy value rather than create it? How do you compare a project that pays back steadily over five years against one that generates large returns only in years six and seven? These are the questions that Net Present Value — NPV — was designed to answer.According to the Association for Financial Professionals' 2026 Cost of Capital Survey, 82% of financial professionals consider NPV important to their organisation's investment decision-making process. Abacum's research found that 75% of large corporations consistently employ NPV analysis in their capital allocation decisions. The metric has been the gold standard of investment appraisal since the mid-20th century — and it remains so in 2026 precisely because it solves the single most fundamental problem in investment economics: how to compare money spent today against money received at different points in the future.
This guide explains Net Present Value comprehensively and practically: the time value of money principle that underpins it, the complete formula with all variables explained, the step-by-step calculation process, two full worked examples (including the Caterpillar production line example from Ryan O'Connell CFA's February 2026 practitioner guide), what positive, negative, and zero NPV results mean and what to do with each, the NPV additivity property, how NPV compares to IRR and payback period as capital budgeting tools, the real-world limitations, and the correct use of sensitivity analysis. Whether you are a student, a business decision-maker, or an investor, NPV is one of the most useful and most widely applied concepts in finance.
What Is Net Present Value?
Net Present Value (NPV) is a financial metric that measures the total value an investment creates by comparing the present value of all expected future cash flows to the initial cost of the investment. CFI's April 2026 guide defines it precisely: 'Net Present Value (NPV) is the value of all future cash flows — positive and negative — over the entire life of an investment discounted to the present. NPV analysis is a form of intrinsic valuation and is used extensively across finance and accounting for determining the value of a business, investment security, capital project, new venture, cost reduction programme, and anything that involves cash flow.'The 'net' in Net Present Value means the calculation is net of the initial cost — it is not simply the sum of discounted future inflows but the sum of discounted inflows minus the initial outflow. A positive NPV means the present value of future benefits exceeds the cost. A negative NPV means the cost exceeds the present value of future benefits. A zero NPV means they are exactly equal — the investment earns precisely the required rate of return, no more and no less.
The defining principle that makes NPV meaningful is the time value of money — the recognition that a pound or dollar received today is worth more than the same pound or dollar received in the future. This is not merely an economic convention; it reflects two fundamental financial realities. First, a pound today can be invested and will generate a return — so a pound today is worth £1 × (1 + r) in one year, making a future pound worth less than a current pound by that same factor. Second, future cash flows carry uncertainty risk — the promise of £100 in five years may not be delivered in full — and rational investors require compensation for that uncertainty through the discount rate applied to those future flows.
NPV adoption in 2026: 82% of financial professionals say NPV is important to their organisation's decision-making (AFP 2026 Cost of Capital Survey) — The Association for Financial Professionals 2026 Cost of Capital Survey — the most current primary source on capital budgeting methodology in use. Abacum research adds: 75% of large corporations consistently use NPV, vs only 40% of smaller firms with revenues below $1 billion. The adoption gap between large and small organisations reflects the complexity of NPV's cash flow modelling requirements — more tractable for organisations with dedicated finance teams and financial modelling capability
The NPV Formula: Complete Explanation
The standard NPV formula is:NPV = Σ [ CFₙ ÷ (1 + r)ⁿ ] − C₀
• NPV = Net Present Value — the single output metric in today's pounds/dollars
• Σ = Sigma (sum) — add up all the discounted cash flows for every period of the project
• CFₙ = Net cash flow in year n (all inflows minus all outflows in that specific year, before financing costs)
• r = Discount rate — the required rate of return, hurdle rate, or WACC (Weighted Average Cost of Capital)
• n = Year number (1, 2, 3 ... N) — the time period of each cash flow
• (1 + r)ⁿ = Discount factor for year n — the divisor that translates a future cash flow into its present value
• C₀ = Initial investment at Year 0 — already at present value; NEVER discounted
Eduyush's February 2026 guide highlights the most common formula error: 'The initial investment at Year 0 is never discounted — it is already at present value.' This is the single most frequent mistake in student NPV calculations: Year 0 cash flows (the initial capital expenditure and any working capital changes at the start) are already in today's money and must be subtracted directly without dividing by a discount factor. Only Years 1 through N require discounting.
The discount factor for each year (1 ÷ (1+r)ⁿ) decreases exponentially with time. At a 10% discount rate, Year 1's discount factor is 0.909, Year 2's is 0.826, Year 5's is 0.621, and Year 10's is 0.386. This means a £100 cash flow in Year 10 is worth only £38.60 today in present value terms at a 10% discount rate — a substantial reduction that reflects both the opportunity cost of waiting and the accumulated uncertainty of a 10-year horizon.
How to Calculate NPV: The Five-Step Process
- Identify all cash flows over the project life: List the initial investment (Year 0, negative) and all net cash flows for each subsequent year — revenues minus operating costs minus capital expenditures, before interest. Do not include financing costs (interest payments) in the cash flows — these are captured through the discount rate.
- Determine the appropriate discount rate: The discount rate should reflect the cost of capital and the risk of the project. For corporate capital budgeting, this is typically the WACC (Weighted Average Cost of Capital). Abacum notes that 78% of companies use hurdle rates that exceed WACC by an average of over 5 percentage points — building in a risk buffer above the strict cost of capital. Higher-risk projects should use higher discount rates.
- Calculate the discount factor for each year: For each year n, calculate 1 ÷ (1 + r)ⁿ. At 10%: Year 1 = 0.9091, Year 2 = 0.8264, Year 3 = 0.7513, Year 4 = 0.6830, Year 5 = 0.6209.
- Multiply each cash flow by its discount factor: The present value of each year's cash flow equals the cash flow multiplied by the discount factor for that year. Sum all resulting present values.
- Subtract the initial investment: NPV = Sum of all discounted future cash flows (Years 1 to N) minus the initial investment (Year 0). If positive: accept. If negative: reject. If comparing two projects, prefer the higher NPV.
EXCEL NPV FUNCTIONS — A CRITICAL NOTE: Excel provides two NPV functions and using the wrong one is a common source of error. The =NPV(rate, values) function discounts ALL values in the range — including Year 0 if accidentally included. Eduyush (February 2026): "Use =XNPV() in Excel for real-world projects — =NPV() assumes equal time periods and excludes Year 0." The correct Excel approach: enter the initial investment separately and add it to the =NPV() result: =NPV(discount_rate, Year1:YearN) + Year0_investment (where Year0 is a negative number representing the outflow). Alternatively, use =XNPV(rate, cashflows, dates) which correctly handles irregular intervals and is the preferred function for any project with real calendar dates.
NPV Worked Examples: Step by Step
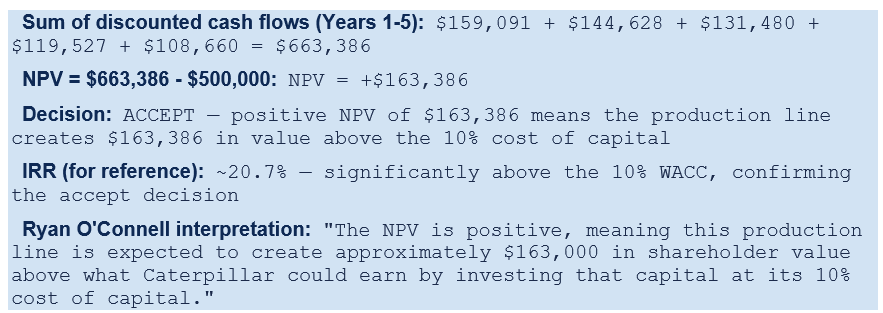
Example 1 — Caterpillar Production Line Investment (Ryan O'Connell CFA, February 2026)
This is the worked example from Ryan O'Connell CFA's February 2026 NPV guide, using Caterpillar (CAT) as the company and a production line investment as the project: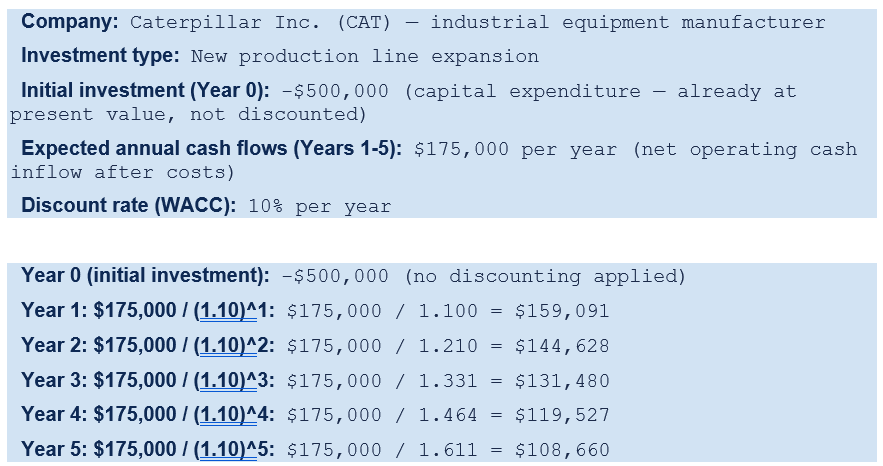
Example 2 — UK Business: Choosing Between Two Mutually Exclusive Projects
This example illustrates NPV's value when ranking projects — demonstrating why NPV is preferred over IRR for this purpose: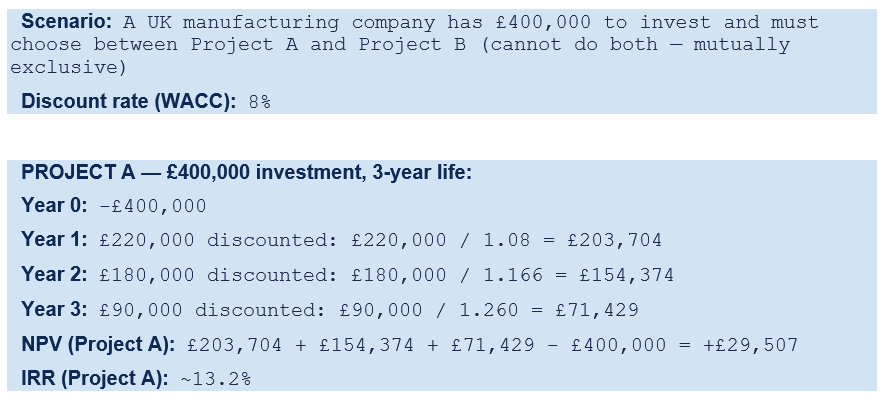
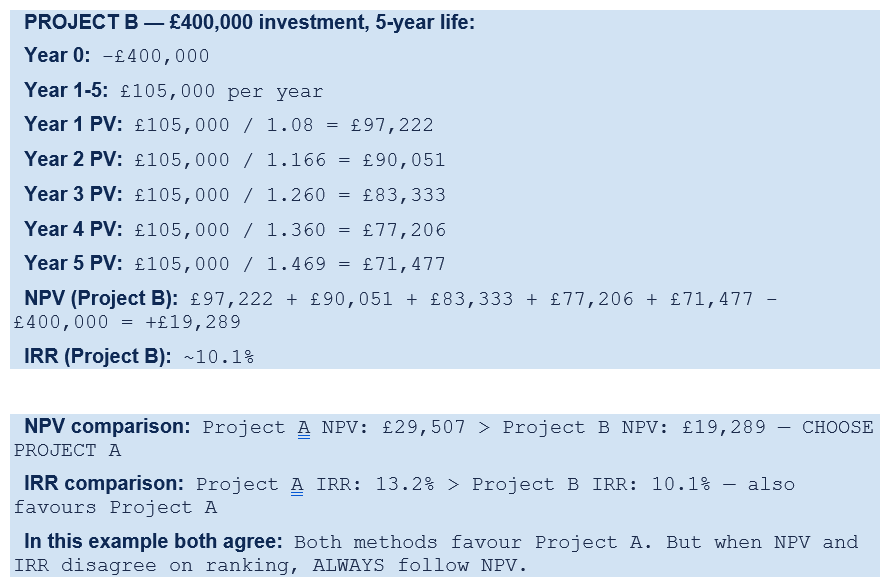
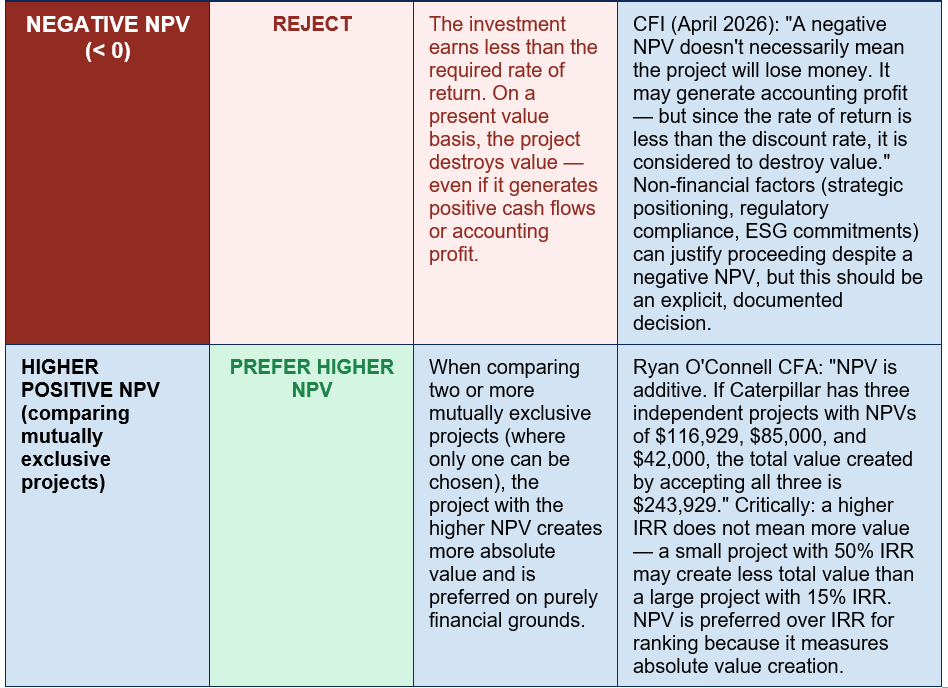
Why NPV and IRR can disagree on project ranking: When comparing projects with different investment sizes or different timing patterns of cash flows, NPV and IRR can give conflicting rankings — and in these cases, NPV is always correct. A small project with a 40% IRR might create £10,000 in NPV, while a large project with a 15% IRR creates £200,000 in NPV. The 15% IRR project clearly wins on NPV — it creates 20 times more value. The AFP Financial Professionals guide (2026) articulates the resolution: 'A project may require a very large investment, consuming all of a company's capital and producing a large NPV. That big, positive total value may make this look like a winner, but the project could have a low IRR. It may be better to choose three smaller projects that generate the same total NPV if they all have higher IRRs.' The key insight: NPV measures value created in absolute terms; IRR measures efficiency of capital deployment. Both are useful; when they conflict, NPV governs.
Reading NPV Results: The Complete Interpretation Guide
The table below maps every possible NPV outcome to its economic meaning, the correct decision signal, and the key caveats that professional analysts apply in real-world decisions: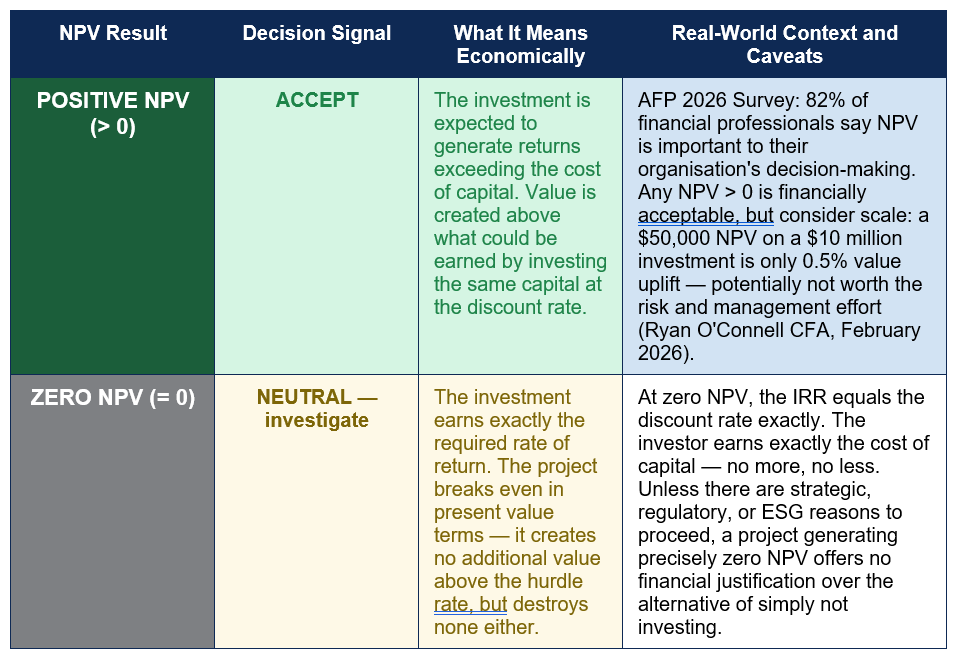
NPV vs IRR vs Payback Period: The Capital Budgeting Methods Compared
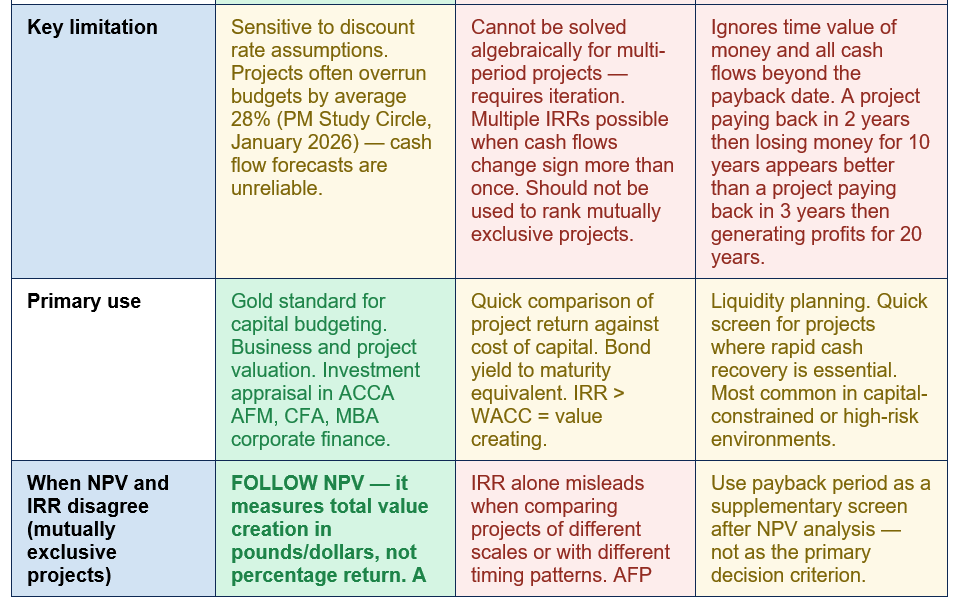
NPV, IRR, and payback period are the three most widely used capital budgeting tools. They measure different things and have different strengths — understanding how they relate is essential for using each correctly: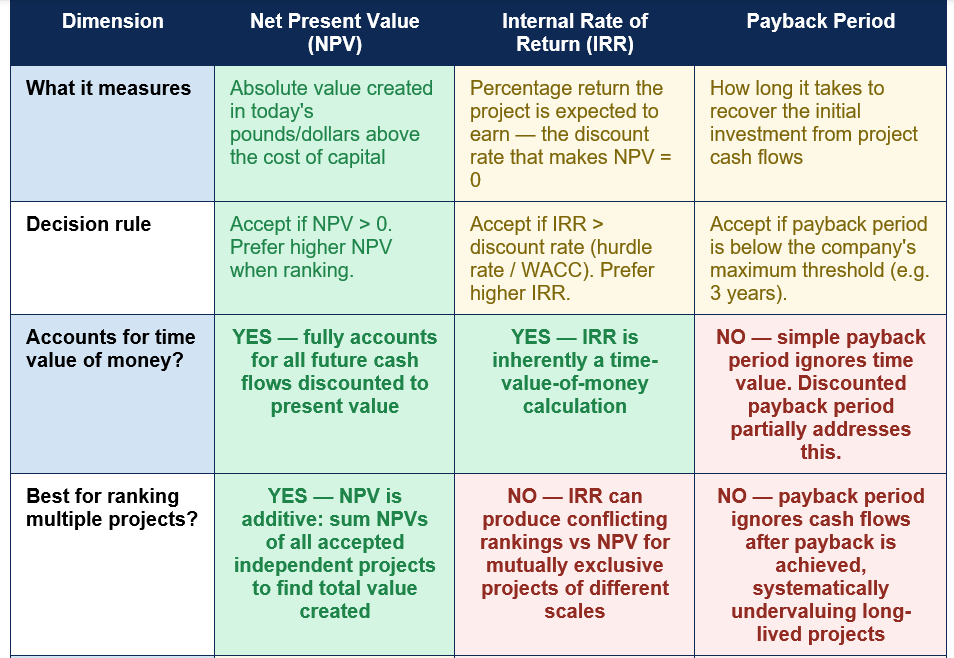

Limitations of NPV: What It Cannot Tell You
NPV is the most rigorous and most widely endorsed capital budgeting metric, but it has significant limitations that every practitioner must understand. A technically correct NPV calculation based on flawed inputs produces a flawed result — and in the real world, inputs are almost always imperfect.- Sensitivity to discount rate: Small changes in the discount rate produce large changes in NPV, particularly for long-duration projects. CFI's April 2026 guide notes: 'A higher discount rate will reduce the present value of future cash flows, potentially leading to a lower NPV, while a lower discount rate will have the opposite effect.' An NPV that is marginally positive at 10% WACC may be substantially negative at 12%. This sensitivity means the choice of discount rate is more consequential than the cash flow projections in many projects.
- Cash flow forecasting uncertainty: NPV depends entirely on the accuracy of the cash flow projections — and those projections are frequently wrong. PM Study Circle (January 2026) cites the broader project management literature: 'Given that many projects overrun budgets by an average of 28 percent, sensitivity analysis is essential.' Real-world projects face cost overruns, revenue shortfalls, delays, and changes in market conditions that the original NPV model did not anticipate.
- Difficulty incorporating real options: A standard NPV calculation treats the investment decision as a now-or-never commitment. In reality, many investments contain embedded options — the option to expand if early results are positive, the option to delay if conditions are unfavourable, the option to abandon if the project fails to meet milestones. These real options add value that the basic NPV formula does not capture. Real options analysis (ROA) extends NPV to value these strategic flexibilities.
- Does not directly account for capital rationing: When a company has more positive-NPV projects than it has capital to fund, NPV alone does not determine which combination of projects to choose. The profitability index (NPV per pound of investment) helps rank projects when capital is constrained. Eduyush: 'NPV is preferred over IRR for ranking projects because it measures absolute value, not percentage return' — but absolute value comparisons require that projects are evaluated under the same capital availability assumption.
- Non-financial factors are excluded: A project with negative NPV may be strategically, regulatorily, or ethically essential. A healthcare company might invest in a safety system with negative NPV because regulation requires it. A manufacturer might proceed with an ESG initiative with negative NPV to maintain a social licence to operate. NPV is a financial criterion, not a complete decision framework. As the AFP Financial Professionals guide acknowledges: 'Practical considerations such as strategic importance, regulatory requirements, funding constraints or ESG goals may lead organisations to pursue projects with lower or even negative NPVs.'
SENSITIVITY ANALYSIS IS NOT OPTIONAL: Every NPV analysis presented to a board, investment committee, or management team should include sensitivity analysis — a table showing how the NPV changes when key assumptions are varied. Standard practice tests at least: three discount rate scenarios (base, +2%, -2%); three revenue/cash flow scenarios (base, optimistic +20%, pessimistic -20%); and the break-even discount rate (the discount rate at which NPV = 0, equivalent to the IRR). PM Study Circle (January 2026): 'The updated Circular A94 encourages analysts to test higher discount rates and compare results. Given that many projects overrun budgets by an average of 28 percent, sensitivity analysis is essential.' An NPV without sensitivity analysis is a point estimate dressed up as certainty. The uncertainty is the point — and quantifying it through sensitivity analysis is what makes NPV analysis genuinely useful for decision-making.
Where NPV Is Used in the Real World
NPV is not confined to textbook investment appraisal problems. It is applied across a wide range of real-world contexts where a present investment is expected to generate future cash flows:- Capital budgeting (the primary use): Businesses use NPV to evaluate whether to invest in new equipment, factories, technology infrastructure, product launches, geographic expansion, or any other long-term project. The basic rule — invest if NPV > 0, reject if NPV < 0 — provides the financial foundation for these decisions. Abacum: '75% of large corporations consistently employ NPV analysis in their investment decision-making.'
- Mergers and acquisitions (M&A): Investment banks and corporate finance teams use NPV (through the DCF methodology) to estimate the value of an acquisition target and assess whether the acquisition price represents a positive-NPV investment. CFI (April 2026): 'To value a business, an analyst will build a detailed discounted cash flow (DCF) model in Excel. This financial model will include all revenues, expenses, capital costs, and details of the business.'
- Real estate development: Property developers use NPV to evaluate whether a development project — accounting for construction costs, financing costs, expected rental income, and eventual sale value — generates a positive return above the cost of capital. Abacum: 'Developers assess the viability of projects by estimating future rental income and associated costs. By calculating the NPV of a real estate investment, developers can make informed decisions about whether to proceed.'
- Personal investment decisions: The same NPV logic applies to personal financial decisions: should I take this MBA at a cost of £60,000 in fees and two years of lost income, in exchange for a higher salary over 30 years? CFI: 'A rational investor would be willing to pay up to $61,466 today to receive $10,000 every year over 10 years' at a 10% discount rate. That $61,466 is the NPV of a 10-year $10,000 annual annuity at 10% — a personal investment decision framed as an NPV calculation.
- ACCA, CFA, CPA, and MBA professional exams: NPV is a core topic in all major finance and accounting professional qualifications. Eduyush's February 2026 guide confirms: 'NPV is used in corporate finance for capital budgeting, in investment banking for DCF business valuations, in strategic planning for major expansion decisions, and in professional certification exams including ACCA AFM, CFA, CPA, and MBA corporate finance modules.'
Conclusion
Net Present Value is the gold standard of investment decision-making — and its 82% adoption rate among financial professionals in the AFP's 2026 survey reflects seven decades of practical validation across industries, asset classes, and business sizes. Its logic is elegant: translate all future cash flows into today's money using a discount rate that reflects the cost and risk of capital, subtract the initial investment, and if the result is positive, the investment creates value. If negative, it destroys value relative to simply investing the capital at the required rate of return.The formula NPV = Σ[CFₙ ÷ (1+r)ⁿ] − C₀ has four inputs that determine the output: the cash flow forecasts, the discount rate, the project timeline, and the initial investment. Of these, the cash flow forecasts and the discount rate are the two most consequential — and the two most uncertain. A change of 2 percentage points in the discount rate can move a marginally positive NPV to a negative territory. A 28% cost overrun (the average for capital projects according to PM Study Circle's January 2026 data) can similarly transform a positive-NPV project into a negative-NPV outcome. These sensitivities are why sensitivity analysis is not an optional appendix to NPV analysis but its most essential component.
NPV is the preferred capital budgeting metric over IRR and payback period for one decisive reason: it measures absolute value creation in pounds and dollars, not percentage returns or recovery timing. When NPV and IRR disagree on which of two projects to prefer, follow NPV. When payback period suggests a short-life project over a long-life high-returns project, follow NPV. The NPV rule — accept positive, reject negative, and among competing projects prefer higher NPV — is not just a financial convention. It is the mathematical expression of the fundamental purpose of investment: to create more value than it costs.
0 Comments
Be the first to share your thoughts on this article.