

Investing
What Is a Pullback in Stock Trading? Accountant Explains


Table of Contents
- Why Professionals Buy When Others Panic
- What Is a Pullback in Stock Trading?
- The Price Structure of Pullbacks: Higher Highs and Higher Lows
- How to Identify a Pullback: The Five Key Signals
- Pullback vs Trend Reversal: The Complete Comparison
- Five Proven Pullback Trading Strategies: Method, Entry, Stop
- Worked Example: Trading a Pullback Step by Step
- Risk Management in Pullback Trading
- Conclusion
- Frequently Asked Questions (FAQ)
Why Professionals Buy When Others Panic
When a stock that has been rising strongly suddenly drops 5% or 8% in a few days, two things happen simultaneously: inexperienced investors worry that the trend is over and reach for the sell button, while experienced traders quietly open their spreadsheets and start calculating their entry points. The difference between these two reactions is rooted in a single concept: the pullback. Knowing what a pullback is, how to identify one correctly, how to distinguish it from a genuine trend reversal, and how to trade it with defined risk is one of the most consistently valuable skills in active investing and trading.A pullback is a temporary price decline within an uptrend — a brief counter-trend move against the primary direction before the trend resumes its original course. DayTradingToolkit's updated June 2026 guide captures the essence of why professional traders seek them out: 'Instead of chasing a stock after it's already made a big move up — which often feels like showing up late to the party and getting a bad seat — you wait patiently for it to take a little breather, pull back towards a support level, show signs of wanting to go back up, and then you jump in.' The pullback is the moment the market offers a second-chance entry into an established trend at a better price than was available at the breakout.
This guide explains pullback trading comprehensively: the precise definition, the price structure of higher highs and higher lows that defines an uptrend and its pullbacks, the typical depth and duration of healthy pullbacks, the five key characteristics that separate a pullback from a reversal, the five most effective pullback trading strategies (moving average, Fibonacci, trendline, breakout retest, and structure-based), the worked example of a real pullback trade with entry, stop, and target, and the risk management rules that prevent a misidentified pullback from becoming a catastrophic loss.
What Is a Pullback in Stock Trading?
A pullback in stock trading is a temporary price decline within an established uptrend — a short-lived counter-trend move that pauses or partially reverses recent gains before the primary trend resumes its upward direction. The Moomoo trading education guide (2024) defines it within the context of market wave structure: 'A pullback in technical analysis refers to a temporary price correction against the prevailing trend. It is sometimes known as retracement. It happens when prices slightly withdraw from recent highs or lows and usually unfolds over a few days to weeks on a daily chart before the initial trend picks back up.'The essential characteristic of a pullback is its temporary nature — it is a pause in a trend, not a reversal of it. Capital.com's 2026 pullback trading guide articulates the structural rule that defines this distinction in uptrends: 'Uptrend: price makes higher highs (HH) and higher lows (HL). A pullback is the move from HH to HL. Continued uptrends would respect this structure — the new low remains above the previous low.' This higher-low structure is the mathematical definition of an uptrend, and a pullback — by definition — must respect it. If the 'pullback' breaks below the previous higher low, the trend structure has been violated and what appeared to be a pullback may be a reversal.
In terms of magnitude, Moomoo identifies the typical pullback range: 'Pullbacks occur when the price starts to retrace a portion of its prior upward movements, typically no more than 5-10% decline in price. These moves against the trend are generally brief and often halt at potential support zones before the price resumes its climb.' A 5-10% pullback in a strong uptrend is normal, healthy, and frequently represents the best buying opportunity the trend will offer. A decline of 20% or more is typically categorised as a correction, and a decline beyond the prior swing low begins to raise genuine reversal concerns.
Pullbacks are also known by several alternative names depending on context: retracement, dip, correction (in milder form), and consolidation. DayTradingToolkit captures the full vocabulary: 'You've probably heard the phrases buy the dip or sell the rip. That's essentially what pullback trading is all about.' The buy-the-dip concept — entering or adding to a position during the temporary decline — is the most widely practised form of pullback trading in both professional and retail investing.
Pullback frequency in real markets: Of 10,348 chart patterns studied across July 1991 to March 2005, 2,738 — approximately 26.5% — had pullbacks — Thomas Bulkowski (ThePatternSite.com, research spanning 2005-2026): comprehensive study of pullback behaviour across 19 chart pattern types. Key finding: 'During a pullback attempt, if price remains below the breakout price, expect a more powerful move than if price rises above the breakout.' Bulkowski found that when price remained at or below the breakout level during a pullback, the subsequent directional move averaged 25% — versus 20% when price climbed above the breakout during the pullback. Deeper, more restrained pullbacks often precede stronger trend continuation
The Price Structure of Pullbacks: Higher Highs and Higher Lows
Understanding pullbacks requires first understanding the wave structure of trending markets. Markets do not move in straight lines in either direction. An uptrend is not a vertical line — it is a series of advancing waves punctuated by declining corrections. Each new high is higher than the previous high (a higher high), and each new low made during corrections is higher than the previous low (a higher low). This staircase pattern — higher highs and higher lows — is the textbook definition of an uptrend.Within this structure, the move from a higher high to the subsequent higher low is precisely the pullback. Capital.com articulates the structural rule: 'In pullback trading, you would only trade pullbacks in the direction of the strong trend.' This means that in an uptrend, the only valid pullback trade is a long entry (buying) during the dip from a higher high toward the expected higher low — in anticipation of the trend resuming upward to make a new higher high. Trading against the trend during a pullback — shorting the stock as it dips — is trading against the path of least resistance and against the entire body of trend-following evidence.
The mirror image applies in downtrends. A downtrend consists of lower lows and lower highs. The 'pullback' in a downtrend is the temporary bounce from a lower low back toward the previous lower high — a counter-trend rally that experienced short sellers use as an opportunity to add to or initiate short positions at a better price, before the downtrend resumes. DayTradingToolkit: 'In a downtrend, it's the mirror image: wait for a temporary rally back up to resistance, see signs of sellers stepping back in, and then look to short it.'
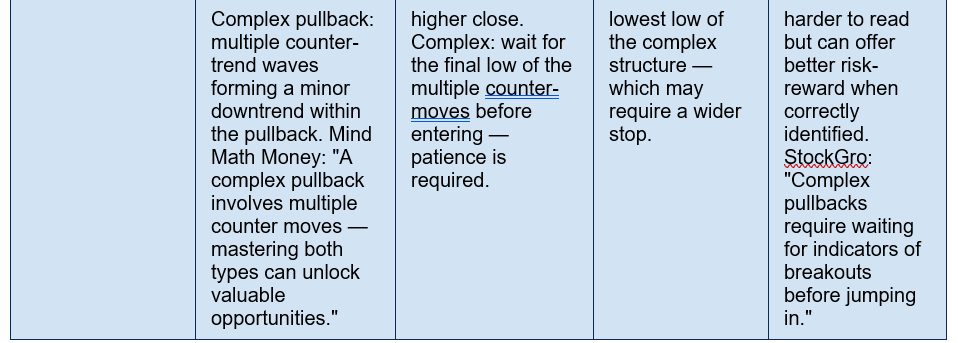
Simple vs complex pullbacks — the structural distinction that changes your entry approach: Mind Math Money's December 2025 guide identifies two fundamentally different types of pullback structure that require different entry timing. A simple pullback is a single, clean, straight-line counter-trend move — one wave down, then resumption. Entry is straightforward: wait for the reversal candle at the support level and enter. A complex pullback contains multiple counter-trend waves — the price moves down, then up slightly, then down again, creating a miniature downtrend within the overall pullback. Complex pullbacks are harder to enter during the pullback because each small recovery looks like the resumption until it is not. The correct approach: wait for the complex structure to complete (the final lower low of the complex correction) before entering. StockGro confirms: 'Complex pullbacks require waiting for indicators of breakouts before jumping in.' Misidentifying a complex pullback as a simple one and entering too early is one of the most common and most costly pullback trading errors.
How to Identify a Pullback: The Five Key Signals
Correctly identifying a pullback — as opposed to a trend reversal or random noise within a ranging market — is the foundational skill of pullback trading. The following five signals, taken together, provide the most reliable confirmation that a price decline is a genuine pullback rather than the beginning of a reversal:- The primary trend is clearly established: No pullback strategy works in isolation from trend identification. DayTradingToolkit: 'Trending Market Environment: When the overall market (S&P 500, Nasdaq) is in a trending phase, individual stocks tend to follow suit. Pullback trading in individual names works better when the broader market has your back. Choppy, Range-Bound Markets: When there's no clear trend, pullbacks are really just noise within a range.' Confirm the primary trend before looking for pullbacks. If the daily chart does not show a clear series of higher highs and higher lows, there is no trend to pull back from.
- Volume declines during the pullback: One of the most reliable pullback confirmation signals. Indicator Vault identifies the volume pattern: 'The initial breakout should show high volume, while the pullback phase typically shows lighter volume, followed by expansion on the bounce.' When price declines on shrinking volume, it indicates that sellers are not particularly committed — profit-takers and short-term sellers are causing the dip, not a broad shift in market conviction. When volume expands on the bounce back up, it confirms that buyers are returning.
- Candlestick character is indecisive, not aggressive: Healthy pullback candles are small-bodied, often mixed in colour (red and green alternating), with multiple wicks indicating price indecision. Mind Math Money: 'Pullbacks often have small candle bodies compared to the previous impulsive move. It is normal to find spinning top and doji candles within the pullback. Candles of different colours indicate a pause in the trend, with buying and selling pressure balancing temporarily.' Large, aggressive red candles closing near their lows are more characteristic of reversal selling.
- Price holds at a meaningful technical support level: A genuine pullback tends to halt at a recognisable technical level — a prior support zone, the 20-day or 50-day moving average, a Fibonacci retracement level (38.2%, 50%, or 61.8%), or the level of a prior breakout. DayTradingToolkit: 'Healthy, Structured Pullbacks: the pullbacks you want to trade are orderly and respect technical levels. They pull back to logical support areas (MAs, Fib levels, prior support) and show signs of holding.' A pullback that drifts past all logical support levels without pausing is a warning sign.
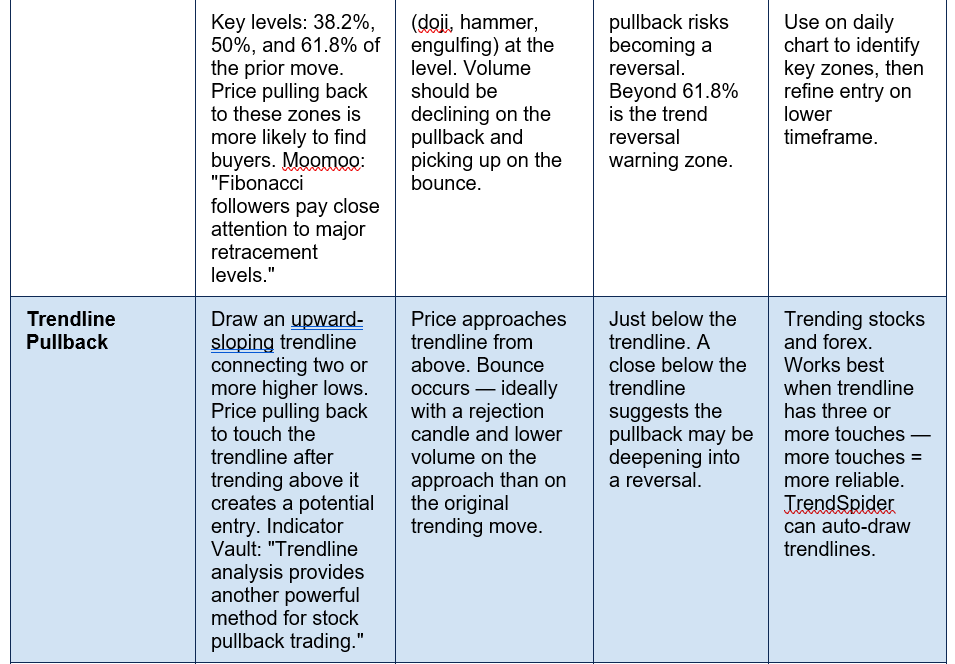
- The depth stays within the Fibonacci 61.8% guideline: Moomoo's trading guide provides the quantitative depth guideline: 'As a rule of thumb, the price retracement should not surpass 61.8% of the prevailing trend, or it would be considered a trend reversal, which signifies a more fundamental shift in the market's direction.' The three Fibonacci retracement levels most commonly used as pullback targets are 38.2% (shallow pullback in a strong trend), 50% (moderate pullback, balanced conditions), and 61.8% (deeper pullback approaching the reversal warning zone).
Pullback vs Trend Reversal: The Complete Comparison
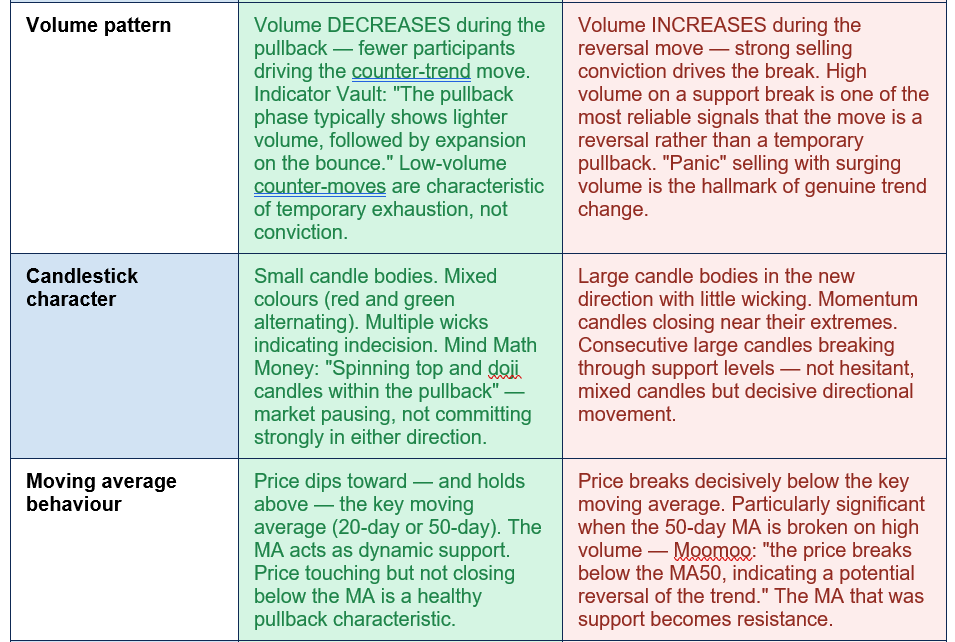
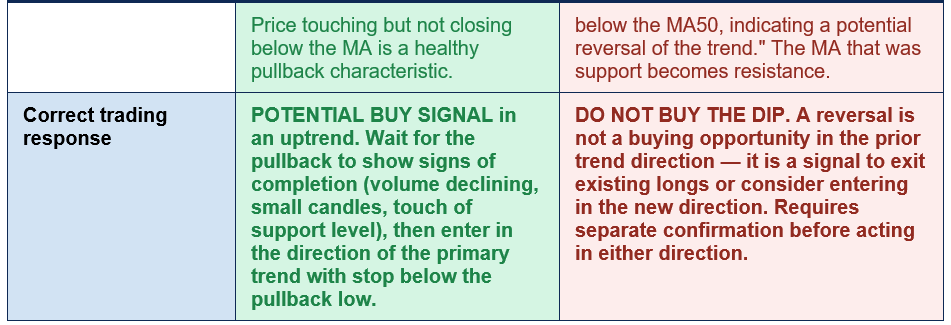
The most consequential skill in pullback trading is correctly distinguishing a pullback from a reversal. Buying a reversal in the belief that it is a pullback can result in substantial losses as the trend continues in the opposite direction. The table below maps every key characteristic to help make this distinction: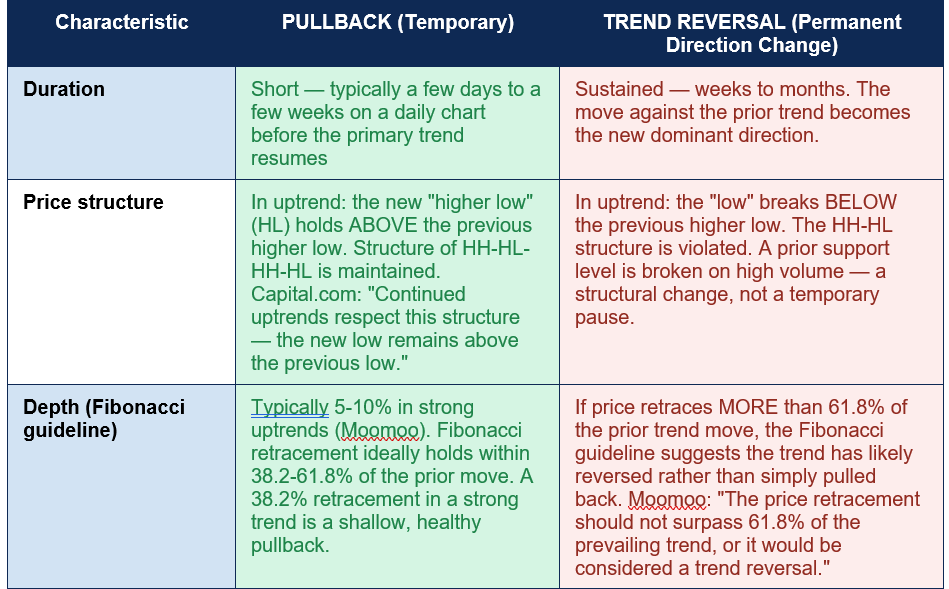
Five Proven Pullback Trading Strategies: Method, Entry, Stop
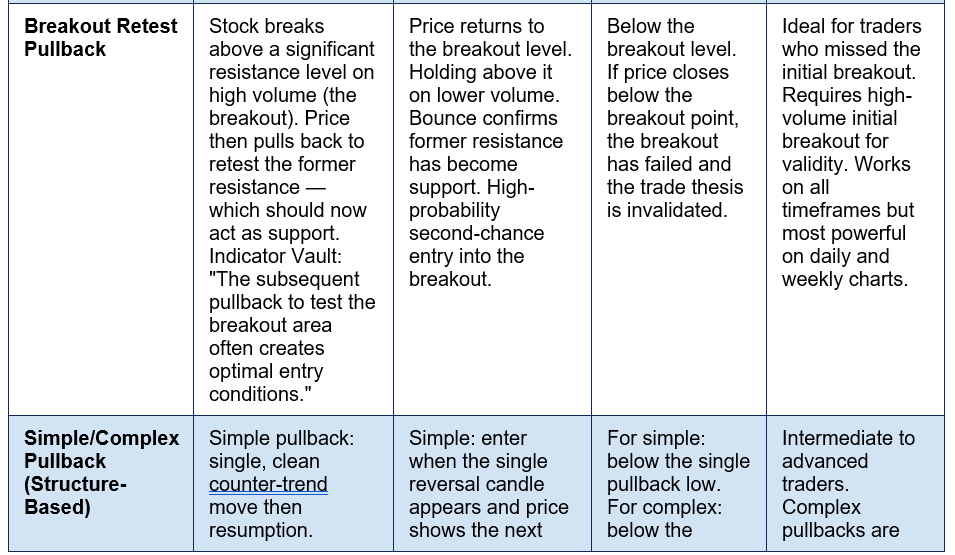
There is no single correct way to trade a pullback — experienced traders use multiple methods, often in combination, to confirm entries. The table below maps the five most widely used pullback strategies with entry signals, stop loss placement, and the optimal context for each: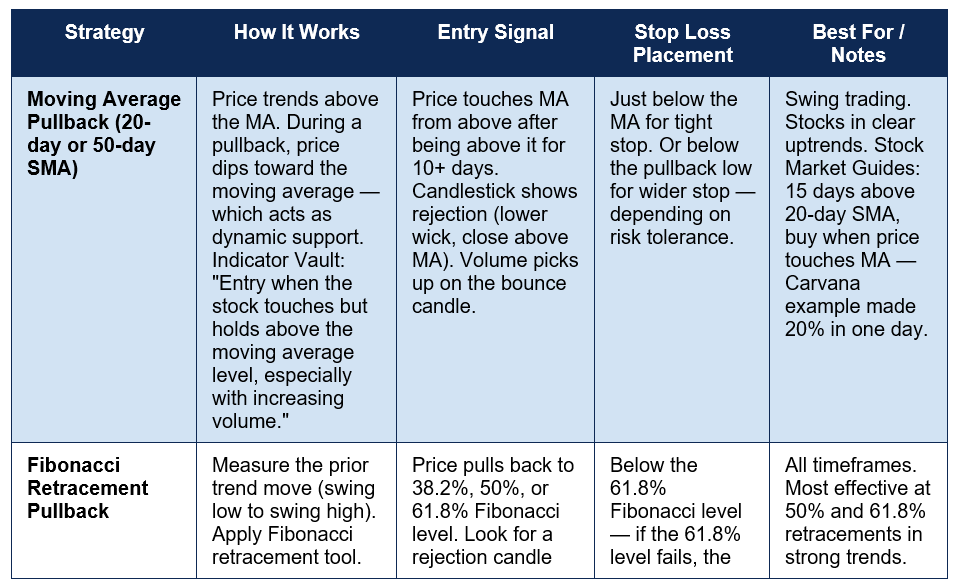
Worked Example: Trading a Pullback Step by Step
The following worked example is based on the Gotrade (January 8, 2026) pullback trade scenario — a stock in a clear uptrend that pulls back from $70 to $65 before resuming its trend: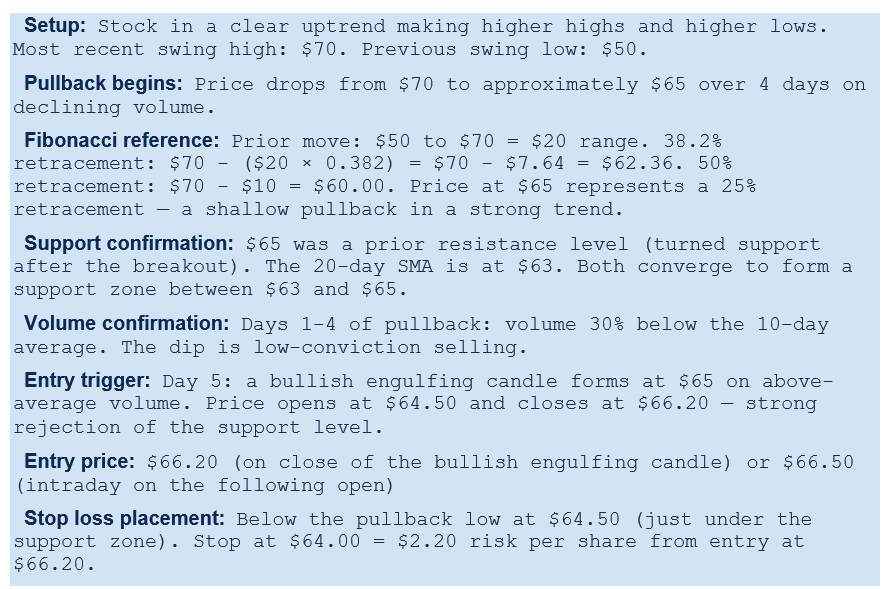
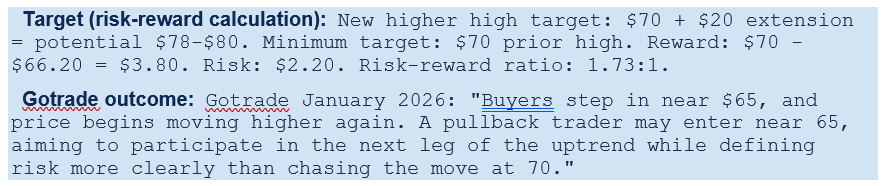
This example illustrates every principle simultaneously: confirmed uptrend structure, a shallow pullback within the Fibonacci 38.2-50% zone, price holding at a meaningful technical support level (prior resistance turned support, near the 20-day SMA), declining volume on the dip and expanding volume on the reversal candle, a defined entry, a stop below the pullback low, and a risk-reward ratio above 1.5:1. These elements together constitute a textbook pullback trade.
Risk Management in Pullback Trading
Pullback trading is often described as a lower-risk entry method compared to buying breakouts — and in the context of the specific risk metrics, this is accurate. Capital.com: 'It also helps you place a tighter stop loss — translates to lower risk and a better risk/reward ratio. Trading pullbacks means you're trading along the path of least resistance.' However, no trading strategy has a 100% success rate, and the effective pullback trader builds risk management into every trade before entering:- Always use a stop loss below the pullback low: Gotrade (January 2026): 'Stop loss levels are usually placed beyond the pullback area to limit losses if the trend fails.' If the stock breaks below the pullback low, the higher-low structure of the uptrend has been violated — the trade thesis is invalidated and the position must be exited. No discretionary holding through a broken stop in pullback trading.
- Target a minimum 1.5:1 risk-reward ratio: The pullback entry provides a clear stop level and a clear profit target (the prior high, then the projected extension). Before entering any pullback trade, calculate: (target − entry) ÷ (entry − stop) ≥ 1.5. If the ratio is below 1.5:1, the trade is not worth taking regardless of how compelling the setup looks.
- Do not trade pullbacks in choppy, range-bound markets: DayTradingToolkit is explicit: 'When there's no clear trend, pullbacks are really just noise within a range.' Attempting to trade pullbacks in markets without a defined trend produces random outcomes. Confirm the trend on the daily chart before dropping to lower timeframes for entry.
- Size positions to risk no more than 1-2% of total capital: Even correctly identified pullbacks can turn into reversals. Position sizing that limits the maximum loss on any single trade to 1-2% of total trading capital ensures that a string of losing trades does not eliminate the account. This is the fundamental risk management rule that separates sustainable trading from gambling.
- Use the broader market context: DayTradingToolkit confirms that individual stock pullbacks work best when the broader market is trending in the same direction. When the S&P 500 or Nasdaq is pulling back itself, individual stock pullbacks carry more risk — the broader selling pressure can overwhelm the stock-specific technical setup. Check the broader market trend before entering any individual stock pullback.
THE REVERSAL TRAP — THE PULLBACK TRADER'S GREATEST RISK: The most dangerous scenario in pullback trading is buying what appears to be a healthy pullback that is actually the beginning of a reversal. This is precisely the situation where losses can escalate well beyond the planned stop loss — particularly if the stock gaps down through the stop overnight, or if news or earnings drive a sudden, large decline. The 61.8% Fibonacci rule is the most reliable quantitative guard against this: if the pullback exceeds 61.8% of the prior trend move, the probability that it is a reversal has increased significantly. The volume rule is equally important: if the pullback is occurring on high volume — particularly large red candles closing near their lows — this is characteristic of reversal selling, not temporary profit-taking. Capital.com's risk warning: 78.48% of retail CFD investor accounts lose money when trading. Never trade pullbacks without a defined stop loss, and never move a stop loss further away to give a trade 'more room' — that defeats the entire risk-management purpose of placing it.
Conclusion
A pullback in stock trading is a temporary price decline within an uptrend — a brief counter-trend move that offers a second-chance entry into an established trend at a better price than chasing the breakout would provide. In an uptrend defined by higher highs and higher lows, the pullback is the move from a higher high to the next higher low: temporary, typically 5-10% in depth, occurring on declining volume, with small indecisive candlesticks, and halting at a meaningful technical support level such as the 20-day or 50-day moving average, a Fibonacci retracement level (38.2%, 50%, or 61.8%), or a prior breakout zone.Thomas Bulkowski's research across 10,348 chart patterns found that 26.5% contained pullbacks — confirming that they are a regular and predictable feature of trending market behaviour. The five pullback trading strategies covered in this guide — moving average pullback, Fibonacci retracement pullback, trendline pullback, breakout retest pullback, and structure-based (simple/complex) pullback — each provide a systematic framework for identifying entry points, placing stops, and calculating risk-reward ratios before entering a trade.
The critical distinction that separates profitable pullback traders from those who consistently buy reversals is the disciplined application of five confirmatory checks: established primary trend, declining pullback volume, indecisive candlestick character, halt at a technical support level, and depth within the 61.8% Fibonacci guideline. When all five are present, a pullback represents one of the highest-probability, best-defined-risk entries available in trend-following trading. When any of the five is conspicuously absent — particularly the volume signal and the Fibonacci depth constraint — the 'pullback' deserves heightened scrutiny before capital is committed. The stop loss placed below the pullback low is non-negotiable: it is both the risk limit and the logical invalidation of the trend-continuation thesis.
0 Comments
Be the first to share your thoughts on this article.