
Investing
Best Monthly Dividend ETFs: JEPI, JEPQ, QYLD and More

JEPI has $45 billion in assets. JEPQ returned 22% in one year. QYLD has paid every month for nine years. Here are the seven best monthly dividend ETFs, what they actually do, and the trade-offs that the yield numbers alone do not reveal.
Monthly dividend ETFs have become one of the fastest-growing categories in income investing. For retirees managing a budget aligned with monthly expenses, for income investors who want to see their investment working every month rather than every quarter, and for anyone who prefers the discipline of regular cash flow, the monthly payment structure is genuinely useful. What is less useful is selecting a monthly dividend ETF based on yield alone, without understanding the strategy producing that yield and the trade-off it contains. A 20% yield from a volatility-harvesting ETF is a different proposition from a 7.9% yield from a covered-call strategy on the S&P 500. Both pay monthly. Both carry meaningfully different risk profiles. This guide covers seven of the best monthly dividend ETFs available in 2026, with current yield data, AUM, expense ratios, and a clear-eyed account of what each one actually does and who it is best for.
But the growth of monthly dividend ETFs is not only a retiree story. The covered-call ETF category — which produces monthly income by selling options against equity positions — has grown dramatically among all income investors as a way to generate yield in a market environment where bond yields, while improved from zero-rate era lows, remain insufficient for many income needs. JEPI now holds over $45 billion in assets. JEPQ has accumulated $39 billion. The category has moved from a niche product for sophisticated options traders to a mainstream income vehicle for retail investors who want monthly cash flow from equity-based strategies.
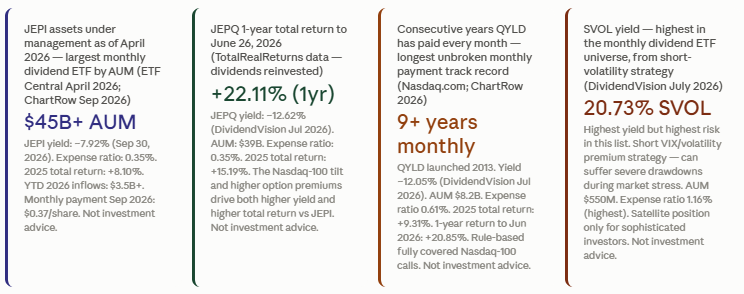
JEPI AUM: $45.34B (ETF Central April 2026). JEPQ AUM: $39B (DividendVision July 2026). QYLD AUM: $8.2B. Only 2 large-cap individual stocks pay monthly dividends — monthly income is primarily an ETF phenomenon (ChartRow 2026). Average yield across 15 major monthly income ETFs: 14.47% (DividendVision July 2026).
There are two main structural variants in this list. The first is fully covered calls (QYLD, XYLD, RYLD): the ETF writes call options against 100% of its index exposure every month, systematically capturing option premium but also capping 100% of the upside above the strike price. The second is partial-coverage or equity-linked note (ELN) structures (JEPI, JEPQ): these ETFs write call options against a portion of the portfolio, preserving some equity upside while still generating substantial monthly income from premiums. The difference matters: fully covered strategies produce higher and more predictable income but sacrifice the most growth. Partial-coverage strategies produce somewhat lower income but allow more equity appreciation. Tickflow.io’s guide summarises the dynamic: ‘The high yields come with trade-offs including capped upside participation and varying tax treatment.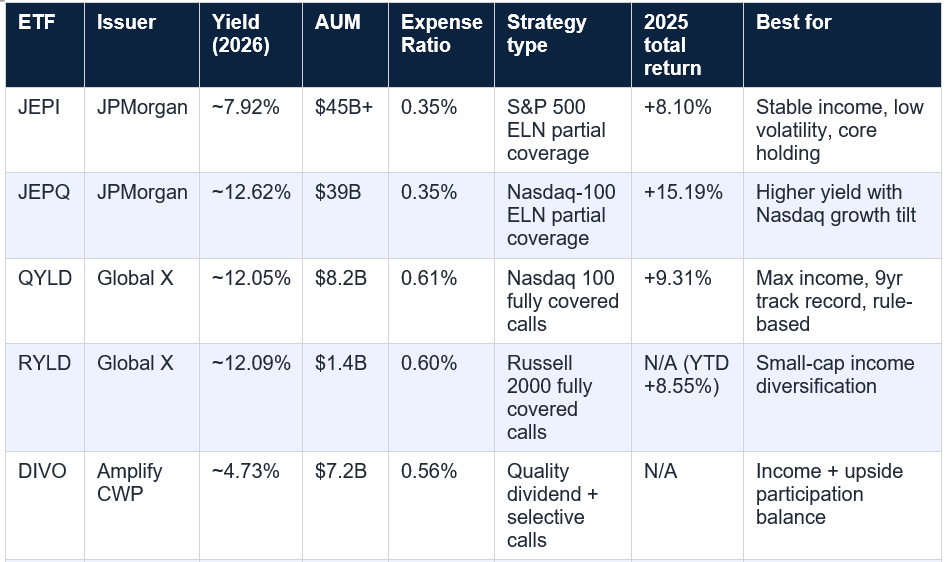

Ticker: JEPI | Issuer: JPMorgan | Yield: ~7.92% (Sep 2026) | AUM: $45B+ | Expense ratio: 0.35% | Frequency: monthly | 2025 total return: +8.10% | YTD 2026: ~+2% | Inception: 2020. Sources: ChartRow Sep 30, 2026; ETF Central April 2026.
The ELN strategy caps S&P 500 upside. When equities rally strongly, JEPI underperforms a pure S&P 500 index fund. JEPI is an income tool, not a growth tool. Its monthly distributions also vary — $0.34 in February 2026 to $0.45 in May 2026 — so income is not perfectly predictable.
Income-focused investors who want moderate yield (~8%), large-fund stability, low expense ratio, and smoother volatility than higher-yield alternatives. Retirees and near-retirees who want monthly income from S&P 500 exposure without full market risk.
Ticker: JEPQ | Issuer: JPMorgan | Yield: ~12.62% (Jul 2026) | AUM: $39B | Expense ratio: 0.35% | Frequency: monthly | 2025 total return: +15.19% | 1-year return (to Jun 2026): +22.11% | Inception: 2022. Sources: DividendVision July 2026; TotalRealReturns June 2026.
Higher yield comes with higher Nasdaq-100 concentration and greater sensitivity to tech-sector drawdowns. More volatile than JEPI. When the Nasdaq falls, JEPQ falls harder. The ELN strategy caps upside on the Nasdaq-100, meaning it underperforms during strong rallies.
Investors who want JEPI-style monthly income but with a Nasdaq growth tilt and higher yield (~12%). Suitable for those comfortable with tech-sector concentration and higher volatility in exchange for the additional income and growth potential.
Ticker: QYLD | Issuer: Global X | Yield: ~12.05% (Jul 2026) | AUM: $8.2B | Expense ratio: 0.61% | Frequency: monthly | 9+ consecutive years of monthly payments | 2025 total return: +9.31% | 1-year return (to Jun 2026): +20.85%. Sources: DividendVision July 2026; TotalRealReturns June 2026; Nasdaq.com.
Fully covered calls = most capped upside of any strategy in this list. The expense ratio of 0.61% is significantly higher than JEPI/JEPQ. On a long-term total return basis, the combination of capped upside and higher fees tends to underperform partial-coverage strategies. Some distributions may include return of capital (ROC).
Income-primary investors who want a rule-based, consistent monthly payer with a 9+ year track record and the highest yield in the mainstream covered-call category. Those who do not need price appreciation and want the discipline of a fully systematic income strategy.
Ticker: RYLD | Issuer: Global X | Yield: ~12.09% (Jul 2026) | AUM: $1.4B | Expense ratio: 0.60% | Frequency: monthly | 2026 YTD: +8.55% (to Jun 2026) | Volatility: 10.87% past year. Sources: DividendVision July 2026; ETF Central June 2026.
Higher volatility (10.87%) than JEPI or QYLD. Smaller AUM limits liquidity for large positions. Small-cap exposure adds factor risk beyond the option-writing strategy. Russell 2000 tends to underperform in risk-off environments more than large-cap indices.
Investors already holding JEPI or JEPQ who want to diversify their covered-call income across index exposures, or those specifically seeking small-cap income with a rule-based monthly structure. Not for sole-holding income investors who prioritise stability.
Ticker: DIVO | Issuer: Amplify ETFs (CWP) | Yield: ~4.73% (Jul 2026) | AUM: $7.2B | Expense ratio: 0.56% | Frequency: monthly | Strategy: quality dividend stocks + selective call-writing. Sources: DividendVision July 2026; ChartRow 2026.
Lower yield (~4-5%) than the other ETFs in this list. Higher expense ratio than JEPI/JEPQ. The active management component means outcomes depend on call-writing timing decisions, which adds a layer of manager-discretion risk.
Total-return-conscious income investors who want monthly income but are not willing to accept fully capped equity upside. A good middle ground between a growth index fund and a high-yield covered-call ETF. Those who prioritise income quality and equity upside participation over maximising yield.
Ticker: XYLD | Issuer: Global X | Yield: ~8-10% (indicative) | Expense ratio: 0.60% | Frequency: monthly | 2025 total return: +8.04% | 2026 YTD: +4.52% (to Jun 2026) | 1-year return: +15.19% (to Jun 2026). Sources: TotalRealReturns June 2026.
Expense ratio 0.60% — higher than JEPI. Fully capped S&P 500 upside. Lower yield than QYLD (less volatile index = lower option premiums).
Investors wanting systematic S&P 500 covered-call income with a longer track record than JEPI and no Nasdaq concentration. Portfolio builders adding S&P 500 monthly income to complement Nasdaq-focused ETFs.
Ticker: SVOL | Issuer: Simplify ETFs | Yield: ~20.73% (Jul 2026) | AUM: $550M | Expense ratio: 1.16% (highest in list) | Frequency: monthly | Strategy: short VIX/volatility premium. Sources: DividendVision July 2026.
Highest risk in this list. Short volatility strategy can suffer severe drawdowns during market stress events. Expense ratio of 1.16% significantly higher than all other ETFs listed. Not suitable as a core holding. Suitable only for sophisticated investors who fully understand VIX mechanics and short volatility risk.
Specialist investors who understand volatility markets and want exposure to the volatility risk premium as a yield source. Should be used as a small satellite position only — not as a core income holding.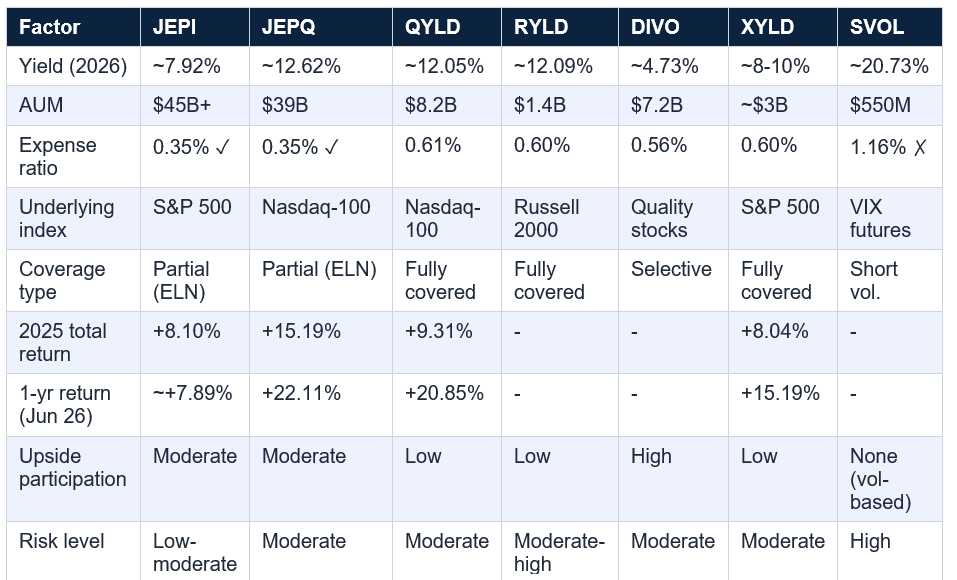

For investors comfortable with higher yield and more systematic income, QYLD alongside JEPI provides both S&P 500 and Nasdaq covered-call income at the cost of more fully capped upside. RYLD adds small-cap income diversification for those building a multi-index covered-call portfolio. The key point is that these ETFs are income tools, not growth tools. Their role in a portfolio is to generate monthly cash flow with moderate equity exposure — not to outperform the S&P 500 index on a total return basis. Investors who hold JEPI expecting index-fund-level price appreciation alongside a 7.9% yield will be disappointed. Investors who hold it for the 7.9% monthly income and accept the partial equity upside it provides will typically be satisfied. Not investment or financial advice. Individual circumstances vary. Consult a qualified financial adviser.
Before investing in any ETF on this list: check whether the yield includes return of capital (ROC) — some covered-call ETF distributions include portions of your own capital returned to you, which does not represent earned income. Check your broker's '1099-DIV' classification (US) or the ETF's annual report for distribution breakdown. Return of capital reduces your cost basis rather than generating income.
The questions worth answering before investing in any of these ETFs: What is the strategy actually doing to produce that yield? What upside is being sacrificed? How does the yield and total return compare to alternatives? What is the tax treatment of the distributions? And how does this ETF fit in the context of the full portfolio? The seven ETFs in this guide each answer those questions differently. Not investment or financial advice. Past performance does not predict future results. Consult a qualified, regulated financial adviser for guidance specific to your circumstances.
Among the major monthly dividend ETFs tracked in 2026, SVOL (Simplify Volatility Premium ETF) has the highest yield at approximately 20.73% (DividendVision, July 2026), followed by RYLD at ~12.09%, JEPQ at ~12.62%, and QYLD at ~12.05%. However, SVOL's yield comes from a short-volatility strategy that carries significantly higher risk than covered-call equity ETFs — it can suffer severe drawdowns during market volatility spikes. Among the more widely held equity-based monthly ETFs, JEPQ offers the highest yield at approximately 12.62% with $39 billion in AUM. JEPI offers a lower yield of ~7.92% but with larger AUM ($45B+), lower volatility, and a lower expense ratio. Sources: DividendVision July 2026; ChartRow 2026. Past performance does not predict future returns.
Is JEPI or JEPQ better for monthly income?
The choice depends on your priorities. JEPI offers approximately 7.92% yield on S&P 500 exposure with lower volatility (8.17-8.65%), larger AUM ($45B+), and the same 0.35% expense ratio — making it the more conservative core income holding. JEPQ offers approximately 12.62% yield on Nasdaq-100 exposure with more growth potential, but higher volatility and more technology concentration. DividendVision's July 2026 analysis positions JEPQ as the top JEPI alternative for investors wanting 'a higher yield, a Nasdaq tilt, or better tax treatment.' JEPQ's 2025 total return of +15.19% and 1-year return of +22.11% to June 2026 (TotalRealReturns) significantly exceeded JEPI's +8.10% and +7.89% in the same periods. If you want stable, lower-volatility monthly income: JEPI. If you want higher yield with Nasdaq growth exposure: JEPQ. Many investors hold both. Sources: DividendVision July 2026; ETF Central; TotalRealReturns June 2026.
What is the difference between QYLD and JEPQ?
Both write covered calls on the Nasdaq-100, but the structure is fundamentally different. QYLD writes fully covered calls — selling away 100% of the index upside above the strike every month. This maximises income but completely caps participation in Nasdaq rallies. JEPQ uses equity-linked notes (ELNs) to write partial coverage, preserving some upside while still generating substantial income. The result: QYLD yielded ~12.05% in July 2026 vs JEPQ's ~12.62% — similar yield, but very different total return profiles. JEPQ's 2025 return of +15.19% vs QYLD's +9.31% reflects the difference between partial and full coverage. QYLD has a significantly longer track record (2013 vs 2022) and 9+ consecutive years of monthly payments. JEPQ is newer but has outperformed QYLD in recent periods. Sources: DividendVision July 2026; TotalRealReturns June 2026; Nasdaq.com.
Are monthly dividend ETF distributions taxed as ordinary income?
Tax treatment varies by ETF structure and distribution type. For covered-call ETFs: the option premium income is generally classified as short-term capital gains or ordinary income (less favourable tax treatment than qualified dividends). Some distributions may include return of capital (ROC), which is not taxed when received but reduces your cost basis — affecting capital gains tax when you sell. Bond-focused ETFs distributing interest income are generally ordinary income. Tickflow.io's June 2026 guide notes that 'the high yields come with trade-offs including capped upside participation and varying tax treatment.' For US investors, 1099-DIV forms will classify distributions. Holding these ETFs in tax-advantaged accounts (IRA, 401k, ISA in the UK) eliminates the annual tax drag on distributions. Tax treatment is complex and individual-specific. This is not tax advice — consult a qualified tax professional. Sources: Tickflow.io June 2026; Freenance.io 2026.
Should I hold monthly dividend ETFs in a retirement account?
For most investors, holding covered-call and high-yield ETFs in a tax-advantaged account (Roth IRA, traditional IRA, 401k in the US; ISA or SIPP in the UK) is more tax-efficient than holding them in a taxable brokerage account. In a taxable account, the monthly distributions create annual tax events — and the option premium income from covered-call ETFs is typically taxed as ordinary income rather than at the lower qualified dividend rate. In a tax-advantaged account, the monthly distributions can compound without annual tax drag. The trade-off with a Roth IRA is that you give up the immediate tax deduction on contributions, but qualified distributions in retirement are tax-free. For retirees already drawing on the income, the choice between Roth and traditional depends on current vs expected future tax rates. This is not tax or financial advice — consult a qualified financial adviser. Sources: general tax principles; Freenance.io 2026 on tax treatment.
Monthly dividend ETFs have become one of the fastest-growing categories in income investing. For retirees managing a budget aligned with monthly expenses, for income investors who want to see their investment working every month rather than every quarter, and for anyone who prefers the discipline of regular cash flow, the monthly payment structure is genuinely useful. What is less useful is selecting a monthly dividend ETF based on yield alone, without understanding the strategy producing that yield and the trade-off it contains. A 20% yield from a volatility-harvesting ETF is a different proposition from a 7.9% yield from a covered-call strategy on the S&P 500. Both pay monthly. Both carry meaningfully different risk profiles. This guide covers seven of the best monthly dividend ETFs available in 2026, with current yield data, AUM, expense ratios, and a clear-eyed account of what each one actually does and who it is best for.
Table of Contents
- Why Monthly Dividend ETFs Have Grown So Fast
- How Covered-Call ETFs Generate Monthly Income
- The 7 Best Monthly Dividend ETFs at a Glance
- JEPI: JPMorgan Equity Premium Income ETF
- JEPQ: JPMorgan Nasdaq Equity Premium Income ETF
- QYLD: Global X Nasdaq 100 Covered Call ETF
- RYLD: Global X Russell 2000 Covered Call ETF
- DIVO: Amplify CWP Enhanced Dividend Income ETF
- XYLD: Global X S&P 500 Covered Call ETF
- SVOL: Simplify Volatility Premium ETF
- Monthly Dividend ETF Comparison Table
- Building a Monthly Income Portfolio With ETFs
- Conclusion: Yield Is the Start, Not the End
- Frequently Asked Questions
Why Monthly Dividend ETFs Have Grown So Fast
Monthly dividend ETFs exist to solve a specific and practical problem: the mismatch between investment income and real-world expenses. Most bills arrive monthly. Most traditional investment income arrives quarterly or annually. For retirees drawing on an investment portfolio to cover living expenses, the quarterly dividend structure means either holding cash between payments or selling assets at inopportune times. Monthly distributions eliminate the timing mismatch, delivering income on the same cadence as mortgages, utility bills, and grocery spending. Tickflow.io’s June 2026 guide confirms this driver directly: monthly dividend ETFs are ‘popular with retirees who prefer income aligned with monthly expenses.’But the growth of monthly dividend ETFs is not only a retiree story. The covered-call ETF category — which produces monthly income by selling options against equity positions — has grown dramatically among all income investors as a way to generate yield in a market environment where bond yields, while improved from zero-rate era lows, remain insufficient for many income needs. JEPI now holds over $45 billion in assets. JEPQ has accumulated $39 billion. The category has moved from a niche product for sophisticated options traders to a mainstream income vehicle for retail investors who want monthly cash flow from equity-based strategies.
JEPI AUM: $45.34B (ETF Central April 2026). JEPQ AUM: $39B (DividendVision July 2026). QYLD AUM: $8.2B. Only 2 large-cap individual stocks pay monthly dividends — monthly income is primarily an ETF phenomenon (ChartRow 2026). Average yield across 15 major monthly income ETFs: 14.47% (DividendVision July 2026).
How Covered-Call ETFs Generate Monthly Income
The dominant structure in monthly dividend ETFs is the covered-call strategy, and understanding how it generates income is essential before investing in any ETF in this category. A covered call is an options transaction in which the holder of an asset sells someone else the right to buy that asset at a specified price (the strike price) before a specified date. In exchange for granting that right, the seller receives a premium — cash paid immediately, regardless of what happens to the stock. ETFs that sell covered calls collect these premiums and distribute them to shareholders as monthly income.There are two main structural variants in this list. The first is fully covered calls (QYLD, XYLD, RYLD): the ETF writes call options against 100% of its index exposure every month, systematically capturing option premium but also capping 100% of the upside above the strike price. The second is partial-coverage or equity-linked note (ELN) structures (JEPI, JEPQ): these ETFs write call options against a portion of the portfolio, preserving some equity upside while still generating substantial monthly income from premiums. The difference matters: fully covered strategies produce higher and more predictable income but sacrifice the most growth. Partial-coverage strategies produce somewhat lower income but allow more equity appreciation. Tickflow.io’s guide summarises the dynamic: ‘The high yields come with trade-offs including capped upside participation and varying tax treatment.
The 7 Best Monthly Dividend ETFs at a Glance
JEPI: JPMorgan Equity Premium Income ETF
JEPI is the 800-pound gorilla of monthly income ETFs — $45 billion in assets under management and still pulling in billions more in fresh inflows each year. JPMorgan launched it in 2020 with a simple but powerful premise: deliver equity-like income from S&P 500 exposure, but smoother, by selling equity-linked notes (ELNs) that generate option premium distributed monthly. The result is a yield of approximately 7.92% as of September 2026 (ChartRow), paid in monthly distributions that have ranged from $0.34 to $0.54 per share in recent months. What makes JEPI stand out in the monthly dividend ETF category is the combination of factors that usually do not come together: a 0.35% expense ratio that undercuts most rivals, $45 billion in AUM that ensures deep liquidity, and a volatility profile of 8.17-8.65% that is lower than both JEPQ and RYLD. YTD flows of over $3.5 billion in 2026 suggest that institutional and retail investors alike continue to vote with their capital. The 2025 full-year total return was 8.10%, and the 2026 YTD return has tracked between 1.51% and 2.99% at various measurement points. The primary trade-off is that the ELN strategy caps equity upside — when the S&P 500 runs hard, JEPI participates less than a pure index fund. This is the explicit design: stable income over maximum growth.Ticker: JEPI | Issuer: JPMorgan | Yield: ~7.92% (Sep 2026) | AUM: $45B+ | Expense ratio: 0.35% | Frequency: monthly | 2025 total return: +8.10% | YTD 2026: ~+2% | Inception: 2020. Sources: ChartRow Sep 30, 2026; ETF Central April 2026.
The ELN strategy caps S&P 500 upside. When equities rally strongly, JEPI underperforms a pure S&P 500 index fund. JEPI is an income tool, not a growth tool. Its monthly distributions also vary — $0.34 in February 2026 to $0.45 in May 2026 — so income is not perfectly predictable.
Income-focused investors who want moderate yield (~8%), large-fund stability, low expense ratio, and smoother volatility than higher-yield alternatives. Retirees and near-retirees who want monthly income from S&P 500 exposure without full market risk.
JEPQ: JPMorgan Nasdaq Equity Premium Income ETF
JEPQ is JEPI’s growth-oriented younger sibling — same JPMorgan architecture, same 0.35% expense ratio, but built on the Nasdaq-100 instead of the S&P 500. The Nasdaq-100’s higher volatility produces richer option premiums, which translates into a substantially higher yield: approximately 12.62% as of July 2026 (DividendVision), versus JEPI’s ~7.92%. The growth tilt also means JEPQ has delivered stronger total returns in bullish markets — the 2025 full-year total return was 15.19% and the 1-year return through June 2026 was 22.11% (TotalRealReturns), significantly outpacing JEPI’s 7.89% 1-year return in the same window. With $39 billion in AUM, JEPQ is deep and liquid. The expense ratio of 0.35% is identical to JEPI. DividendVision’s July 2026 analysis positioned JEPQ as the top JEPI alternative for holders wanting ‘a higher yield, a Nasdaq tilt, or better tax treatment.’ The trade-off is higher volatility than JEPI, and higher concentration in technology and growth names. When Nasdaq-100 sells off, JEPQ tends to fall harder than JEPI.Ticker: JEPQ | Issuer: JPMorgan | Yield: ~12.62% (Jul 2026) | AUM: $39B | Expense ratio: 0.35% | Frequency: monthly | 2025 total return: +15.19% | 1-year return (to Jun 2026): +22.11% | Inception: 2022. Sources: DividendVision July 2026; TotalRealReturns June 2026.
Higher yield comes with higher Nasdaq-100 concentration and greater sensitivity to tech-sector drawdowns. More volatile than JEPI. When the Nasdaq falls, JEPQ falls harder. The ELN strategy caps upside on the Nasdaq-100, meaning it underperforms during strong rallies.
Investors who want JEPI-style monthly income but with a Nasdaq growth tilt and higher yield (~12%). Suitable for those comfortable with tech-sector concentration and higher volatility in exchange for the additional income and growth potential.
QYLD: Global X Nasdaq 100 Covered Call ETF
QYLD is the original monthly dividend ETF — launched in 2013, it has paid a distribution every single month for over nine years, giving it the longest track record of consistent monthly income in the covered-call ETF category. Where JEPQ uses equity-linked notes (partial coverage), QYLD writes fully covered calls on the Nasdaq-100, meaning it systematically sells away 100% of the upside above the strike price each month. The result is the highest and most stable monthly income in the mainstream covered-call ETF universe, but also the most capped upside of any strategy in this list. DividendVision’s July 2026 data puts QYLD’s yield at 12.05%, with $8.2 billion in AUM. The expense ratio at 0.61% is higher than JEPI and JEPQ’s 0.35%, which is a meaningful drag over time on a total-return basis. QYLD’s YTD 2026 performance of +7.36% (TotalRealReturns to June) and 2025 return of +9.31% reflect the systematic income collection but limited price appreciation. The 1-year total return through June 2026 was +20.85% (TotalRealReturns). For income-primary investors who want the discipline of a rule-based monthly payer with a decade-plus of track record, QYLD’s consistency is its main selling point.Ticker: QYLD | Issuer: Global X | Yield: ~12.05% (Jul 2026) | AUM: $8.2B | Expense ratio: 0.61% | Frequency: monthly | 9+ consecutive years of monthly payments | 2025 total return: +9.31% | 1-year return (to Jun 2026): +20.85%. Sources: DividendVision July 2026; TotalRealReturns June 2026; Nasdaq.com.
Fully covered calls = most capped upside of any strategy in this list. The expense ratio of 0.61% is significantly higher than JEPI/JEPQ. On a long-term total return basis, the combination of capped upside and higher fees tends to underperform partial-coverage strategies. Some distributions may include return of capital (ROC).
Income-primary investors who want a rule-based, consistent monthly payer with a 9+ year track record and the highest yield in the mainstream covered-call category. Those who do not need price appreciation and want the discipline of a fully systematic income strategy.
RYLD: Global X Russell 2000 Covered Call ETF
RYLD is Global X’s small-cap equivalent of QYLD: it writes covered calls on the Russell 2000 index rather than the Nasdaq-100, giving investors exposure to small-cap equity income with a yield of approximately 12.09% as of July 2026 (DividendVision). The Russell 2000’s higher volatility relative to large-cap indices produces rich option premiums, which supports the high yield. RYLD’s 2026 YTD performance of +8.55% through June (ETF Central) has been its strongest in several years. The expense ratio at 0.60% is consistent with QYLD. At $1.4 billion in AUM, RYLD is significantly smaller than JEPI, JEPQ, or QYLD — not a liquidity concern for most retail investors, but relevant context for larger institutional positions. The ETF Central comparison of RYLD versus JEPI highlights the core difference: RYLD has higher volatility (10.87% versus JEPI’s 8.17%) and smaller AUM ($1.35B versus $44.13B), but pays a similar level of yield to QYLD while offering small-cap diversification. For investors who want to diversify their covered-call income across multiple index exposures — large-cap, Nasdaq, and small-cap — RYLD provides the small-cap leg of that combination.Ticker: RYLD | Issuer: Global X | Yield: ~12.09% (Jul 2026) | AUM: $1.4B | Expense ratio: 0.60% | Frequency: monthly | 2026 YTD: +8.55% (to Jun 2026) | Volatility: 10.87% past year. Sources: DividendVision July 2026; ETF Central June 2026.
Higher volatility (10.87%) than JEPI or QYLD. Smaller AUM limits liquidity for large positions. Small-cap exposure adds factor risk beyond the option-writing strategy. Russell 2000 tends to underperform in risk-off environments more than large-cap indices.
Investors already holding JEPI or JEPQ who want to diversify their covered-call income across index exposures, or those specifically seeking small-cap income with a rule-based monthly structure. Not for sole-holding income investors who prioritise stability.
DIVO: Amplify CWP Enhanced Dividend Income ETF
DIVO is the quality-first income ETF in this list — and the one most likely to appeal to investors who want monthly income without fully surrendering equity upside. Unlike JEPI, JEPQ, QYLD, and RYLD, which are primarily income-extraction strategies built around option selling, DIVO starts with a portfolio of quality dividend-paying companies and then selectively writes covered calls on some of those holdings — only when the strategy team judges the timing to be favourable. This ‘selective’ call-writing approach means DIVO’s yield (approximately 4.73% as of July 2026, DividendVision; 5.04% at ChartRow 2026) is lower than the systematic covered-call ETFs, but its total return profile is different: it participates more in equity upside because it does not cap every position every month. DividendVision’s July 2026 analysis positioned DIVO as the ETF for investors who want ‘a lower yield but more upside’ than JEPI alternatives. With $7.2 billion in AUM, DIVO is large, well-established, and liquid. The expense ratio of 0.56% is higher than JEPI/JEPQ but reflective of the active management involved.Ticker: DIVO | Issuer: Amplify ETFs (CWP) | Yield: ~4.73% (Jul 2026) | AUM: $7.2B | Expense ratio: 0.56% | Frequency: monthly | Strategy: quality dividend stocks + selective call-writing. Sources: DividendVision July 2026; ChartRow 2026.
Lower yield (~4-5%) than the other ETFs in this list. Higher expense ratio than JEPI/JEPQ. The active management component means outcomes depend on call-writing timing decisions, which adds a layer of manager-discretion risk.
Total-return-conscious income investors who want monthly income but are not willing to accept fully capped equity upside. A good middle ground between a growth index fund and a high-yield covered-call ETF. Those who prioritise income quality and equity upside participation over maximising yield.
XYLD: Global X S&P 500 Covered Call ETF
XYLD is the S&P 500 equivalent of QYLD — writing fully covered calls on the S&P 500 index rather than the Nasdaq-100. This makes it, in theory, a more conservative version of the covered-call income strategy: the S&P 500 is broader and less volatile than the Nasdaq-100, which means slightly lower option premiums and slightly lower yield than QYLD, but with exposure to a more diversified 500-company index. TotalRealReturns’ data through June 2026 shows XYLD with a YTD return of +4.52% and a 1-year total return of +15.19% — similar to QYLD in the same period. The 2025 full-year return was +8.04%. The expense ratio at 0.60% is the same as QYLD and higher than JEPI. XYLD fills a specific niche: income investors who want S&P 500-based covered-call income with a longer track record than JEPI and without the Nasdaq concentration of QYLD. For investors building a diversified covered-call income portfolio across multiple indices, XYLD provides the S&P 500 leg alongside JEPQ/QYLD (Nasdaq) and RYLD (Russell 2000).Ticker: XYLD | Issuer: Global X | Yield: ~8-10% (indicative) | Expense ratio: 0.60% | Frequency: monthly | 2025 total return: +8.04% | 2026 YTD: +4.52% (to Jun 2026) | 1-year return: +15.19% (to Jun 2026). Sources: TotalRealReturns June 2026.
Expense ratio 0.60% — higher than JEPI. Fully capped S&P 500 upside. Lower yield than QYLD (less volatile index = lower option premiums).
Investors wanting systematic S&P 500 covered-call income with a longer track record than JEPI and no Nasdaq concentration. Portfolio builders adding S&P 500 monthly income to complement Nasdaq-focused ETFs.
SVOL: Simplify Volatility Premium ETF
SVOL is the highest-yield and highest-risk fund on this list. At approximately 20.73% yield (DividendVision July 2026), SVOL pays more than double the income of JEPI, but through a fundamentally different and significantly higher-risk strategy: it harvests the volatility risk premium by taking short positions on VIX futures. When equity markets are calm and volatility is low or declining, SVOL benefits from the natural time decay of volatility and pays out the premium. When markets spike and volatility surges, SVOL can lose value significantly and rapidly. The expense ratio of 1.16% is the highest in this list. At $550 million in AUM, SVOL is considerably smaller than JEPI or JEPQ, reflecting its niche risk profile. SVOL is not a core income holding for most investors — it is a specialist strategy for investors who understand volatility markets and are explicitly comfortable with the risk of significant drawdowns during market stress. Tickflow.io’s June 2026 guide explicitly notes that high-yield ETF distributions ‘come with trade-offs including capped upside participation and varying tax treatment,’ and SVOL’s risk profile goes beyond those typical trade-offs.Ticker: SVOL | Issuer: Simplify ETFs | Yield: ~20.73% (Jul 2026) | AUM: $550M | Expense ratio: 1.16% (highest in list) | Frequency: monthly | Strategy: short VIX/volatility premium. Sources: DividendVision July 2026.
Highest risk in this list. Short volatility strategy can suffer severe drawdowns during market stress events. Expense ratio of 1.16% significantly higher than all other ETFs listed. Not suitable as a core holding. Suitable only for sophisticated investors who fully understand VIX mechanics and short volatility risk.
Specialist investors who understand volatility markets and want exposure to the volatility risk premium as a yield source. Should be used as a small satellite position only — not as a core income holding.
Monthly Dividend ETF Comparison Table
Building a Monthly Income Portfolio With ETFs
No single monthly dividend ETF is the right answer for every income investor, and the most common approach among experienced income portfolio builders is to combine two or three ETFs that complement each other across index exposure, yield level, and volatility tolerance. A simple framework built from this list: a core holding in JEPI for stable S&P 500-based monthly income at lower volatility; a growth-tilted position in JEPQ for higher yield and Nasdaq exposure; and a quality-stock position in DIVO for upside participation that the systematic covered-call ETFs cannot provide. This three-ETF combination covers large-cap US equity income (JEPI), Nasdaq-tilted income (JEPQ), and quality-growth income (DIVO) without excessive overlap and without concentrating entirely in one strategy.For investors comfortable with higher yield and more systematic income, QYLD alongside JEPI provides both S&P 500 and Nasdaq covered-call income at the cost of more fully capped upside. RYLD adds small-cap income diversification for those building a multi-index covered-call portfolio. The key point is that these ETFs are income tools, not growth tools. Their role in a portfolio is to generate monthly cash flow with moderate equity exposure — not to outperform the S&P 500 index on a total return basis. Investors who hold JEPI expecting index-fund-level price appreciation alongside a 7.9% yield will be disappointed. Investors who hold it for the 7.9% monthly income and accept the partial equity upside it provides will typically be satisfied. Not investment or financial advice. Individual circumstances vary. Consult a qualified financial adviser.
Before investing in any ETF on this list: check whether the yield includes return of capital (ROC) — some covered-call ETF distributions include portions of your own capital returned to you, which does not represent earned income. Check your broker's '1099-DIV' classification (US) or the ETF's annual report for distribution breakdown. Return of capital reduces your cost basis rather than generating income.
Conclusion
Monthly dividend ETFs have earned their place in income portfolios. JEPI’s $45 billion in assets and $3.5+ billion in 2026 inflows reflect the genuine value investors find in monthly S&P 500 income at 7.9% yield and a 0.35% expense ratio. JEPQ’s 22.11% 1-year total return through June 2026 reflects the performance potential in a Nasdaq-tilted covered-call strategy. QYLD’s nine consecutive years of monthly payments reflects the consistency that a fully systematic covered-call strategy can deliver. But yield is the start of the analysis, not the end. A 20.73% yield from SVOL and a 7.92% yield from JEPI require different risk frameworks, different portfolio weightings, and different expectations.The questions worth answering before investing in any of these ETFs: What is the strategy actually doing to produce that yield? What upside is being sacrificed? How does the yield and total return compare to alternatives? What is the tax treatment of the distributions? And how does this ETF fit in the context of the full portfolio? The seven ETFs in this guide each answer those questions differently. Not investment or financial advice. Past performance does not predict future results. Consult a qualified, regulated financial adviser for guidance specific to your circumstances.
Frequently Asked Questions
What is the highest-yielding monthly dividend ETF in 2026?Among the major monthly dividend ETFs tracked in 2026, SVOL (Simplify Volatility Premium ETF) has the highest yield at approximately 20.73% (DividendVision, July 2026), followed by RYLD at ~12.09%, JEPQ at ~12.62%, and QYLD at ~12.05%. However, SVOL's yield comes from a short-volatility strategy that carries significantly higher risk than covered-call equity ETFs — it can suffer severe drawdowns during market volatility spikes. Among the more widely held equity-based monthly ETFs, JEPQ offers the highest yield at approximately 12.62% with $39 billion in AUM. JEPI offers a lower yield of ~7.92% but with larger AUM ($45B+), lower volatility, and a lower expense ratio. Sources: DividendVision July 2026; ChartRow 2026. Past performance does not predict future returns.
Is JEPI or JEPQ better for monthly income?
The choice depends on your priorities. JEPI offers approximately 7.92% yield on S&P 500 exposure with lower volatility (8.17-8.65%), larger AUM ($45B+), and the same 0.35% expense ratio — making it the more conservative core income holding. JEPQ offers approximately 12.62% yield on Nasdaq-100 exposure with more growth potential, but higher volatility and more technology concentration. DividendVision's July 2026 analysis positions JEPQ as the top JEPI alternative for investors wanting 'a higher yield, a Nasdaq tilt, or better tax treatment.' JEPQ's 2025 total return of +15.19% and 1-year return of +22.11% to June 2026 (TotalRealReturns) significantly exceeded JEPI's +8.10% and +7.89% in the same periods. If you want stable, lower-volatility monthly income: JEPI. If you want higher yield with Nasdaq growth exposure: JEPQ. Many investors hold both. Sources: DividendVision July 2026; ETF Central; TotalRealReturns June 2026.
What is the difference between QYLD and JEPQ?
Both write covered calls on the Nasdaq-100, but the structure is fundamentally different. QYLD writes fully covered calls — selling away 100% of the index upside above the strike every month. This maximises income but completely caps participation in Nasdaq rallies. JEPQ uses equity-linked notes (ELNs) to write partial coverage, preserving some upside while still generating substantial income. The result: QYLD yielded ~12.05% in July 2026 vs JEPQ's ~12.62% — similar yield, but very different total return profiles. JEPQ's 2025 return of +15.19% vs QYLD's +9.31% reflects the difference between partial and full coverage. QYLD has a significantly longer track record (2013 vs 2022) and 9+ consecutive years of monthly payments. JEPQ is newer but has outperformed QYLD in recent periods. Sources: DividendVision July 2026; TotalRealReturns June 2026; Nasdaq.com.
Are monthly dividend ETF distributions taxed as ordinary income?
Tax treatment varies by ETF structure and distribution type. For covered-call ETFs: the option premium income is generally classified as short-term capital gains or ordinary income (less favourable tax treatment than qualified dividends). Some distributions may include return of capital (ROC), which is not taxed when received but reduces your cost basis — affecting capital gains tax when you sell. Bond-focused ETFs distributing interest income are generally ordinary income. Tickflow.io's June 2026 guide notes that 'the high yields come with trade-offs including capped upside participation and varying tax treatment.' For US investors, 1099-DIV forms will classify distributions. Holding these ETFs in tax-advantaged accounts (IRA, 401k, ISA in the UK) eliminates the annual tax drag on distributions. Tax treatment is complex and individual-specific. This is not tax advice — consult a qualified tax professional. Sources: Tickflow.io June 2026; Freenance.io 2026.
Should I hold monthly dividend ETFs in a retirement account?
For most investors, holding covered-call and high-yield ETFs in a tax-advantaged account (Roth IRA, traditional IRA, 401k in the US; ISA or SIPP in the UK) is more tax-efficient than holding them in a taxable brokerage account. In a taxable account, the monthly distributions create annual tax events — and the option premium income from covered-call ETFs is typically taxed as ordinary income rather than at the lower qualified dividend rate. In a tax-advantaged account, the monthly distributions can compound without annual tax drag. The trade-off with a Roth IRA is that you give up the immediate tax deduction on contributions, but qualified distributions in retirement are tax-free. For retirees already drawing on the income, the choice between Roth and traditional depends on current vs expected future tax rates. This is not tax or financial advice — consult a qualified financial adviser. Sources: general tax principles; Freenance.io 2026 on tax treatment.
0 Comments
Be the first to share your thoughts on this article.