

Financial Literacy
Buying a House vs Investing: Which Builds More Wealth?
The British love of property as the ultimate wealth-building vehicle is deeply embedded — but the data is increasingly difficult to ignore. Over the five years to December 2025, global equities returned 13% per year including dividends, while UK house prices rose just 3.3% per year — below inflation. Rathbones’ landmark 2025 report concluded that ‘the golden age of UK property investment is over.’ So should your deposit go into bricks and mortar, or into the stock market? The honest answer is: it depends on what you’re buying and why.
The conditions that made that golden age possible were specific and largely unrepeatable. Interest rates fell from a generational high of around 15% in the early 1980s to near-zero by 2009. Cheap borrowing made mortgages dramatically more affordable, allowing buyers to take on larger loans, which drove prices higher. Meanwhile, housebuilding failed to keep pace with population growth and household formation, constraining supply. And the Right to Buy policy, introduced in 1980, converted millions of social renters into property owners at below-market prices.
Those tailwinds are gone. Interest rates will not fall from 15% to 0% again. Housebuilding is increasing after decades of undersupply. The buy-to-let tax environment has been significantly tightened since 2017. And as the data from 2016 onwards shows, the era when you could reliably outperform diversified equity investment by buying UK residential property has come to a close. Understanding this shift is the starting point for any honest 2026 analysis of the property-versus-investing debate.
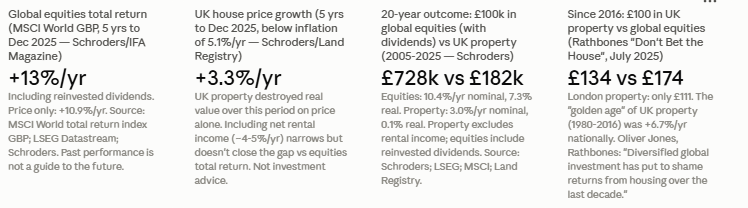
Golden age of UK property (Rathbones): 1980-2016, house prices +6.7%/yr nationally; +8.5%/yr London. 5 years to December 2025: UK house prices +3.3%/yr (below inflation at 5.1%/yr); global equities +10.9%/yr; +13%/yr total return with dividends (Schroders; MSCI World GBP; LSEG Datastream). 20 years (2005-2025): £100k in UK property → £182k; £100k in global equities (with dividends) → £728k (Schroders). Not investment advice. Past performance not a guide to the future.
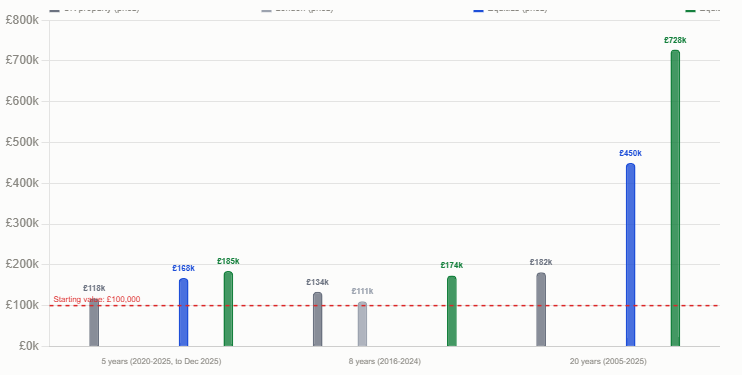
Over the same period, £100,000 invested in global equities including reinvested dividends — tracking the MSCI World total return index in GBP terms — grew to £728,000. That is 10.4% per year nominal, 7.3% per year in real terms. Even excluding dividends and taking only price return, global equities produced £450,000 from an initial £100,000, at 7.8% per year nominal.
The property figure does not include rental income, which is a significant omission. Gross rental yields have averaged approximately 6% per year over the past 20 years (with wide regional variation), though net yields after costs and voids are typically 4–5%. Adding this to the property total return significantly narrows the gap, though the equity comparison including dividends still outperforms. But property’s 3.0% price appreciation plus 4–5% net rental income versus equities’ 10.4% total return means equities still win on this 20-year comparison, even with rental income included in the property figure.
For the five years to the end of 2025, the gap is even wider. Schroders reports that UK house price growth of 3.3% per year fell well short of inflation at 5.1% per year — meaning UK property destroyed real value over this period on price alone. Global equity prices rose 10.9% per year in sterling terms, 13% per year in total returns. Duncan Lamont, Head of Strategic Research at Schroders, stated the comparison directly: in terms of wealth building, the pension (and by extension, the stocks and shares ISA) has significantly outperformed property in the most recent five years.
Duncan Lamont, Head of Strategic Research at Schroders (IFA Magazine): 'In the five years to the end of 2025, UK house-price growth was 3.3% a year, well short of inflation which came in at 5.1% a year. In contrast, global equity prices were up 10.9% a year in sterling terms, 13% a year in total returns if dividends are included.' Source: IFA Magazine (Schroders data, MSCI World total return GBP, LSEG Datastream, Land Registry; data to 31 December 2025). Past performance is not a guide to the future.
In inflation-adjusted terms, the contrast is even more unflattering for property. London house prices rose just 1.3% per year since 2016, which is 2.2 percentage points below inflation. UK average house prices outside London only just kept pace with inflation. Meanwhile, the global equity mix rose 3.4 percentage points per year above inflation.
To put this in the context of 40-year historical data: between 1964 and the start of 2023, UK house prices rose by an average of 7.7% per year, while the FTSE All-Share rose by 6.3% on average (Rathbones, Q4 2023). In the very long run, property and equities were more comparable — particularly London property, which matched the S&P 500 in GBP terms at approximately 8.5% per year. But the more recent decade has seen a decisive shift, driven by the end of the rate cycle that underpinned property’s golden age and the explosive growth of US technology stocks that dominate global equity indices.
Oliver Jones, Head of Asset Allocation at Rathbones (July 2025; Property Industry Eye): 'The idea that you can’t go wrong with bricks and mortar just isn’t true. The data shows that diversified global investment has put to shame returns from housing over the last decade – and we believe this trend will continue. The earlier boom in house prices was fuelled by factors which no longer hold.' Source: Rathbones ‘Don’t Bet the House’ report (July 2025). Past performance is not a guide to the future.
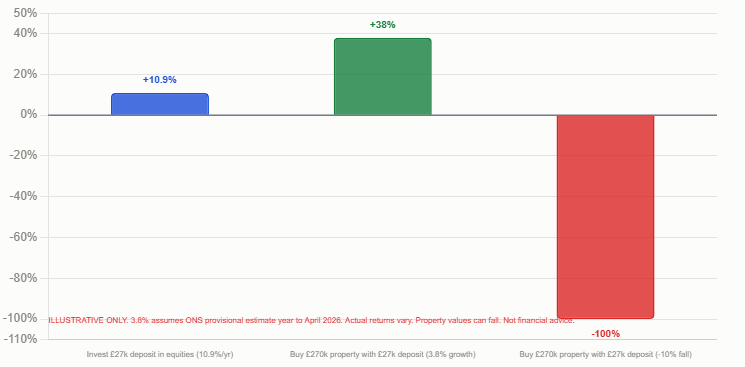
This is the comparison that most property investors actually experience. A buyer who puts down a £27,000 deposit on a £270,000 property that appreciates 3.8% (ONS provisional estimate, year to April 2026) sees the property value rise by approximately £10,260 in one year. That is a 38% return on the £27,000 invested — not a 3.8% return. No mainstream investment vehicle provides this kind of leverage to retail investors at low interest rates on £270,000 of capital.
But leverage is a double-edged sword that property enthusiasts rarely acknowledge with the same enthusiasm. If the same property falls 10% in value, the £27,000 deposit is almost entirely wiped out — a 100% loss on the invested capital. And unlike equities (where you can hold through a drawdown at zero carrying cost), the mortgage must be serviced every month regardless of what the property is worth. As Schroders notes, leverage ‘magnifies downside risks if house prices fall.’
The leverage argument also does not translate directly to investing. Most investors do not use leverage in their equity portfolios and are not comparing a 10%-deposit leveraged property position against an unlevered stock portfolio. The fair comparison is: should I put my £27,000 deposit into the stock market, or should I use it as a deposit to buy a £270,000 house? That framing — which we explore below — changes the calculus significantly.
Property’s leverage advantage (illustrative): £27,000 deposit on £270,000 house at 3.8% annual price growth = ~£10,260 in value gain in year 1 = ~38% return on capital deployed. The same £27,000 invested in a global equity fund at 10.9% return = ~£2,943 gain in year 1 = ~10.9% return. Leverage makes property’s return on cash invested significantly higher in a rising market. BUT: leverage also magnifies losses. Property values can and do fall. Mortgage must be serviced regardless. Not financial or investment advice.
Buying a home to live in provides a package of benefits that go far beyond financial return: security of tenure, the ability to modify and personalise the space, stability for children and families, freedom from landlord decisions, community roots, and a forced saving mechanism that many people find psychologically valuable. For most people, a home is not purely an investment — it is a place to live. The financial return is a secondary benefit, and comparing it against equity investments misses the point that renting the equivalent property and investing the difference is not a realistic alternative for most households.
The comparison between property and investing becomes most relevant in three specific situations: when considering a buy-to-let property as a financial investment; when deciding whether to overpay a mortgage versus investing surplus income; and when deciding where to put a lump sum (deposit) that could either purchase a property or be invested in equities. In each of these cases, the financial comparison is meaningful and the data increasingly favours equities over additional property purchases, particularly for those who are already homeowners.
For first-time buyers asking whether to buy or invest, the question almost always resolves to: what is the alternative to buying? If the alternative is renting and investing the deposit in the stock market, the calculation must include the rising cost of renting (UK rents up 3.4–3.5% per year; average monthly rent now £1,377), the forced saving effect of mortgage repayments, and the non-financial benefits of ownership. On these terms, buying a home to live in still makes sense for most people who can afford it — even if the pure investment returns are now more competitive from equities.
A 75% LTV mortgaged buy-to-let purchase of an average UK property generates returns of roughly 0–3% on the cash invested with flat house prices, rising to 11–14% if annual house price growth runs at 3.5%. The case for buy-to-let investment rests entirely on capital growth — and the August App is explicit: ‘the growth row you believe in is a market view, not a guarantee.’ UK prices rose 3.8% in the year to April 2026 on ONS provisional estimates, but recent years have included near-flat periods, and future growth is uncertain.
For higher-rate taxpayers, the picture is worse. Section 24 of the Finance Act, implemented from 2017, restricts the deduction of mortgage interest costs to a 20% tax credit rather than full deduction. A higher-rate taxpayer who previously deducted mortgage interest at 40% now receives relief at only 20%, effectively increasing the tax on rental income and reducing net yields substantially. Many higher-rate taxpayers who bought buy-to-let properties when the tax rules were more favourable have found their net returns sharply reduced by this change.
Additionally, the SDLT surcharge of 5 percentage points on second home and buy-to-let purchases (introduced April 2016) significantly increases the upfront cost of acquisition and the time required to break even. On a £270,000 buy-to-let purchase, the SDLT at current rates for a second property adds approximately £11,000 in upfront tax that must be recovered before any real return is achieved.
For higher-rate taxpayer buy-to-let investors: Section 24 (Finance Act 2017) restricts mortgage interest relief to a 20% tax credit. On a £200,000 mortgage at 5% interest (£10,000 per year interest): a higher-rate taxpayer receives £2,000 tax credit (20%) rather than the previous £4,000 (40%) deduction. The extra £2,000 in effective tax reduces net yield by approximately 0.7 percentage points on a £270,000 property. Combined with the SDLT surcharge and CGT on disposal, the after-tax return on mortgaged BTL for higher-rate taxpayers is significantly lower than gross yield figures suggest. Not financial or tax advice. Consult a qualified tax adviser.
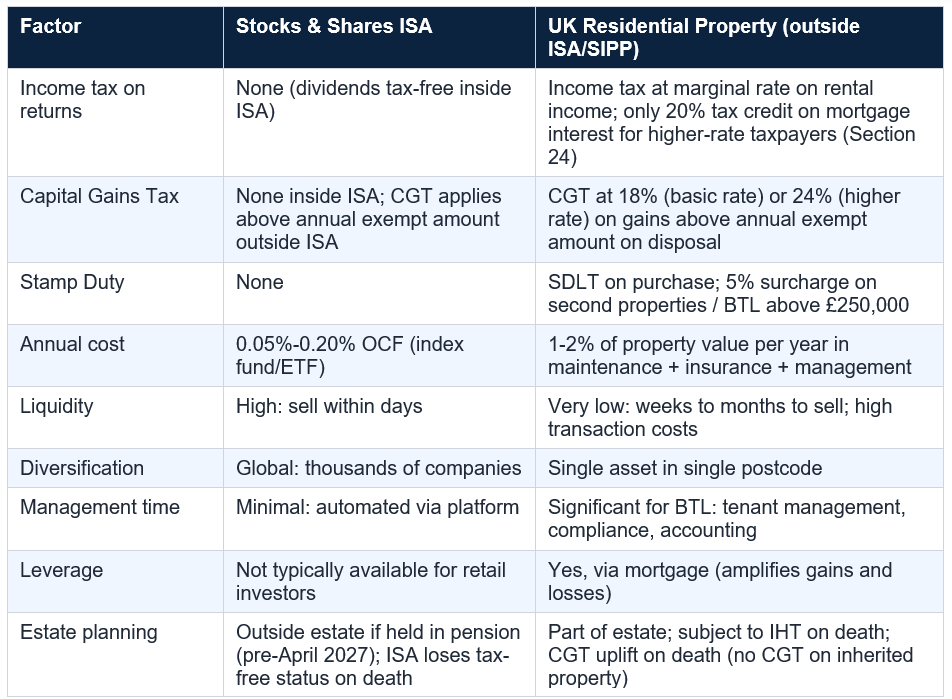
Note: tax rules change frequently. This table reflects rules as understood at time of writing (September 2026). Always consult a qualified tax adviser. Not financial or tax advice.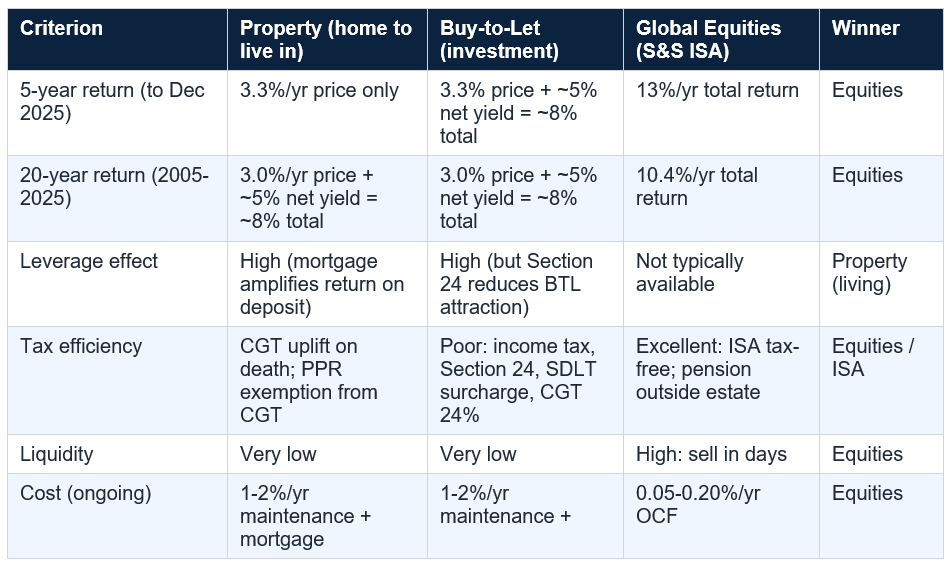
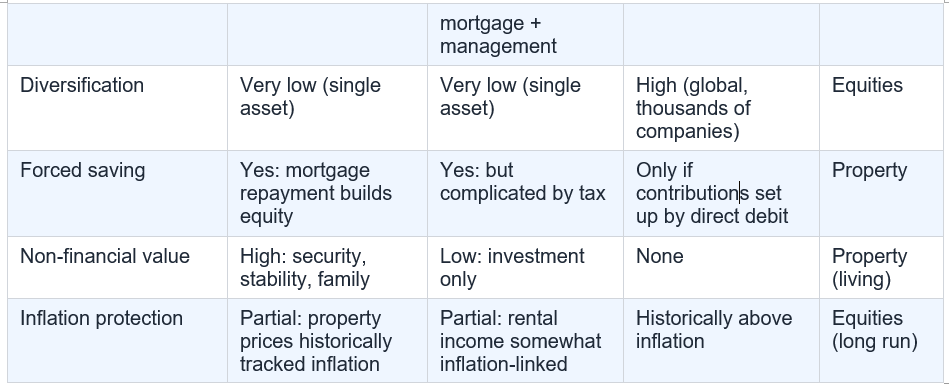
If you are buying additional property as an investment vehicle — particularly a mortgaged buy-to-let as a higher-rate taxpayer — the financial case has weakened significantly. The golden age of UK property investment ended around 2016 according to Rathbones’ research. The last five years of data show UK house prices growing at 3.3% per year (below inflation) while global equities returned 13% per year. The tax environment for buy-to-let has deteriorated materially since 2017. The SDLT surcharge on second properties is substantial. Management costs and obligations are real and growing with regulation.
The most financially optimal strategy for most UK households in 2026 is: buy a home to live in when you can, in the most affordable market accessible to you, using the lowest-cost mortgage available; and invest surplus capital in a Stocks and Shares ISA tracking a low-cost global equity index fund rather than buying additional investment property. Not financial or investment advice — always consult a qualified independent financial adviser for guidance specific to your circumstances.
It depends on the period and how you measure it. Over the very long run (1964-2023), UK house prices rose at an average of 7.7% per year, ahead of the FTSE All-Share at 6.3% per year (Rathbones, Q4 2023). London property historically matched the S&P 500 in sterling terms at approximately 8.5% per year over the same period. However, these figures do not include dividends for equities or rental income for property. When total returns are compared (including dividends and income), global equities have outperformed property over the 20-year period to 2025: Schroders data shows £100,000 in global equities (with dividends reinvested) growing to £728,000 vs £182,000 in UK property. In the five years to end 2025, the gap is even wider: global equities returned 13% per year total return vs UK house price growth of 3.3% (below inflation). Rathbones concluded in July 2025 that the 'golden age of UK property investment' ended around 2016. Not investment advice. Past performance is not a guide to the future.
Should I put my deposit into a Stocks and Shares ISA instead of buying a house?
This depends on your situation. If you need somewhere to live, the alternative to buying is renting — and average UK rents are £1,377 per month and rising 3.4-3.5% per year. If you invest your deposit instead of buying and continue renting, your deposit earns investment returns but you continue paying rent that builds no equity. For most people who can afford to buy in their target area, buying still makes sense as a primary residence decision, even if the pure investment return on property has been weaker than equities recently. However, if you already own a home and are considering buy-to-let as an additional investment, the data and tax environment increasingly favour a Stocks and Shares ISA as the more efficient vehicle. Not financial or investment advice.
What has the stock market returned vs UK house prices over 20 years?
Schroders analysis (data to December 2025, LSEG Datastream, Land Registry, MSCI, ONS): over 20 years from 2005 to 2025, £100,000 in average UK property grew to £182,000 (3.0% per year nominal, 0.1% real). Over the same period, £100,000 in global equities including reinvested dividends grew to £728,000 (10.4% per year nominal, 7.3% real). Without dividends, equities grew to £450,000 (7.8% per year). Note: property figure excludes rental income; equity figure includes dividends. Adding net rental income of 4-5% per year to property would narrow but not close the gap. Source: IFA Magazine (Schroders data). Past performance is not a guide to the future. Not investment advice.
Is buy-to-let still worth it in 2026?
Buy-to-let is worth it in 2026 where three things align: a genuine gross rental yield (above 5-6%), moderate borrowing (LTV below 75%), and a time horizon long enough for capital growth to do its work (August App, August 2026). At 75% LTV on average UK figures, buy-to-let returns roughly 0-3% on cash with flat house prices and 11-14% if growth runs at 3.5%. The case rests heavily on capital growth, which is not guaranteed. For higher-rate taxpayers, Section 24 (Finance Act 2017) restricts mortgage interest relief to a 20% tax credit, significantly reducing net returns vs the pre-2017 regime. The SDLT surcharge on second properties (5 percentage points) increases upfront acquisition cost. UK prices rose 3.8% in the year to April 2026 (ONS), but recent years included near-flat periods. Not financial or investment advice.
What is the most tax-efficient way to invest in the UK in 2026?
The Stocks and Shares ISA provides income tax-free dividends, capital gains tax-free growth, and no reporting requirements within the annual £20,000 contribution limit (£40,000 for a couple). No other mainstream investment vehicle in the UK eliminates both income and capital gains tax simultaneously. For long-term wealth building above the ISA limit, a pension (SIPP) provides income tax relief on contributions at the marginal rate (40% or 45% for higher earners), tax-free growth, and (until April 2027) advantageous inheritance tax treatment on unused funds. Property held directly outside an ISA or pension attracts income tax on rental income (restricted to 20% tax credit for mortgage interest for higher-rate taxpayers under Section 24), capital gains tax at 18-24% on gains, and SDLT on acquisition. Not financial or tax advice. Consult a qualified adviser.
Table of Contents
- The British Property Myth: Where It Came From
- What the 20-Year Data Actually Shows
- The Last Decade: A Story of Two Assets
- The Leverage Argument: Property’s Hidden Superpower
- The Hidden Costs of Property That The Data Misses
- The Hidden Advantages of Stocks That People Overlook
- Buying a Home to Live In vs Buying to Invest: Two Different Questions
- Buy-to-Let in 2026: The Numbers Are Harder Than They Look
- The Tax Comparison: Stocks and Shares ISA vs Property
- What the Experts Say in 2026
- The Head-to-Head Scorecard
- So When Does Buying a House Win?
- So When Does Investing Win?
- Conclusion: The Honest Answer
- Frequently Asked Questions
£100k returns comparison: 5yr, 10yr, 20yr
The leverage effect — deposit deployed
Head-to-head scorecard
The British Property Myth: Where It Came From
The idea that property is the safest and most reliable way to build wealth in Britain is not baseless — it is based on a real historical period during which it was overwhelmingly true. Rathbones, the UK wealth manager, calls it ‘the golden age of UK property ownership’: from 1980 to 2016, UK house prices rose at an average of 6.7% per year nationally and 8.5% per year in London. Those numbers held for 36 years. A generation of homeowners bought properties, watched them rise in value, remortgaged to buy more, and accumulated substantial wealth through what felt like a natural law of the British economy.The conditions that made that golden age possible were specific and largely unrepeatable. Interest rates fell from a generational high of around 15% in the early 1980s to near-zero by 2009. Cheap borrowing made mortgages dramatically more affordable, allowing buyers to take on larger loans, which drove prices higher. Meanwhile, housebuilding failed to keep pace with population growth and household formation, constraining supply. And the Right to Buy policy, introduced in 1980, converted millions of social renters into property owners at below-market prices.
Those tailwinds are gone. Interest rates will not fall from 15% to 0% again. Housebuilding is increasing after decades of undersupply. The buy-to-let tax environment has been significantly tightened since 2017. And as the data from 2016 onwards shows, the era when you could reliably outperform diversified equity investment by buying UK residential property has come to a close. Understanding this shift is the starting point for any honest 2026 analysis of the property-versus-investing debate.
Golden age of UK property (Rathbones): 1980-2016, house prices +6.7%/yr nationally; +8.5%/yr London. 5 years to December 2025: UK house prices +3.3%/yr (below inflation at 5.1%/yr); global equities +10.9%/yr; +13%/yr total return with dividends (Schroders; MSCI World GBP; LSEG Datastream). 20 years (2005-2025): £100k in UK property → £182k; £100k in global equities (with dividends) → £728k (Schroders). Not investment advice. Past performance not a guide to the future.
What the 20-Year Data Actually Shows
The most comprehensive and up-to-date comparison of UK property versus equity investment comes from Schroders’ analysis, reported in IFA Magazine. Over the 20 years from 2005 to the end of 2025, a £100,000 investment in average UK property grew to £182,000 in nominal terms — a 3.0% per year nominal return. Adjusted for inflation, that £182,000 is worth approximately £103,000 in 2005 purchasing power, representing a real annual return of just 0.1%. UK property, over two decades, has barely kept up with inflation.Over the same period, £100,000 invested in global equities including reinvested dividends — tracking the MSCI World total return index in GBP terms — grew to £728,000. That is 10.4% per year nominal, 7.3% per year in real terms. Even excluding dividends and taking only price return, global equities produced £450,000 from an initial £100,000, at 7.8% per year nominal.
The property figure does not include rental income, which is a significant omission. Gross rental yields have averaged approximately 6% per year over the past 20 years (with wide regional variation), though net yields after costs and voids are typically 4–5%. Adding this to the property total return significantly narrows the gap, though the equity comparison including dividends still outperforms. But property’s 3.0% price appreciation plus 4–5% net rental income versus equities’ 10.4% total return means equities still win on this 20-year comparison, even with rental income included in the property figure.
For the five years to the end of 2025, the gap is even wider. Schroders reports that UK house price growth of 3.3% per year fell well short of inflation at 5.1% per year — meaning UK property destroyed real value over this period on price alone. Global equity prices rose 10.9% per year in sterling terms, 13% per year in total returns. Duncan Lamont, Head of Strategic Research at Schroders, stated the comparison directly: in terms of wealth building, the pension (and by extension, the stocks and shares ISA) has significantly outperformed property in the most recent five years.
Duncan Lamont, Head of Strategic Research at Schroders (IFA Magazine): 'In the five years to the end of 2025, UK house-price growth was 3.3% a year, well short of inflation which came in at 5.1% a year. In contrast, global equity prices were up 10.9% a year in sterling terms, 13% a year in total returns if dividends are included.' Source: IFA Magazine (Schroders data, MSCI World total return GBP, LSEG Datastream, Land Registry; data to 31 December 2025). Past performance is not a guide to the future.
The Last Decade: A Story of Two Assets
Rathbones’ landmark July 2025 report, ‘Don’t Bet the House,’ provides the most granular recent comparison. Since 2016 — the inflection point at which the golden age of property ended — the divergence between property and equities has been stark. £100 invested in UK property in 2016 was worth approximately £134 in 2024. £100 invested in London property in 2016 was worth only £111. But £100 invested in a simple portfolio of 25% UK equities and 75% international equities over the same period grew to £174.In inflation-adjusted terms, the contrast is even more unflattering for property. London house prices rose just 1.3% per year since 2016, which is 2.2 percentage points below inflation. UK average house prices outside London only just kept pace with inflation. Meanwhile, the global equity mix rose 3.4 percentage points per year above inflation.
To put this in the context of 40-year historical data: between 1964 and the start of 2023, UK house prices rose by an average of 7.7% per year, while the FTSE All-Share rose by 6.3% on average (Rathbones, Q4 2023). In the very long run, property and equities were more comparable — particularly London property, which matched the S&P 500 in GBP terms at approximately 8.5% per year. But the more recent decade has seen a decisive shift, driven by the end of the rate cycle that underpinned property’s golden age and the explosive growth of US technology stocks that dominate global equity indices.
Oliver Jones, Head of Asset Allocation at Rathbones (July 2025; Property Industry Eye): 'The idea that you can’t go wrong with bricks and mortar just isn’t true. The data shows that diversified global investment has put to shame returns from housing over the last decade – and we believe this trend will continue. The earlier boom in house prices was fuelled by factors which no longer hold.' Source: Rathbones ‘Don’t Bet the House’ report (July 2025). Past performance is not a guide to the future.
The Leverage Argument: Property’s Hidden Superpower
The raw return comparison between property and equities systematically understates property’s appeal because it ignores the most powerful feature of homeownership: leverage. When you buy a house with a 10% deposit, you control 100% of an asset with only 10% of its value invested. If the property rises 5% in value, your 10% deposit has produced a 50% return on the capital you actually deployed.This is the comparison that most property investors actually experience. A buyer who puts down a £27,000 deposit on a £270,000 property that appreciates 3.8% (ONS provisional estimate, year to April 2026) sees the property value rise by approximately £10,260 in one year. That is a 38% return on the £27,000 invested — not a 3.8% return. No mainstream investment vehicle provides this kind of leverage to retail investors at low interest rates on £270,000 of capital.
But leverage is a double-edged sword that property enthusiasts rarely acknowledge with the same enthusiasm. If the same property falls 10% in value, the £27,000 deposit is almost entirely wiped out — a 100% loss on the invested capital. And unlike equities (where you can hold through a drawdown at zero carrying cost), the mortgage must be serviced every month regardless of what the property is worth. As Schroders notes, leverage ‘magnifies downside risks if house prices fall.’
The leverage argument also does not translate directly to investing. Most investors do not use leverage in their equity portfolios and are not comparing a 10%-deposit leveraged property position against an unlevered stock portfolio. The fair comparison is: should I put my £27,000 deposit into the stock market, or should I use it as a deposit to buy a £270,000 house? That framing — which we explore below — changes the calculus significantly.
Property’s leverage advantage (illustrative): £27,000 deposit on £270,000 house at 3.8% annual price growth = ~£10,260 in value gain in year 1 = ~38% return on capital deployed. The same £27,000 invested in a global equity fund at 10.9% return = ~£2,943 gain in year 1 = ~10.9% return. Leverage makes property’s return on cash invested significantly higher in a rising market. BUT: leverage also magnifies losses. Property values can and do fall. Mortgage must be serviced regardless. Not financial or investment advice.
The Hidden Costs of Property That the Data Misses
The raw return comparisons between property and equities typically make no allowance for the significant costs that erode property returns in practice. Understanding these costs is essential for any honest comparison.- Transaction costs: buying a property typically involves stamp duty (SDLT), solicitor fees (£1,500–3,000), survey costs (£500–1,500), and mortgage arrangement fees (£500–1,500). On a £270,000 purchase, these might total £4,000–6,000 before a single month of ownership. For a buy-to-let investor, the SDLT surcharge (5 percentage points above standard rates since April 2016) adds significantly more. These costs must be earned back before any real return is achieved.
- Ongoing maintenance: property requires active management. The standard rule of thumb — 1–2% of property value per year in maintenance — represents £2,700–5,400 per year on a £270,000 home. Over 20 years, that is £54,000–£108,000 in maintenance costs that the equity investor does not pay. This is not included in any of the headline property return figures.
- Illiquidity: you cannot sell 5% of your house to cover an unexpected expense. Property is one of the most illiquid assets in any mainstream portfolio. Selling takes weeks or months, incurs significant transaction costs, and cannot be executed without vacating the property (or ending a tenancy in the case of buy-to-let). Equities in a Stocks and Shares ISA can be sold within days, with proceeds available within a week.
- Management time: buy-to-let investment requires ongoing landlord responsibilities — tenant management, maintenance coordination, regulatory compliance (EPC certificates, gas safety, electrical safety, right to rent checks), and accounting. This time has a real value that never appears in return calculations.
- Concentration risk: most homeowners have the vast majority of their net worth in a single illiquid asset in a single postcode. This is the most undiversified investment position in personal finance, and no investment adviser would recommend it for any other asset class.
The Hidden Advantages of Stocks That People Overlook
The comparison between property and investing in equities is not simply about raw returns. Stocks have structural advantages that are genuinely compelling but psychologically underweighted because they are less tangible than bricks and mortar.- Compound dividends: the MSCI World total return index includes reinvested dividends — a compounding effect that is responsible for a substantial portion of the return differential against property. The 20-year comparison shows £728,000 from global equities with dividends vs £450,000 without. The difference between these two numbers (£278,000 on a £100,000 initial investment) is entirely the compounding power of reinvested dividends. Property provides rental income — the equivalent of dividends — but it must be managed, declared, and taxed rather than being automatically reinvested tax-free inside an ISA.
- ISA tax shelter: a Stocks and Shares ISA wraps equity investment in a tax-free shell. No income tax on dividends, no capital gains tax on gains, no reporting requirement, no annual limit on growth. The annual contribution limit is £20,000 per person per tax year, rising to potentially £40,000 for a couple. Property outside the ISA structure attracts income tax on rental income (with restricted mortgage interest relief for higher-rate taxpayers since 2017) and capital gains tax at 18–28% on disposal.
- Global diversification: a global equity index fund holds thousands of companies in dozens of countries, sectors, and currencies. A residential property portfolio is concentrated in a single local market. Events that reduce the attractiveness of a specific location — employer relocations, infrastructure changes, local economic shocks — can disproportionately affect a property while having no impact on a diversified equity portfolio.
- Low cost: a global index tracker ETF or fund can be held for 0.05–0.20% annual charges. There are no transaction costs between rebalancing events, no maintenance costs, no management time, and no regulatory compliance burden. The total cost of equity ownership over 20 years is a fraction of the total cost of property ownership over the same period.
Buying a Home to Live In vs Buying to Invest: Two Different Questions
The most important distinction in the property-versus-investing debate is between buying a home to live in and buying property as a financial investment. These are fundamentally different decisions that should be evaluated on different criteria.Buying a home to live in provides a package of benefits that go far beyond financial return: security of tenure, the ability to modify and personalise the space, stability for children and families, freedom from landlord decisions, community roots, and a forced saving mechanism that many people find psychologically valuable. For most people, a home is not purely an investment — it is a place to live. The financial return is a secondary benefit, and comparing it against equity investments misses the point that renting the equivalent property and investing the difference is not a realistic alternative for most households.
The comparison between property and investing becomes most relevant in three specific situations: when considering a buy-to-let property as a financial investment; when deciding whether to overpay a mortgage versus investing surplus income; and when deciding where to put a lump sum (deposit) that could either purchase a property or be invested in equities. In each of these cases, the financial comparison is meaningful and the data increasingly favours equities over additional property purchases, particularly for those who are already homeowners.
For first-time buyers asking whether to buy or invest, the question almost always resolves to: what is the alternative to buying? If the alternative is renting and investing the deposit in the stock market, the calculation must include the rising cost of renting (UK rents up 3.4–3.5% per year; average monthly rent now £1,377), the forced saving effect of mortgage repayments, and the non-financial benefits of ownership. On these terms, buying a home to live in still makes sense for most people who can afford it — even if the pure investment returns are now more competitive from equities.
Buy-to-Let in 2026: The Numbers Are Harder Than They Look
For pure investment property — buy-to-let — the 2026 arithmetic is significantly more challenging than the headline rental yield figures suggest. The August App’s August 2026 analysis of current UK buy-to-let numbers provides a clear-eyed view of what the actual returns look like.A 75% LTV mortgaged buy-to-let purchase of an average UK property generates returns of roughly 0–3% on the cash invested with flat house prices, rising to 11–14% if annual house price growth runs at 3.5%. The case for buy-to-let investment rests entirely on capital growth — and the August App is explicit: ‘the growth row you believe in is a market view, not a guarantee.’ UK prices rose 3.8% in the year to April 2026 on ONS provisional estimates, but recent years have included near-flat periods, and future growth is uncertain.
For higher-rate taxpayers, the picture is worse. Section 24 of the Finance Act, implemented from 2017, restricts the deduction of mortgage interest costs to a 20% tax credit rather than full deduction. A higher-rate taxpayer who previously deducted mortgage interest at 40% now receives relief at only 20%, effectively increasing the tax on rental income and reducing net yields substantially. Many higher-rate taxpayers who bought buy-to-let properties when the tax rules were more favourable have found their net returns sharply reduced by this change.
Additionally, the SDLT surcharge of 5 percentage points on second home and buy-to-let purchases (introduced April 2016) significantly increases the upfront cost of acquisition and the time required to break even. On a £270,000 buy-to-let purchase, the SDLT at current rates for a second property adds approximately £11,000 in upfront tax that must be recovered before any real return is achieved.
For higher-rate taxpayer buy-to-let investors: Section 24 (Finance Act 2017) restricts mortgage interest relief to a 20% tax credit. On a £200,000 mortgage at 5% interest (£10,000 per year interest): a higher-rate taxpayer receives £2,000 tax credit (20%) rather than the previous £4,000 (40%) deduction. The extra £2,000 in effective tax reduces net yield by approximately 0.7 percentage points on a £270,000 property. Combined with the SDLT surcharge and CGT on disposal, the after-tax return on mortgaged BTL for higher-rate taxpayers is significantly lower than gross yield figures suggest. Not financial or tax advice. Consult a qualified tax adviser.
The Tax Comparison: Stocks and Shares ISA vs Property
Tax treatment is one of the most significant differences between equity investment and property investment, and it consistently favours equities held in the ISA wrapper.Note: tax rules change frequently. This table reflects rules as understood at time of writing (September 2026). Always consult a qualified tax adviser. Not financial or tax advice.
What the Experts Say in 2026
The consensus among UK investment professionals and wealth managers in 2025-2026 has shifted meaningfully against the assumption that property is the superior wealth-building vehicle.- Schroders (IFA Magazine, data to December 2025): ‘Over the last 20 years, £100,000 in global equities with dividends reinvested grew to £728,000, versus £182,000 in UK property. In the five years to end 2025, property grew at 3.3% per year below inflation, while global equities returned 13% per year total return.’ Duncan Lamont suggested the pension (equities) outperformed property comprehensively.
- Rathbones (‘Don’t Bet the House,’ July 2025): ‘The longstanding British obsession with property as a means of building wealth is outdated as today’s house buyers will not match the gains of past generations. The boom years in property investment which lasted from the 1980s to the mid-2010s are now over.’ Oliver Jones (Head of Asset Allocation): ‘The data shows that diversified global investment has put to shame returns from housing over the last decade – and we believe this trend will continue.’
- Brewin Dolphin (historical analysis): £100 in FTSE All Share from 1986 with dividends reinvested grew to approximately £1,707 vs £846 from buy-to-let property. Stock market total return outperformed buy-to-let by approximately 2:1 over this period. Rob Burgeman (Brewin Dolphin): ‘With the right financial advice, investing over the long term the stock market can provide solid returns.’
- Octopus Money: estimated annual returns of approximately 4.7% for UK property (all-in including rental income) vs approximately 5.3% for global shares over the long run. ‘When we add to that the fact that you can withdraw money from stocks and shares as and when you please and you don’t need to cover the roof repairs when there is a leak, this makes stocks and shares a really attractive option.’
- Capital.com (November 2025): FTSE 100 year to date to November 2025 was up approximately 17.5%, near its record high of 9,777, ‘comfortably ahead of house price growth.’ Historically in earlier years, house price growth often outpaced the FTSE 100 in certain periods; that pattern has reversed.
The Head-to-Head Scorecard
So When Does Buying a House Win?
The financial data strongly favours equities over pure investment property in recent years — but property, particularly as a primary residence, has compelling advantages in specific circumstances.- You need somewhere to live: the most fundamental advantage of buying over investing is that you get to live in the asset. Renting and investing is not the same as buying, because renting requires ongoing monthly payments that invest nothing. If the choice is between renting (and investing the deposit) or buying (and paying a mortgage), the monthly cost comparison matters enormously — and in most parts of the UK outside London, buying is now cheaper on a monthly basis (TwentyCi: UK homeowners save £493/month vs tenants on average in 2026).
- You can use leverage at favourable rates: a mortgage at 4–5% interest on a £270,000 property gives you leveraged exposure to a real asset that you cannot replicate in the stock market at equivalent cost. On a rising property market, the return on the deposited capital is significantly higher than the headline price return. This argument is strongest in areas with good supply constraints and demand drivers.
- You value non-financial security: tenure security, the ability to make structural changes, no landlord risk, no involuntary displacement, school catchment area certainty, and the psychological comfort of owning your home are real and meaningful benefits that do not appear in any return comparison.
- You are in Northern England, Scotland, or Wales: these markets currently offer monthly mortgage costs significantly below equivalent rents (REalyse July 2026). In the North East, buying a typical flat saves approximately £380 per month vs renting. The monthly cost advantage of buying is itself a form of return.
- You are a long-term, low-leverage buyer: the argument against property as an investment is strongest for highly leveraged, higher-rate taxpayer buy-to-let buyers in low-yield areas. A cash buyer purchasing a high-yield property in a growing northern city, with a 10–15 year horizon, has a more competitive return profile than the headline data suggests.
So When Does Investing Win?
Equities in a Stocks and Shares ISA win on almost every purely financial metric in the current environment, and there are specific situations where the investment case is particularly clear.- You already own a home: once residential security is established, the case for putting additional capital into equity investment rather than additional property is very strong. Buying a second investment property adds concentration risk, SDLT surcharges, management obligation, and tax complexity. A diversified equity ISA is more efficient, more liquid, and has outperformed property over the recent decade.
- You are a higher-rate taxpayer: Section 24 makes buy-to-let investment materially less attractive for those paying 40%+ income tax. The Stocks and Shares ISA eliminates tax on both income and capital gains, making the after-tax return comparison decisively in favour of equities for this group.
- You have a long time horizon: compounding in an equity portfolio over 20–30 years is remarkably powerful. Schroders’ 20-year data shows £100,000 growing to £728,000 in equities with dividends reinvested. That figure includes the significant compounding benefit of automatic dividend reinvestment inside a tax-free ISA wrapper — something that property rental income cannot replicate without active management and tax obligations.
- You cannot meet the deposit requirement for the property market you want to enter: if the choice is between investing a £15,000 deposit that cannot buy a home in your target area, or putting it into a global equity ISA, the equity route offers better expected returns with lower transaction costs and higher liquidity.
- You value liquidity and flexibility: life changes unpredictably. A Stocks and Shares ISA can be liquidated in days; a property takes months to sell and incurs 3–5% in transaction costs. For anyone who may need access to their capital within a 5–10 year window, equities are structurally preferable to illiquid property.
Conclusion
The honest answer to the question ‘should I buy a house or invest?’ in 2026 is nuanced in a way that the British property consensus has resisted for a long time. If you are buying a home to live in, buying a house still makes sense for most people who can afford it — provided it is in a market where monthly costs are manageable, you plan to stay for at least five years, and you are not stretching your finances to a dangerous degree. The non-financial benefits of ownership are real, the forced saving effect of mortgage repayment is real, and the monthly cost advantage over renting is real in many UK regions.If you are buying additional property as an investment vehicle — particularly a mortgaged buy-to-let as a higher-rate taxpayer — the financial case has weakened significantly. The golden age of UK property investment ended around 2016 according to Rathbones’ research. The last five years of data show UK house prices growing at 3.3% per year (below inflation) while global equities returned 13% per year. The tax environment for buy-to-let has deteriorated materially since 2017. The SDLT surcharge on second properties is substantial. Management costs and obligations are real and growing with regulation.
The most financially optimal strategy for most UK households in 2026 is: buy a home to live in when you can, in the most affordable market accessible to you, using the lowest-cost mortgage available; and invest surplus capital in a Stocks and Shares ISA tracking a low-cost global equity index fund rather than buying additional investment property. Not financial or investment advice — always consult a qualified independent financial adviser for guidance specific to your circumstances.
Frequently Asked Questions
Has UK property beaten the stock market historically?It depends on the period and how you measure it. Over the very long run (1964-2023), UK house prices rose at an average of 7.7% per year, ahead of the FTSE All-Share at 6.3% per year (Rathbones, Q4 2023). London property historically matched the S&P 500 in sterling terms at approximately 8.5% per year over the same period. However, these figures do not include dividends for equities or rental income for property. When total returns are compared (including dividends and income), global equities have outperformed property over the 20-year period to 2025: Schroders data shows £100,000 in global equities (with dividends reinvested) growing to £728,000 vs £182,000 in UK property. In the five years to end 2025, the gap is even wider: global equities returned 13% per year total return vs UK house price growth of 3.3% (below inflation). Rathbones concluded in July 2025 that the 'golden age of UK property investment' ended around 2016. Not investment advice. Past performance is not a guide to the future.
Should I put my deposit into a Stocks and Shares ISA instead of buying a house?
This depends on your situation. If you need somewhere to live, the alternative to buying is renting — and average UK rents are £1,377 per month and rising 3.4-3.5% per year. If you invest your deposit instead of buying and continue renting, your deposit earns investment returns but you continue paying rent that builds no equity. For most people who can afford to buy in their target area, buying still makes sense as a primary residence decision, even if the pure investment return on property has been weaker than equities recently. However, if you already own a home and are considering buy-to-let as an additional investment, the data and tax environment increasingly favour a Stocks and Shares ISA as the more efficient vehicle. Not financial or investment advice.
What has the stock market returned vs UK house prices over 20 years?
Schroders analysis (data to December 2025, LSEG Datastream, Land Registry, MSCI, ONS): over 20 years from 2005 to 2025, £100,000 in average UK property grew to £182,000 (3.0% per year nominal, 0.1% real). Over the same period, £100,000 in global equities including reinvested dividends grew to £728,000 (10.4% per year nominal, 7.3% real). Without dividends, equities grew to £450,000 (7.8% per year). Note: property figure excludes rental income; equity figure includes dividends. Adding net rental income of 4-5% per year to property would narrow but not close the gap. Source: IFA Magazine (Schroders data). Past performance is not a guide to the future. Not investment advice.
Is buy-to-let still worth it in 2026?
Buy-to-let is worth it in 2026 where three things align: a genuine gross rental yield (above 5-6%), moderate borrowing (LTV below 75%), and a time horizon long enough for capital growth to do its work (August App, August 2026). At 75% LTV on average UK figures, buy-to-let returns roughly 0-3% on cash with flat house prices and 11-14% if growth runs at 3.5%. The case rests heavily on capital growth, which is not guaranteed. For higher-rate taxpayers, Section 24 (Finance Act 2017) restricts mortgage interest relief to a 20% tax credit, significantly reducing net returns vs the pre-2017 regime. The SDLT surcharge on second properties (5 percentage points) increases upfront acquisition cost. UK prices rose 3.8% in the year to April 2026 (ONS), but recent years included near-flat periods. Not financial or investment advice.
What is the most tax-efficient way to invest in the UK in 2026?
The Stocks and Shares ISA provides income tax-free dividends, capital gains tax-free growth, and no reporting requirements within the annual £20,000 contribution limit (£40,000 for a couple). No other mainstream investment vehicle in the UK eliminates both income and capital gains tax simultaneously. For long-term wealth building above the ISA limit, a pension (SIPP) provides income tax relief on contributions at the marginal rate (40% or 45% for higher earners), tax-free growth, and (until April 2027) advantageous inheritance tax treatment on unused funds. Property held directly outside an ISA or pension attracts income tax on rental income (restricted to 20% tax credit for mortgage interest for higher-rate taxpayers under Section 24), capital gains tax at 18-24% on gains, and SDLT on acquisition. Not financial or tax advice. Consult a qualified adviser.

0 Comments Comments