
Investing
Dollar-Cost Averaging Into Stocks: How Does DCA Work?

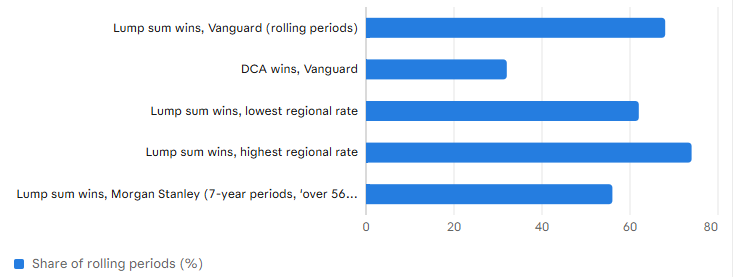
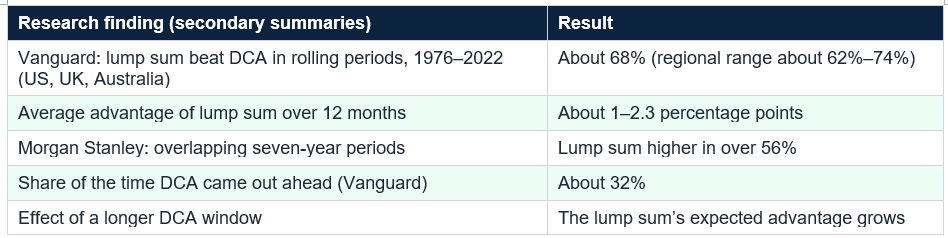
Vanguard (1976–2022; US, UK, Australia): lump sum beat a DCA schedule in about 68% of rolling periods (regional range about 62%–74%) by roughly 1 to 2.3 percentage points on average; Morgan Stanley: lump sum ahead in over 56% of seven-year periods; the advantage grows the longer DCA is stretched. Behavior and markets: DALBAR: average investor 6.8% vs 10.2% a year for the S&P 500 over 30 years; missing the 10 best days over 20 years cut the S&P 500’s return from 10.6% to 6.4%; 27 bear markets since 1928 averaged a 35% loss; 52-week T-bill yield about 4.46%; Shiller CAPE above 41. My arithmetic: $500 a month for six months at prices of $100, $90, $70, $80, $95 and $110 gives an average cost of about $88.87 vs an average price of $90.83; $12,000 invested at once is worth about $12,960 after a year at 8% vs about $12,761 for 12-month DCA (cash at 4.4%), a gap of about $199; in a falling-then-recovering market DCA wins ($13,276 vs $12,000); $500 a month for 30 years at 7% grows to about $610,000, and waiting one year costs about $46,900.
The two get blurred, and research on one does not apply to the other. This primer covers both: how DCA works, what it does well and what it does not, what Vanguard and other studies found when comparing it with investing a lump sum all at once and how to set it up. I use worked examples with stated assumptions and flag where the sources disagree.
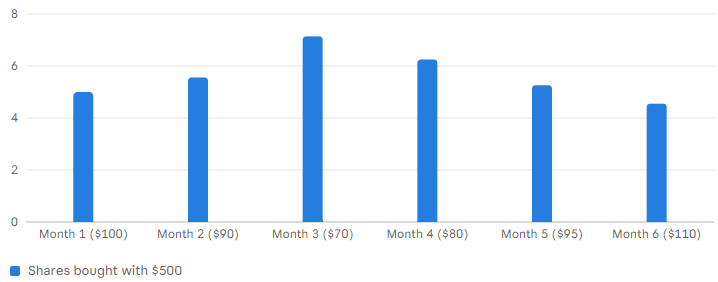
The average cost is lower because you buy more shares at low prices: the $70 month buys over seven shares while the $110 month buys under five. At a final price of $110, the 33.76 shares are worth about $3,713, a gain of about $713, or 23.8%, whereas investing the whole $3,000 at $100 would give 30 shares worth $3,300. In this made-up path DCA won because prices dipped along the way, which is not guaranteed.
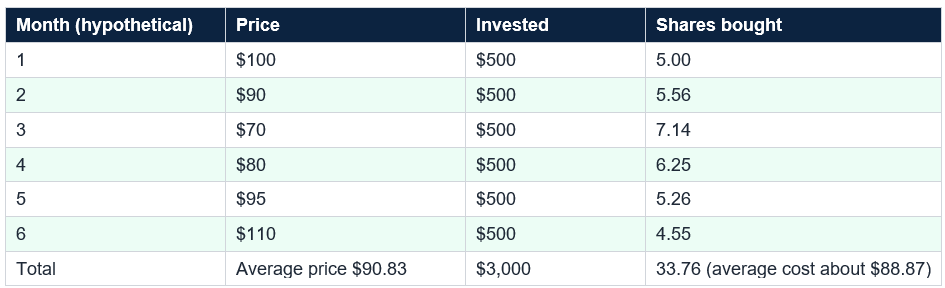
Hypothetical: $500 a month for six months at prices of $100, $90, $70, $80, $95 and $110 buys about 33.76 shares for $3,000, an average cost of about $88.87 against an average price of $90.83. At $110 the shares are worth about $3,713 (+23.8%), vs $3,300 if $3,000 had been invested at $100.
It also keeps you in the market for the best days. JPMorgan found that missing just the 10 best days over 20 years cut the S&P 500’s annualized return from about 10.6% to about 6.4%, turning $10,000 into about $34,400 instead of about $75,000, and investors who wait for a better entry point often miss them. And for people who invest from income, DCA matches how money arrives: you cannot invest next year’s paychecks today.
It also has a cost when you already hold a lump sum: while the money waits, it sits in cash. In a 12-month schedule with equal monthly purchases, about 46% of the money is uninvested on average over the year, in my arithmetic, and if markets rise, that cash misses the gains. Vanguard’s research finds the lump sum’s expected advantage grows with the length of the DCA window. DCA is not wrong, but it is not free.
There are caveats. Sources disagree on details, with most describing a 12-month DCA schedule and one a three-month window, and I did not retrieve the original paper. A 68% win rate also means DCA won about 32% of the time, and a badly timed lump sum can lose more than a well-timed one gains. Vanguard’s conclusion, as summarized, is not a blanket recommendation: investors who would panic after an early loss may be better off with DCA. The best strategy is the one you will stick with.
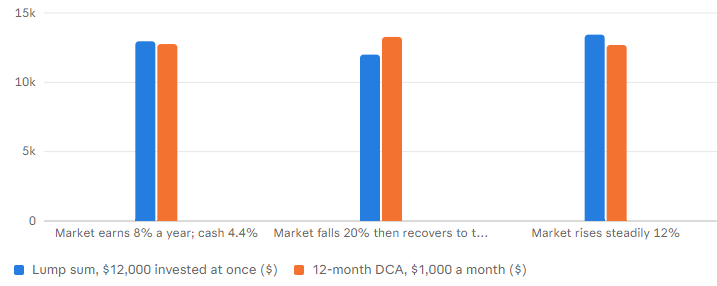
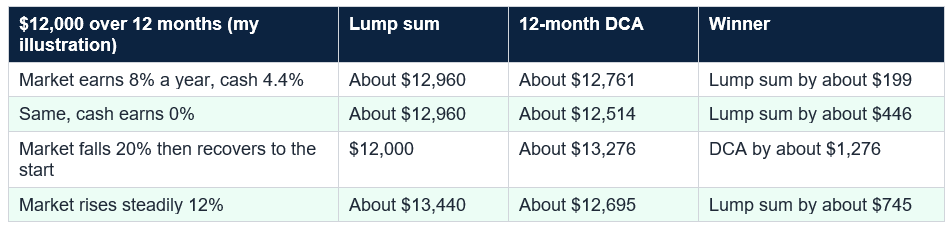
But the outcome depends on the path. If the market falls 20% over five months and recovers to its starting level by month 11, the lump sum ends flat at $12,000 while DCA, which bought more shares at lower prices, ends at about $13,276. In a market rising steadily 12%, the lump sum would be worth about $13,440 and DCA about $12,695. DCA wins when the market dips and loses when it rises, as the research found; the skill is not predicting which but choosing a plan you can live with.
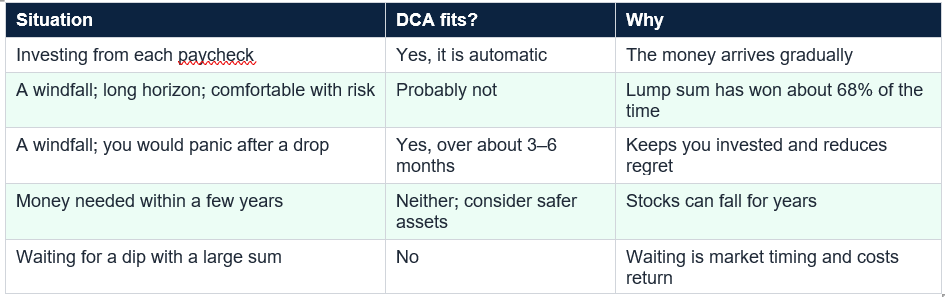
There are also good reasons not to. If you are comfortable with risk and have a long horizon, the research favors investing the lump sum now; stretching DCA over two years gives up expected return, and holding cash while waiting for a dip is market timing. Make the decision once and stick to it, since a plan abandoned halfway, by stopping contributions after a fall, defeats the point.
A modest, automatic amount beats a perfect plan that never starts. If $500 a month is too much, start with $50 or $100 and raise it with each raise; the 2026 401(k) limit of $24,500 is about $942 per biweekly paycheck and the $7,500 IRA limit is $625 a month, so there is room to grow. The S&P 500 returned about 11% a year over the past 20 years, according to Kiplinger, with no guarantee for the next.
Many brokers allow automatic investments and fractional shares, so small amounts work. Check for fees, minimums and commissions, since a $5 fee on a $50 purchase is a 10% cost, and keep your emergency fund separate so you can keep going when markets fall. Resist the urge to pause when headlines are scary: the purchases made in downturns are the ones that lower your average cost.
If you are not investing yet, set up a $50 or $100 monthly automatic purchase of a broad index fund today. You can raise it later, but you cannot get back the months you waited.
Common mistakes include stopping contributions when markets fall, spreading a lump sum over a very long period, believing DCA eliminates risk, buying a single stock on a schedule and calling it diversified, ignoring fees, investing money you will need soon and waiting for the perfect starting point. DCA is a schedule; what you buy matters far more.
So use DCA where it is natural, with each paycheck, and consider a short schedule of three to six months for a windfall only if you would otherwise freeze or panic. In my example, a $12,000 lump sum beat 12-month DCA by about $199 when markets rose and lost by about $1,276 when they dipped and recovered. Start small, automate, keep an emergency fund and stay invested. This is general education, not personalized advice.
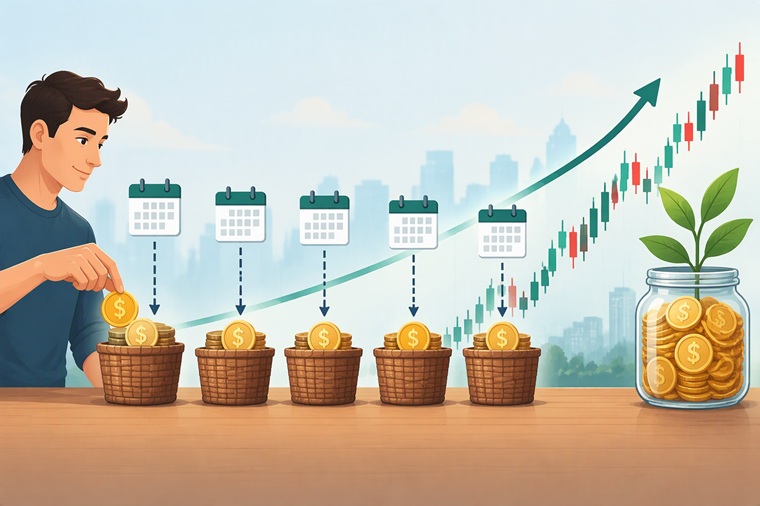
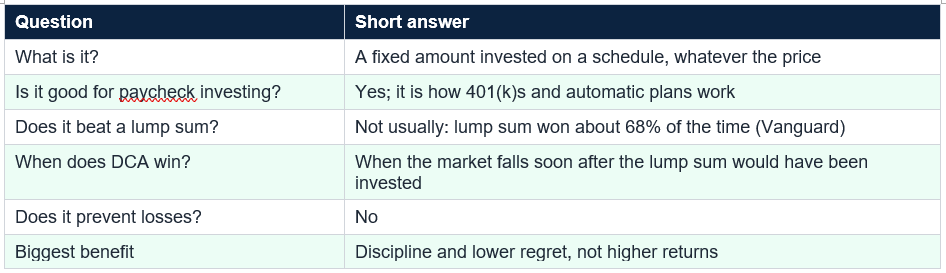
It is investing a fixed dollar amount at regular intervals, such as $500 on the first of every month, regardless of whether prices are high or low. Because the same dollars buy more shares when prices are low and fewer when they are high, your average cost per share can end up below the average price. It is how most people invest through a 401(k).
Does dollar-cost averaging beat investing a lump sum?
Usually not, if you already have the money. Vanguard’s research covering 1976 to 2022 in the US, UK and Australia found a lump sum beat a dollar-cost-averaged schedule in about 68% of rolling periods, by roughly 1 to 2.3 percentage points on average. DCA wins in the minority of cases when markets fall soon after you would have invested. For regular paycheck investing, though, there is no lump sum to choose.
Does DCA protect me from losses?
No. It does not prevent losses or guarantee a profit. If a market falls and keeps falling, every purchase loses value, though later purchases lower your average cost. What DCA does is reduce the risk of putting everything in just before a drop and make investing a habit. Losses are still possible, and the average bear market has been a 35% decline.
How long should I dollar-cost average a lump sum?
If you choose to, sources generally suggest a short window, such as three to 12 months, because the longer you stretch it, the more expected return you give up while money sits in cash. A common view is that three to six months suits a nervous investor. This is general education, not personal advice, and the right answer depends on your temperament.
What should I buy when dollar-cost averaging?
That is a separate decision from DCA, which is only a schedule. Most beginners use a low-cost, diversified index fund or ETF, since 79% of active large-cap funds trailed the S&P 500 in 2025. Buying a single stock on a schedule does not remove the risk of that company doing badly. Check fees and minimums with your broker.
Table of Contents
- Two Meanings of DCA
- The Short Answer
- How Dollar-Cost Averaging Works
- What DCA Does Well
- What DCA Does Not Do
- DCA vs. Lump Sum: What the Research Says
- A Worked Example With Real Trade-Offs
- When DCA Makes Sense
- The Cost of Waiting to Start
- How to Set It Up
- Common Mistakes
- Conclusion
- Frequently Asked Questions
DCA vs. lump sum: how often the lump sum won in the research (%)
% of periods by Vanguard 1976-2022 (US, UK, Australia) and Morgan Stanley as summarized by secondary sources; I did not retrieve the original paper; sources differ on the DCA window (3 vs 12 months)
It depends on the path: $12,000 as a lump sum vs. 12-month DCA ($ after a year)
Value after 12 months ($) by Author's hypothetical arithmetic; tranches invested at the start of each month; DCA wins when the market dips and loses when it rises; not a forecast
How DCA works: a fixed $500 buys more shares when prices are low (hypothetical)
Shares bought by my hypothetical prices; 33.76 shares for $3,000; average cost about $88.87 vs an average price of $90.83; no guarantee of profit
Two Meanings of DCA
Dollar-cost averaging is one of the most popular and most misunderstood ideas in investing, partly because it means two things. To most people it means investing a fixed amount on a regular schedule, say $300 from every paycheck into an index fund, which is simply how a 401(k) works: the money arrives gradually, so it is invested gradually. To an adviser, DCA can also mean taking a big sum you already have, such as a bonus or inheritance, and feeding it into the market over several months.The two get blurred, and research on one does not apply to the other. This primer covers both: how DCA works, what it does well and what it does not, what Vanguard and other studies found when comparing it with investing a lump sum all at once and how to set it up. I use worked examples with stated assumptions and flag where the sources disagree.
The Short Answer
Dollar-cost averaging means investing the same dollar amount at regular intervals, regardless of price. It makes investing automatic, removes the temptation to time the market and can leave your average cost per share below the average price, but it does not guarantee profits or prevent losses. From your paycheck, it is the natural way to invest and it works well. If you already have a lump sum, the research says investing it all at once has beaten a DCA schedule in about 68% of historical periods, so DCA is mainly a way to manage regret and nerves, which can be worth its small expected cost.
How Dollar-Cost Averaging Works
You choose an amount, a schedule and an investment, and each period you buy at whatever the price is. When prices are low your fixed amount buys more shares; when they are high, fewer. Over time your average cost per share can be lower than the simple average of the prices on those dates: in my hypothetical example, $500 a month for six months at prices of $100, $90, $70, $80, $95 and $110 buys about 33.76 shares for $3,000, an average price of $90.83 but an average cost of about $88.87.The average cost is lower because you buy more shares at low prices: the $70 month buys over seven shares while the $110 month buys under five. At a final price of $110, the 33.76 shares are worth about $3,713, a gain of about $713, or 23.8%, whereas investing the whole $3,000 at $100 would give 30 shares worth $3,300. In this made-up path DCA won because prices dipped along the way, which is not guaranteed.
Hypothetical: $500 a month for six months at prices of $100, $90, $70, $80, $95 and $110 buys about 33.76 shares for $3,000, an average cost of about $88.87 against an average price of $90.83. At $110 the shares are worth about $3,713 (+23.8%), vs $3,300 if $3,000 had been invested at $100.
What DCA Does Well
The strongest benefit is behavioral. DALBAR research found the average investor earned about 6.8% a year over 30 years against 10.2% for the S&P 500, largely because of badly timed trades; on $10,000 over 30 years, that is about $72,000 against $184,300. A schedule that invests automatically takes the decision out of your hands, which is what most people need: you do not have to decide whether now is a good time, because you have already decided to invest every month.It also keeps you in the market for the best days. JPMorgan found that missing just the 10 best days over 20 years cut the S&P 500’s annualized return from about 10.6% to about 6.4%, turning $10,000 into about $34,400 instead of about $75,000, and investors who wait for a better entry point often miss them. And for people who invest from income, DCA matches how money arrives: you cannot invest next year’s paychecks today.
What DCA Does Not Do
DCA is often described as a way to reduce risk, which is only partly true. It reduces one specific risk, investing everything just before a drop. It does not reduce market risk overall: if prices fall and stay down, every purchase loses value. The average bear market has been a 35% decline over about 9.6 months, according to Motley Fool coverage of the data, so someone starting DCA at the top of a typical bear market would see losses on most purchases for a time. DCA lowers your average cost, but it cannot make a falling price rise.It also has a cost when you already hold a lump sum: while the money waits, it sits in cash. In a 12-month schedule with equal monthly purchases, about 46% of the money is uninvested on average over the year, in my arithmetic, and if markets rise, that cash misses the gains. Vanguard’s research finds the lump sum’s expected advantage grows with the length of the DCA window. DCA is not wrong, but it is not free.
DCA vs. Lump Sum: What the Research Says
Vanguard studied this in a paper first published in 2012 and updated in 2023 as “Cost averaging: Invest now or temporarily hold your cash?” Comparing the US, UK and Australia from 1976 to 2022, investing a lump sum immediately beat a DCA schedule in about 68% of rolling periods, with regional win rates of roughly 62% to 74%, and an average advantage of about 1 to 2.3 percentage points depending on the summary. Morgan Stanley reported lump sum ahead in over 56% of overlapping seven-year periods. The reason is simple: markets rise more often than they fall, so money invested earlier tends to earn more.There are caveats. Sources disagree on details, with most describing a 12-month DCA schedule and one a three-month window, and I did not retrieve the original paper. A 68% win rate also means DCA won about 32% of the time, and a badly timed lump sum can lose more than a well-timed one gains. Vanguard’s conclusion, as summarized, is not a blanket recommendation: investors who would panic after an early loss may be better off with DCA. The best strategy is the one you will stick with.
A Worked Example With Real Trade-Offs
Take $12,000 and my own assumptions: the market earns 8% a year and cash 4.4%, close to the 4.46% on a 52-week Treasury bill in October. Invested at once, $12,000 grows to about $12,960 in a year. Invested $1,000 at the start of each month for 12 months, with the rest in cash, it grows to about $12,761, a shortfall of about $199, or 1.6%; if cash earned nothing, the shortfall would be about $446. Today’s higher cash yields shrink the cost of DCA.But the outcome depends on the path. If the market falls 20% over five months and recovers to its starting level by month 11, the lump sum ends flat at $12,000 while DCA, which bought more shares at lower prices, ends at about $13,276. In a market rising steadily 12%, the lump sum would be worth about $13,440 and DCA about $12,695. DCA wins when the market dips and loses when it rises, as the research found; the skill is not predicting which but choosing a plan you can live with.
When DCA Makes Sense
There are good reasons to use DCA. From your paycheck, it is automatic and correct. With a windfall, if the thought of an immediate 20% drop would tempt you to sell, spreading it over three to six months, as several sources suggest, may keep you invested; it also suits a first-time investor easing in and a sum that is large relative to your portfolio. The Shiller CAPE above 41 is not a reason in itself, since valuation does not time markets, but it can make nerves understandable.There are also good reasons not to. If you are comfortable with risk and have a long horizon, the research favors investing the lump sum now; stretching DCA over two years gives up expected return, and holding cash while waiting for a dip is market timing. Make the decision once and stick to it, since a plan abandoned halfway, by stopping contributions after a fall, defeats the point.
The Cost of Waiting to Start
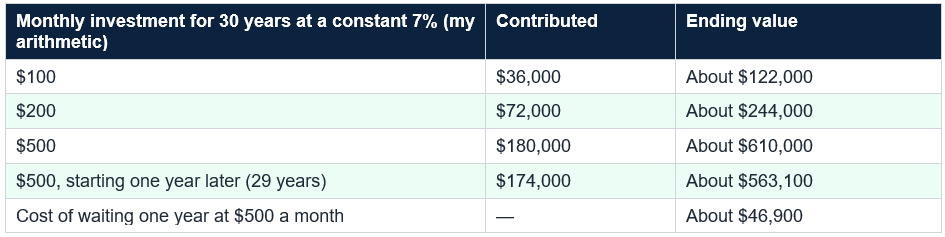
The biggest lever for regular investors is starting. In my arithmetic, $500 a month for 30 years at a constant 7% grows to about $610,000 from $180,000 contributed, while starting a year later produces about $563,100, so waiting one year costs about $46,900. $200 a month grows to about $244,000 and $100 a month to about $122,000. The returns are hypothetical, but the lesson holds: time in the market beats timing the market.A modest, automatic amount beats a perfect plan that never starts. If $500 a month is too much, start with $50 or $100 and raise it with each raise; the 2026 401(k) limit of $24,500 is about $942 per biweekly paycheck and the $7,500 IRA limit is $625 a month, so there is room to grow. The S&P 500 returned about 11% a year over the past 20 years, according to Kiplinger, with no guarantee for the next.
How to Set It Up
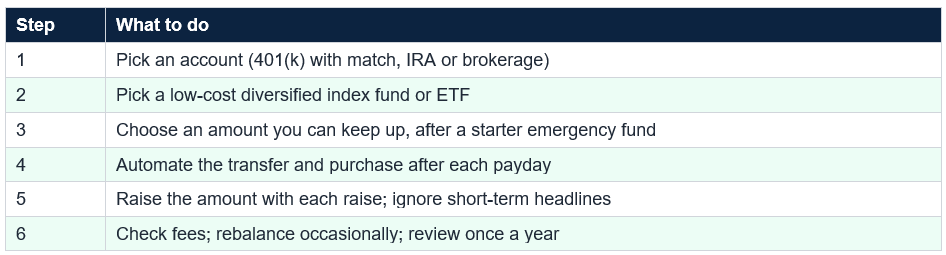
Setting up DCA takes less time than reading about it. Choose an account: a workplace 401(k), especially with an employer match, or an IRA or brokerage account. Choose an investment, typically a low-cost, diversified index fund or ETF, since 79% of active large-cap funds trailed the S&P 500 in 2025. Set an amount you can sustain, ideally after a small emergency fund, automate the transfer and purchase for the day after payday and increase the amount when your income rises.Many brokers allow automatic investments and fractional shares, so small amounts work. Check for fees, minimums and commissions, since a $5 fee on a $50 purchase is a 10% cost, and keep your emergency fund separate so you can keep going when markets fall. Resist the urge to pause when headlines are scary: the purchases made in downturns are the ones that lower your average cost.
If you are not investing yet, set up a $50 or $100 monthly automatic purchase of a broad index fund today. You can raise it later, but you cannot get back the months you waited.
Common mistakes include stopping contributions when markets fall, spreading a lump sum over a very long period, believing DCA eliminates risk, buying a single stock on a schedule and calling it diversified, ignoring fees, investing money you will need soon and waiting for the perfect starting point. DCA is a schedule; what you buy matters far more.
Conclusion
Dollar-cost averaging is a simple idea: invest the same amount at regular intervals and let the schedule, not your mood, decide when. It lowers the risk of a badly timed lump sum, can leave your average cost below the average price and makes investing a habit, which matters because the average investor earned 6.8% a year against 10.2% for the S&P 500 over 30 years. It does not prevent losses, and for an existing lump sum, Vanguard found investing it all at once beat a DCA schedule in about 68% of periods.So use DCA where it is natural, with each paycheck, and consider a short schedule of three to six months for a windfall only if you would otherwise freeze or panic. In my example, a $12,000 lump sum beat 12-month DCA by about $199 when markets rose and lost by about $1,276 when they dipped and recovered. Start small, automate, keep an emergency fund and stay invested. This is general education, not personalized advice.
Frequently Asked Questions
What is dollar-cost averaging?It is investing a fixed dollar amount at regular intervals, such as $500 on the first of every month, regardless of whether prices are high or low. Because the same dollars buy more shares when prices are low and fewer when they are high, your average cost per share can end up below the average price. It is how most people invest through a 401(k).
Does dollar-cost averaging beat investing a lump sum?
Usually not, if you already have the money. Vanguard’s research covering 1976 to 2022 in the US, UK and Australia found a lump sum beat a dollar-cost-averaged schedule in about 68% of rolling periods, by roughly 1 to 2.3 percentage points on average. DCA wins in the minority of cases when markets fall soon after you would have invested. For regular paycheck investing, though, there is no lump sum to choose.
Does DCA protect me from losses?
No. It does not prevent losses or guarantee a profit. If a market falls and keeps falling, every purchase loses value, though later purchases lower your average cost. What DCA does is reduce the risk of putting everything in just before a drop and make investing a habit. Losses are still possible, and the average bear market has been a 35% decline.
How long should I dollar-cost average a lump sum?
If you choose to, sources generally suggest a short window, such as three to 12 months, because the longer you stretch it, the more expected return you give up while money sits in cash. A common view is that three to six months suits a nervous investor. This is general education, not personal advice, and the right answer depends on your temperament.
What should I buy when dollar-cost averaging?
That is a separate decision from DCA, which is only a schedule. Most beginners use a low-cost, diversified index fund or ETF, since 79% of active large-cap funds trailed the S&P 500 in 2025. Buying a single stock on a schedule does not remove the risk of that company doing badly. Check fees and minimums with your broker.
0 Comments
Be the first to share your thoughts on this article.