

Spending
High Grocery Costs? Here’s How to Take Control 2026

Grocery prices are up 24–28% since 2020. 83% of Americans believe they have some control over their grocery bill. Here is exactly how to exercise it.

But here is the finding that most coverage of grocery inflation leaves out: 83 percent of Americans feel they have at least some control over their grocery spending, according to the FMI – Food Industry Association and Hartman Group’s research. Nearly nine out of ten people who buy food — including people who are financially stretched — believe that through deals, promotions, store switching, and smarter shopping habits, they can meaningfully influence what they spend at the checkout.
They are right. This guide shows you exactly how. It covers ten specific, data-backed steps for taking control of a grocery budget in 2026 — from creating a budget that works, to understanding the USDA’s benchmarks for what your household should reasonably be spending, to knowing which categories are getting cheaper right now and which to route around. The control is available. The question is how to exercise it.
The Numbers: USDA Food Price Outlook August 2026: food-at-home +3.8% YoY overall. Beef: +12% forecast for full year 2026. Eggs: -30.7% forecast for full year 2026 (farm-level prices down 83.3% June 2026 vs June 2025). Coffee: +12.9–20% YoY. Cumulative food inflation since 2020: 24–28%.
The story of 2026 grocery prices is really three separate stories. The first is the cumulative damage: food is 24 to 28 percent more expensive than it was five years ago. That cumulative increase does not reverse when the year-over-year rate moderates. The second story is the current inflation: the USDA projects food-at-home prices will rise 3.2 percent for the full year 2026, with beef alone forecast to rise 12 percent. The third story — the one that offers real opportunities — is the divergence within the basket. Egg prices are falling dramatically (forecast down 30.7 percent for the year, with farm-level prices already down 83.3 percent in June 2026 compared to June 2025). This is the kind of divergence that informs a control strategy: route budget away from beef and toward eggs.
Due.com’s June 2026 analysis described the shopper’s available power clearly: ‘You cannot control USDA forecasts, but you control the cart. Plan your meals around the sales, dodge the highest-inflation items, lean on loyalty and cash-back tools, and track your spending for a month to find the leaks.’
A working grocery budget has four components:
The four plans:
Take Control: Use the USDA’s online grocery budget calculator at USDA.gov to get a personalised monthly spending benchmark based on your household size, age, and gender. The calculation takes under two minutes and provides a data-backed spending target that is far more useful than a round number.
The budget calendar works by assigning spending to specific days and weeks rather than treating the month as a single undifferentiated period. A household with a $500 monthly grocery budget has approximately $125 per week. Knowing that the first week is a normal $125 shop, the second week needs to accommodate a dinner party, and the fourth week has a child’s birthday allows the household to pre-shift spending — buying more during weeks one and three to reduce the fourth-week bill.
What to track on the budget calendar:
The most budget-effective form of meal planning is the reverse-engineering approach: check the week’s grocery sales circular first, identify the proteins, produce, and staples at their lowest price this week, and build the week’s meals around those items. This is the opposite of the typical sequence, which starts with deciding what to eat and then shopping for the ingredients regardless of price. Benjamin Lorr, author of The Secret Life of Groceries, told AARP: ‘Reverse-engineering your meals is a great way to save money.’
Practical meal planning discipline:
This finding is supported by multiple independent data sources. Consumer Reports’ price comparison research found that Aldi and Lidl are more than 8 percent cheaper than Walmart on a comparable basket. PocketGuard’s 2026 analysis put Aldi 20 percent cheaper overall. Aldi itself reported gaining 19 million new shoppers in 2025 as budget-conscious households shifted their primary grocery store. NPR’s May 2026 reporting on discount grocery growth found that shoppers are voting with their feet: stores known for lower prices are gaining market share at a rate that has not been seen since the Great Recession.
The practical store-switching framework:
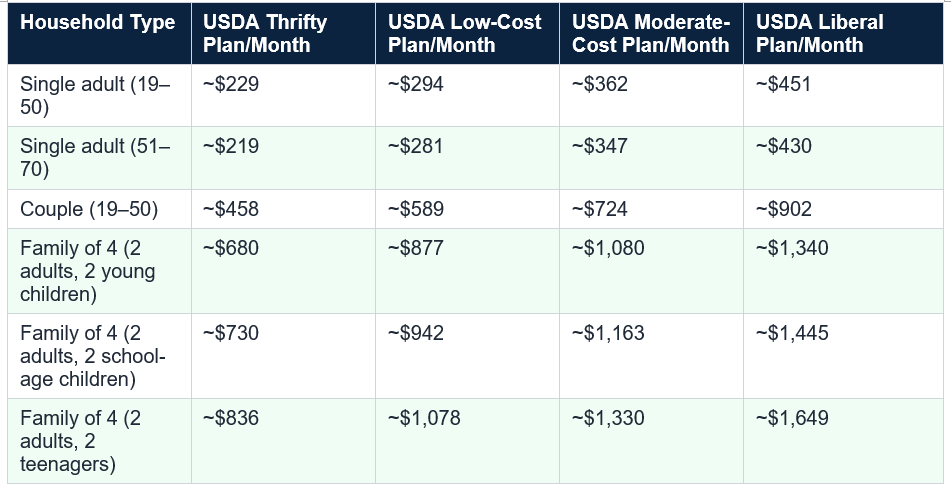
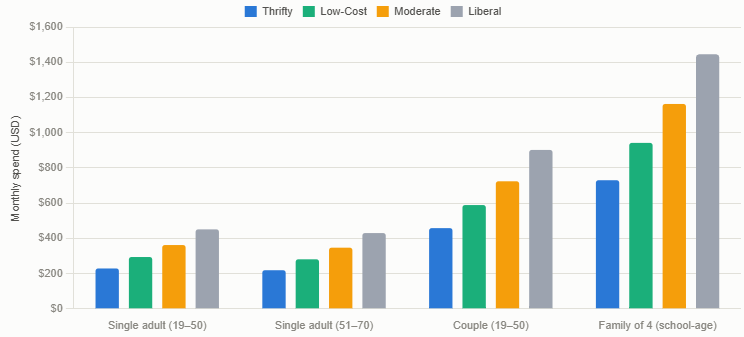
Source: USDA Food Plans (approximate 2026 monthly figures). Plans are adjusted monthly; verify current amounts at USDA.gov. The Moderate-Cost plan is the most widely cited financial benchmark for middle-income households. If your spending is significantly above the Liberal plan for your household type, there is likely meaningful room for savings. If you are at or below the Thrifty plan, you may want to check whether you qualify for SNAP.
Nasdaq’s 2026 analysis added important geographic context: if you live in Hawaii, Alaska, or coastal California, your grocery bill will be significantly above these USDA benchmarks regardless of shopping behaviour. Households in the South and Midwest typically come in at or below the moderate benchmark. Geography is one of the biggest drivers of grocery cost, and the USDA plans are national averages.
The behaviours most consistently cited by households who have successfully reduced food waste:
Take Control: Build meals around eggs as a primary protein source at least three times per week. An egg-based dinner (frittata, shakshuka, fried rice with egg, egg and vegetable hash) costs $2 to $4 to produce per serving — a fraction of the equivalent beef-based meal at current beef prices. The nutritional profile of eggs is exceptional per dollar spent.
SNAP facts for 2026 (NCOA and USDA):
Take Control: Even if you are not sure you qualify for SNAP, apply. Eligibility calculations can be complex, and many households find they qualify at income levels higher than they expected. Applying costs nothing, and even a partial SNAP benefit of $50 to $100 per month meaningfully offsets grocery inflation.
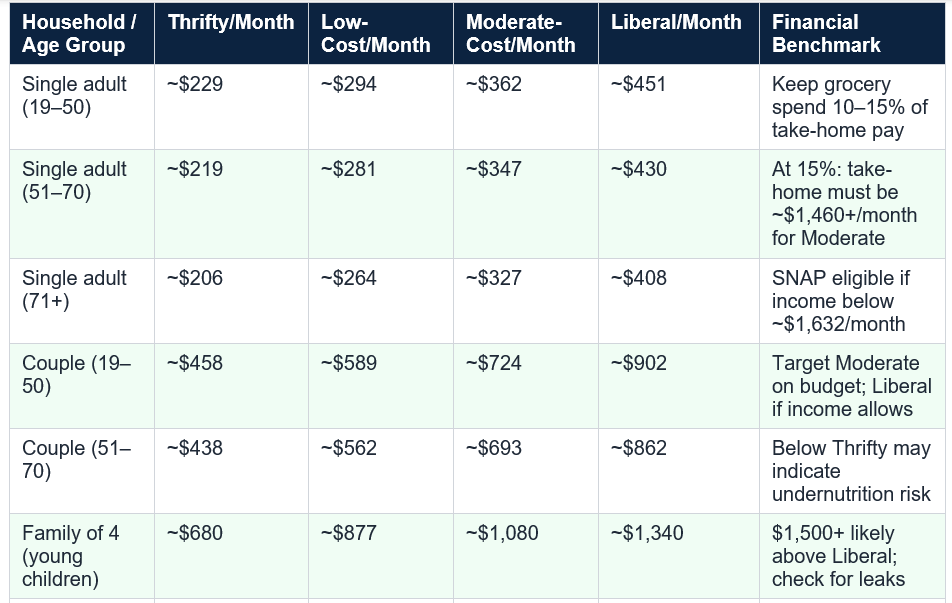
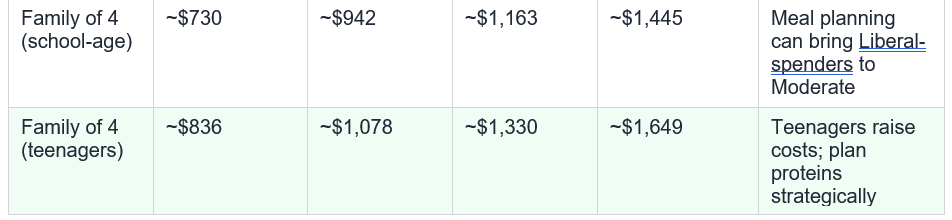
All figures are approximate for 2026 and are updated monthly by USDA. Verify current amounts at ers.usda.gov/data-products/food-price-outlook. The Thrifty Plan is the basis for SNAP benefit calculations. The Moderate Plan is the most commonly cited financial planning benchmark. The Liberal Plan represents a varied, convenient diet with minimal price sensitivity.
Wealthvieu’s July 2026 analysis took this further with a specific quantification: most single adults can cut $100 to $200 per month from their grocery bill without significantly changing what they eat. For a household of four, the equivalent figure is typically $200 to $400 per month achievable through strategic store switching, meal planning, and waste reduction alone.
101 Financial’s May 2026 guide made the systemic point: grocery spending is often a symptom of a broader cash flow picture that lacks visibility. You cannot fix what you cannot see clearly. For households where grocery spending feels uncontrollable, the first intervention is almost always measurement: tracking what is actually being spent for 30 consecutive days. The tracking itself changes behaviour — households that know they are tracking spend differently from households that are shopping on autopilot.
The receipt is determined by where you shop, what you put in the cart, how much of it you actually eat, and what you paid per unit for each item. These are the variables within your control. Eighty-three percent of Americans recognise this. The ten steps in this guide show exactly how to exercise that control: building a budget, using the USDA benchmarks, creating a calendar, planning meals around sales, switching to discount stores, reducing waste, taking advantage of what is getting cheaper, routing around what is most expensive, and checking food assistance eligibility.
None of these steps requires deprivation or a dramatic change in what your household eats. Due.com’s June 2026 analysis framed the strategy perfectly: ‘The families who eat well on a tight budget are not buying worse food — they are planning better, wasting less, and cooking more.’ The checkout line is where control is exercised. The preparation for it is where it is built.
The USDA publishes monthly Food Plans at four budget levels. The Moderate-Cost Plan — the most widely cited financial benchmark — suggests approximately $362/month for a single adult (19–50), approximately $724/month for a couple, and approximately $1,163/month for a family of four with school-age children. Wealthvieu’s July 2026 analysis suggests keeping grocery spending under 10–15% of take-home pay as a financial health guideline. Spending above 15% typically means food costs are crowding out savings or debt repayment. Verify current USDA figures at USDA.gov, as plans are updated monthly.
How do I create a grocery budget that actually works?
Start by establishing a specific monthly spending target using the USDA Food Plans as your benchmark. Track actual spending against that target for 30 days using any tool (spreadsheet, envelope, app). Separate food-at-home from restaurant/delivery spending. Review mid-month to allow course-correction. The tracking habit itself changes behaviour: most households discover $50–$150/month in spending they did not know was occurring once they begin actively measuring. A budget calendar with weekly sub-targets prevents the pattern of overspending early in the month.
Is store-switching really the best strategy?
According to Wealthvieu’s July 2026 analysis, switching stores is the biggest single lever available to most shoppers — more impactful than coupon clipping, rebate apps, or brand switching alone. Consumer Reports found Aldi and Lidl more than 8% cheaper than Walmart on a comparable basket. PocketGuard put Aldi 20% cheaper overall. Aldi gained 19 million new shoppers in 2025. A practical two-store approach — buying staples at Aldi or Lidl and specialty items at a preferred supermarket — captures most of the savings without requiring a complete change in shopping behaviour.
Who qualifies for SNAP in 2026?
SNAP eligibility is based primarily on household income. Gross monthly income must be at or below 130% of the federal poverty level: approximately $1,632/month ($19,584/year) for a single adult in 2026, and approximately $3,354/month for a household of four. SNAP is fully funded through September 2026. The average benefit for a one-person senior household is $188/month. To check eligibility and apply, visit benefits.gov or use the NCOA BenefitsCheckUp tool at benefitscheckup.org. Many households who qualify for SNAP have never applied, assuming they do not meet the income threshold.
What grocery categories are actually getting cheaper in 2026?
Eggs are the standout: the USDA forecasts a 30.7% full-year price decline in 2026, with June 2026 retail prices already 27.9% below June 2025 levels. Farm-level egg prices dropped 83.3% year-over-year in June 2026 as flocks recover from avian flu outbreaks. Fresh fruits are forecast to rise only about 2% for the full year, one of the lower inflation rates in the food basket. Potatoes are up only 1.4% year-over-year. These are the categories to lean into while shifting spending away from beef (+12%) and coffee (+12–20%).
How much can I realistically save by taking control of my grocery budget?
Wealthvieu’s July 2026 analysis estimates most single adults can cut $100–$200/month from their grocery bill without significantly changing what they eat. For a family of four, the equivalent figure is $200–$400/month achievable through strategic store switching, meal planning, and waste reduction alone. Individual results vary significantly by current spending levels, household size, geographic location, and which strategies are implemented. The USDA’s family-of-four food waste estimate of $1,500/year alone represents a starting point for savings that costs nothing to realise except better planning and storage habits.
Table of Contents
- You Have More Control Than You Think
- The Real State of Grocery Prices in 2026
- Step 1: Create a Grocery Budget That Actually Works
- Step 2: Use the USDA Food Plans as Your Benchmark
- Step 3: Build a Budget Calendar
- Step 4: Meal Plan Around Sales, Not Cravings
- Step 5: Switch Stores — The Single Biggest Lever
- Step 6: Understand What You Should Actually Be Spending
- Step 7: Cut Food Waste — The ‘Hidden’ Grocery Bill
- Step 8: Know What Is Getting Cheaper in 2026
- Step 9: Navigate the Highest-Inflation Categories
- Step 10: Check If You Qualify for Food Assistance (SNAP)
- The USDA Food Plans: Full Reference Table
- How Much Control Do Americans Actually Have? The Research
- The Six Common Budget-Wrecking Mistakes
- Conclusion: The Checkout Line Is Where Control Is Exercised
- Frequently Asked Questions
You Have More Control Than You Think
If your grocery bill feels out of control in 2026, you are not imagining it and you are far from alone. Grocery prices are 26 to 28 percent higher than they were in January 2020, according to BLS data cited by Wealthvieu in July 2026. NPR’s What’s Eating America series, published in May 2026, put the figure at nearly 30 percent since before the pandemic. About seven in ten Americans say they are spending more on groceries compared to a year ago, according to an October 2025 ABC News, Washington Post, and Ipsos survey. More than half describe grocery expenses as a major source of stress in their lives.But here is the finding that most coverage of grocery inflation leaves out: 83 percent of Americans feel they have at least some control over their grocery spending, according to the FMI – Food Industry Association and Hartman Group’s research. Nearly nine out of ten people who buy food — including people who are financially stretched — believe that through deals, promotions, store switching, and smarter shopping habits, they can meaningfully influence what they spend at the checkout.
They are right. This guide shows you exactly how. It covers ten specific, data-backed steps for taking control of a grocery budget in 2026 — from creating a budget that works, to understanding the USDA’s benchmarks for what your household should reasonably be spending, to knowing which categories are getting cheaper right now and which to route around. The control is available. The question is how to exercise it.
The Real State of Grocery Prices in 2026
Before building a strategy, it helps to understand exactly where the pain is coming from, because grocery inflation in 2026 is not uniform. Some categories have skyrocketed. Others are stable or falling. Knowing which is which tells you where your budget has room to move.The Numbers: USDA Food Price Outlook August 2026: food-at-home +3.8% YoY overall. Beef: +12% forecast for full year 2026. Eggs: -30.7% forecast for full year 2026 (farm-level prices down 83.3% June 2026 vs June 2025). Coffee: +12.9–20% YoY. Cumulative food inflation since 2020: 24–28%.
The story of 2026 grocery prices is really three separate stories. The first is the cumulative damage: food is 24 to 28 percent more expensive than it was five years ago. That cumulative increase does not reverse when the year-over-year rate moderates. The second story is the current inflation: the USDA projects food-at-home prices will rise 3.2 percent for the full year 2026, with beef alone forecast to rise 12 percent. The third story — the one that offers real opportunities — is the divergence within the basket. Egg prices are falling dramatically (forecast down 30.7 percent for the year, with farm-level prices already down 83.3 percent in June 2026 compared to June 2025). This is the kind of divergence that informs a control strategy: route budget away from beef and toward eggs.
Due.com’s June 2026 analysis described the shopper’s available power clearly: ‘You cannot control USDA forecasts, but you control the cart. Plan your meals around the sales, dodge the highest-inflation items, lean on loyalty and cash-back tools, and track your spending for a month to find the leaks.’
Step 1: Create a Grocery Budget That Actually Works
The most foundational step in taking control of grocery costs is one that fewer than half of households have completed: creating an explicit, tracked grocery budget. NCOA’s analysis is direct: one of the most empowering and effective things each of us can do to save money on food is to create an informed grocery budget. Creating a grocery budget before you need one is the only way to know whether you’re on track, overspending, or actually doing better than you thought.A working grocery budget has four components:
- A monthly spending target: a specific number, not a range, that represents what your household intends to spend on food-at-home this month. The target should be grounded in the USDA’s Food Plans (covered in Step 2), your household’s actual income, and your area’s cost of living.
- A tracking mechanism: a simple spreadsheet, a grocery receipt envelope, or a budgeting app. The tool matters far less than the habit. Family Credit’s June 2026 guide found that most families who feel out of control with their grocery budget have never actually tracked their spending for a full month. Tracking for 30 days alone is often enough to identify $50 to $150 in monthly leakage.
- A distinction between food-at-home and food-away-from-home: restaurant meals, takeout, delivery orders, and coffee runs are a separate budget category from groceries. Families who bundle them together consistently underestimate their grocery spending and overspend on food overall. USDA data shows food-away-from-home prices rose 3.9 percent in 2025 — faster than grocery prices. Every delivery order is more expensive than it was a year ago.
- A weekly review: checking spending against the monthly target at the midpoint of the month is the only way to course-correct before the month is over. A household that is $80 over budget with 15 days remaining can adjust. One that discovers it overspent at month’s end has no options remaining.
Step 2: Use the USDA Food Plans as Your Benchmark
The US Department of Agriculture publishes monthly Food Plans that provide an evidence-based estimate of what a nutritious, home-prepared diet should cost at four budget levels. These plans are adjusted monthly for inflation and serve as the most authoritative benchmark available for what households at different budget levels should be spending on food-at-home.The four plans:
- Thrifty Food Plan: the most budget-conscious benchmark. This is the basis for SNAP benefit calculations. Nutritious and complete but requires significant meal planning discipline.
- Low-Cost Food Plan: the next tier up. More variety than the Thrifty Plan but still emphasises value-focused purchasing.
- Moderate-Cost Food Plan: the most frequently referenced by financial advisers as the appropriate target for middle-income households. For 2026, a single adult should aim for approximately $328 to $388 per month depending on age and gender, and a family of four can expect to spend approximately $1,174 to $1,430.
- Liberal Food Plan: the highest USDA tier, representing a varied and convenient diet with less price sensitivity.
Take Control: Use the USDA’s online grocery budget calculator at USDA.gov to get a personalised monthly spending benchmark based on your household size, age, and gender. The calculation takes under two minutes and provides a data-backed spending target that is far more useful than a round number.
Step 3: Build a Budget Calendar
The budget calendar is the operational tool that connects the monthly spending target to day-to-day shopping behaviour. Dividend Power’s June 2026 analysis described it as one of the simplest but most effective grocery budget tips: a visual calendar that helps prevent overspending and allows households to spread purchases more strategically throughout the month.The budget calendar works by assigning spending to specific days and weeks rather than treating the month as a single undifferentiated period. A household with a $500 monthly grocery budget has approximately $125 per week. Knowing that the first week is a normal $125 shop, the second week needs to accommodate a dinner party, and the fourth week has a child’s birthday allows the household to pre-shift spending — buying more during weeks one and three to reduce the fourth-week bill.
What to track on the budget calendar:
- Planned shopping days: scheduling grocery trips on specific days each week rather than shopping whenever the pantry runs low. Fewer trips means fewer impulse purchases.
- Weekly spending targets: each week’s planned allocation from the monthly budget, adjusted for known variations (guests, celebrations, paydays).
- Upcoming sales cycles: noting when the regular store’s sale cycle resets (usually weekly for fresh items, bi-weekly for meat) allows strategic timing of larger purchases.
- Actual spending: recording the actual spend after each trip. The comparison between planned and actual is where control is exercised.
Step 4: Meal Plan Around Sales, Not Cravings
Meal planning is consistently identified across consumer research and financial guidance as one of the highest-impact grocery saving strategies available. GOBankingRates’ March 2026 analysis cited USDA data: meal planning is one of the best ways to save money. The rationale is twofold: it prevents impulse purchases by making the list a firm constraint, and it eliminates the pattern of buying ingredients for a recipe and then not using all of them before they spoil.The most budget-effective form of meal planning is the reverse-engineering approach: check the week’s grocery sales circular first, identify the proteins, produce, and staples at their lowest price this week, and build the week’s meals around those items. This is the opposite of the typical sequence, which starts with deciding what to eat and then shopping for the ingredients regardless of price. Benjamin Lorr, author of The Secret Life of Groceries, told AARP: ‘Reverse-engineering your meals is a great way to save money.’
Practical meal planning discipline:
- Write the list before leaving home: the list is not a suggestion. Adding nothing to the cart that is not on the list is the single most effective way to prevent impulse purchases.
- Plan for leftovers deliberately: cook slightly more than needed for each dinner and plan for those leftovers to become the following day’s lunch. This reduces both food waste and the pressure to buy deli or packaged lunch foods.
- Plan 5 of 7 dinners: planning every single meal for the week creates rigidity that most households cannot maintain. Planning five dinners leaves flexibility for one spontaneous meal and one leftover or pantry meal, which is more sustainable and still captures most of the saving.
Step 5: Switch Stores — The Single Biggest Lever
The most impactful statement in Wealthvieu’s July 2026 grocery budget analysis is also the most counterintuitive: the biggest single lever for most people is switching stores, not coupon clipping or budgeting apps. Store-switching alone saves more than every other strategy combined.This finding is supported by multiple independent data sources. Consumer Reports’ price comparison research found that Aldi and Lidl are more than 8 percent cheaper than Walmart on a comparable basket. PocketGuard’s 2026 analysis put Aldi 20 percent cheaper overall. Aldi itself reported gaining 19 million new shoppers in 2025 as budget-conscious households shifted their primary grocery store. NPR’s May 2026 reporting on discount grocery growth found that shoppers are voting with their feet: stores known for lower prices are gaining market share at a rate that has not been seen since the Great Recession.
The practical store-switching framework:
- Identify your highest-spend categories: for most households, this is proteins (meat, poultry, fish), dairy, and packaged staples. These are the categories where the discount store price differential is largest and the quality difference is smallest.
- Run a trial comparison shop: for one month, do a secondary ‘staples run’ at Aldi or Lidl for canned goods, dairy, eggs, frozen vegetables, and store-brand pantry items. Compare the receipt to what you would have paid at your regular supermarket for the same items.
- Consider a two-store strategy: most households that switch partially to discount stores end up maintaining their regular supermarket for fresh meat on sale, specialty items, and the familiarity of their preferred produce section. This hybrid approach captures most of the discount-store savings without requiring a complete change.
- Warehouse clubs for bulk non-perishables: Costco, Sam’s Club, and BJ’s offer 20 to 40 percent per-unit savings on non-perishable staples — rice, pasta, coffee, canned goods, paper products, and bulk proteins that can be portioned and frozen.
Step 6: Understand What You Should Actually Be Spending
One of the reasons that grocery spending feels out of control for many households is the absence of a concrete reference point. Without knowing what a nutritious grocery budget should cost for a household of your size, in your region, at your life stage, it is impossible to determine whether your spending is high, reasonable, or even below average.Source: USDA Food Plans (approximate 2026 monthly figures). Plans are adjusted monthly; verify current amounts at USDA.gov. The Moderate-Cost plan is the most widely cited financial benchmark for middle-income households. If your spending is significantly above the Liberal plan for your household type, there is likely meaningful room for savings. If you are at or below the Thrifty plan, you may want to check whether you qualify for SNAP.
Nasdaq’s 2026 analysis added important geographic context: if you live in Hawaii, Alaska, or coastal California, your grocery bill will be significantly above these USDA benchmarks regardless of shopping behaviour. Households in the South and Midwest typically come in at or below the moderate benchmark. Geography is one of the biggest drivers of grocery cost, and the USDA plans are national averages.
Step 7: Cut Food Waste — The ‘Hidden’ Grocery Bill
Food waste is the grocery expense that never appears on any receipt but appears on every month’s spending total nonetheless. The USDA’s data is stark: the average American family of four loses approximately $1,500 per year on uneaten food. The average household wastes approximately 30 percent of the food it buys. Reducing food waste is, as Family Credit’s June 2026 guide described it, ‘essentially free savings, since you’ve already paid for the food.’The behaviours most consistently cited by households who have successfully reduced food waste:
- The fridge audit before shopping: looking at what is already in the refrigerator and planning at least one or two meals around those items before writing the shopping list. This prevents the common pattern of buying new ingredients while identical ingredients already in the fridge are aging toward the bin.
- FIFO (First In, First Out): positioning older items at the front of shelves and the refrigerator and newer items at the back ensures that older food is used before it spoils. This simple habit applied consistently reduces dairy and produce waste significantly.
- Freezing before the spoil point: bread, meat, cheese, and most cooked meals can be frozen before they spoil. Developing the automatic habit of freezing items two to three days before their likely spoil date converts potential waste into future meals.
- The leftover rule: as the Front Yard Veggies March 2026 personal finance account noted, the average household wastes nearly 30 percent of the food it buys. A rule that requires making it a rule to open leftovers before opening anything new reduces this significantly.
Step 8: Know What Is Getting Cheaper in 2026
Grocery inflation is not a uniform tax on the entire basket. Some categories are experiencing genuine price relief in 2026, and knowing which they are allows households to shift toward cheaper categories and away from more expensive ones without any sacrifice in nutritional quality.Eggs: the best-value protein story of 2026
Egg prices rose sharply in 2022 through 2025 due to repeated outbreaks of Highly Pathogenic Avian Influenza (HPAI) that reduced flock sizes. The CDC reports that more than 169 million birds have been affected since 2022. But as flocks recover, prices are falling dramatically. USDA data cited by Sophie’s Mart in July 2026 shows retail egg prices in June 2026 were 27.9 percent lower than in June 2025. Farm-level egg prices were 83.3 percent lower. The USDA forecasts a 30.7 percent full-year decline in 2026. For any household that reduced egg consumption due to price pressure, now is the time to lean back in. Eggs are among the most affordable, nutritionally complete, versatile, and quick-to-prepare foods available in any supermarket.Fruits and vegetables: some relief
LendEDU’s January 2026 analysis noted that fruits and vegetables as a category were down 3.1 percent from the prior year at that point. The USDA’s fresh fruit forecast of approximately 2.0 percent for full year 2026 represents one of the more modest inflation rates in the entire food basket. Potatoes — up only 1.4 percent year-over-year — remain one of the best-value starchy carbohydrates available and one of the most budget-efficient foods per calorie per dollar in the entire store.Take Control: Build meals around eggs as a primary protein source at least three times per week. An egg-based dinner (frittata, shakshuka, fried rice with egg, egg and vegetable hash) costs $2 to $4 to produce per serving — a fraction of the equivalent beef-based meal at current beef prices. The nutritional profile of eggs is exceptional per dollar spent.
Step 9: Navigate the Highest-Inflation Categories
The reverse of Step 8: knowing which categories to route around is as valuable as knowing which are getting cheaper. In 2026, four categories stand out for the severity of their price increases and the availability of alternatives:Beef: +12% and concentrated pressure
Beef prices are forecast to rise more than 12 percent in 2026 according to USDA and Due.com’s June 2026 analysis, with some estimates as high as 16.6 percent. The US cattle herd is at its smallest in decades, yet demand remains high. NPR’s May 2026 What’s Eating America series examined this directly, noting that both structural supply constraints and sustained consumer demand are keeping prices elevated with no near-term relief expected. The most effective response is not to stop eating protein but to substitute: chicken thighs, ground pork, canned fish, eggs, and legumes all provide equivalent or superior protein nutrition at a fraction of current beef prices.Coffee: +12.9 to 20%
Coffee prices have risen 12.9 to 20 percent year-over-year depending on the source and the category (whole bean, ground, pod). The primary drivers are supply chain pressures, weather events in producing countries, and tariff effects on imported goods. Practical responses: switch to store-brand ground coffee (quality has improved significantly across major discount store own-brands); reduce pod coffee in favour of drip or French press (the per-cup cost of pods is three to five times higher than equivalent ground coffee); or reduce overall coffee quantity and supplement with other hot beverages.Fresh lettuce and salad greens: +32.1%
The 32.1 percent year-over-year increase in retail lettuce prices (WonderHowTo/USDA ERS, August 2026) is one of the most acute single-category price shocks in 2026. The most straightforward response: substitute cabbage (up only modestly) for lettuce in salads and slaws; use frozen spinach in cooked applications; buy romaine or iceberg over premium greens such as arugula, spring mix, and baby spinach that carry a higher price premium per serving.Packaged snacks: the highest-markup category
Chips and packaged snacks are identified by Front Yard Veggies’ March 2026 personal finance analysis as among the highest-markup items in any grocery store. They are also highly vulnerable to shrinkflation — the practice of reducing package size while maintaining the retail price. A household that spends $30 per week on packaged snacks is spending $1,560 per year on a category where the markup to the producer’s cost is highest and the nutritional return per dollar is lowest. Substituting whole-food snacks — fruit, nuts, cheese, eggs, crackers with peanut butter — reduces both the cost and the markup.Step 10: Check If You Qualify for Food Assistance (SNAP)
The most powerful tool available to qualifying households for managing high grocery costs is the Supplemental Nutrition Assistance Program (SNAP). Many Americans who qualify for SNAP do not know they are eligible, and many eligible households who know about the programme have not applied.SNAP facts for 2026 (NCOA and USDA):
- Eligibility: gross monthly income at or below 130 percent of the federal poverty level. For a single adult in 2026, this is approximately $1,632 per month (approximately $19,584 per year). For a household of four, the income threshold is approximately $3,354 per month.
- Average benefit for a one-person senior household: $188 per month (approximately $6.16 per day). This covers a significant proportion of a Thrifty Food Plan-level grocery budget for a single adult.
- SNAP is fully funded through September 2026: the NCOA and other organisations confirmed that full SNAP funding was restored following the resolution of the government shutdown. Benefits continue to be paid at full levels through September 2026.
- What SNAP covers: fruits, vegetables, meat, poultry, fish, dairy products, breads and cereals, and seeds and plants that produce food for the household. It does not cover alcohol, tobacco, vitamins, or hot prepared foods.
- How to apply: online at benefits.gov or through your state’s SNAP agency. NCOA’s BenefitsCheckUp tool at benefitscheckup.org helps older adults identify all federal and state benefits they may qualify for.
Take Control: Even if you are not sure you qualify for SNAP, apply. Eligibility calculations can be complex, and many households find they qualify at income levels higher than they expected. Applying costs nothing, and even a partial SNAP benefit of $50 to $100 per month meaningfully offsets grocery inflation.
The USDA Food Plans: Full Reference Table
The USDA’s four Food Plans serve as the most authoritative national benchmarks for grocery spending at different budget levels. They are used by financial planners, SNAP benefit calculators, and household budgeting tools. Here is the full reference matrix for 2026:All figures are approximate for 2026 and are updated monthly by USDA. Verify current amounts at ers.usda.gov/data-products/food-price-outlook. The Thrifty Plan is the basis for SNAP benefit calculations. The Moderate Plan is the most commonly cited financial planning benchmark. The Liberal Plan represents a varied, convenient diet with minimal price sensitivity.
How Much Control Do Americans Actually Have? The Research
The FMI – Food Industry Association and Hartman Group’s research found that 83 percent of Americans feel they have at least some control over their grocery spending. The research also found that 79 percent of shoppers report their primary grocery store does an excellent job of meeting their needs. These figures coexist with the stress data because they reflect different aspects of the same experience: grocery shopping is stressful AND consumers feel empowered to respond.Wealthvieu’s July 2026 analysis took this further with a specific quantification: most single adults can cut $100 to $200 per month from their grocery bill without significantly changing what they eat. For a household of four, the equivalent figure is typically $200 to $400 per month achievable through strategic store switching, meal planning, and waste reduction alone.
101 Financial’s May 2026 guide made the systemic point: grocery spending is often a symptom of a broader cash flow picture that lacks visibility. You cannot fix what you cannot see clearly. For households where grocery spending feels uncontrollable, the first intervention is almost always measurement: tracking what is actually being spent for 30 consecutive days. The tracking itself changes behaviour — households that know they are tracking spend differently from households that are shopping on autopilot.
The Six Common Budget-Wrecking Mistakes
Understanding what undermines grocery budget control is as valuable as knowing what strengthens it. The six most common mistakes identified across current research:- Shopping hungry: Family Credit’s June 2026 guide identified shopping on an empty stomach as one of the most reliable predictors of overspending. When hungry, impulse control is lower and every high-calorie, convenient food seems more attractive. A simple rule — always eat before shopping — prevents a reliable category of overspending.
- Treating the monthly food budget as a single undifferentiated pool: without weekly sub-targets, households often overspend in the first three weeks and are forced to severely restrict in the fourth. A budget calendar with weekly allocations prevents this pattern.
- Ignoring the unit price in favour of the sticker price: larger packages are usually cheaper per unit but not always. Promotional pricing on mid-size packages sometimes creates exceptions. The unit price on the shelf label is the only reliable comparison tool.
- Confusing food stress with food overspending: some households spend far below the USDA Moderate benchmark and still feel stressed by grocery costs, because the stress is about overall budget pressure rather than specifically grocery inefficiency. Checking spending against the USDA benchmarks clarifies whether the problem is the grocery budget or the broader household budget.
- Not checking SNAP eligibility: many households whose income qualifies them for SNAP have never applied. The assumption that ‘SNAP is for people much worse off than us’ is one of the most expensive unfounded beliefs in household finance.
- Restaurant and delivery spending invisibility: lumping restaurant, takeout, and delivery spending with ‘food’ makes it impossible to see where food money is actually going. Separating food-at-home from food-away-from-home is always the first step toward understanding the actual grocery budget.
Conclusion
Grocery prices are 24 to 28 percent higher than they were five years ago. The USDA projects they will rise another 3.2 percent in 2026, with beef up 12 percent and coffee up 20 percent. These are forces outside any individual household’s control. They are the conditions under which the shopping trip happens. They are not the determinant of what the receipt says at the end.The receipt is determined by where you shop, what you put in the cart, how much of it you actually eat, and what you paid per unit for each item. These are the variables within your control. Eighty-three percent of Americans recognise this. The ten steps in this guide show exactly how to exercise that control: building a budget, using the USDA benchmarks, creating a calendar, planning meals around sales, switching to discount stores, reducing waste, taking advantage of what is getting cheaper, routing around what is most expensive, and checking food assistance eligibility.
None of these steps requires deprivation or a dramatic change in what your household eats. Due.com’s June 2026 analysis framed the strategy perfectly: ‘The families who eat well on a tight budget are not buying worse food — they are planning better, wasting less, and cooking more.’ The checkout line is where control is exercised. The preparation for it is where it is built.
Frequently Asked Questions
How much should I be spending on groceries in 2026?The USDA publishes monthly Food Plans at four budget levels. The Moderate-Cost Plan — the most widely cited financial benchmark — suggests approximately $362/month for a single adult (19–50), approximately $724/month for a couple, and approximately $1,163/month for a family of four with school-age children. Wealthvieu’s July 2026 analysis suggests keeping grocery spending under 10–15% of take-home pay as a financial health guideline. Spending above 15% typically means food costs are crowding out savings or debt repayment. Verify current USDA figures at USDA.gov, as plans are updated monthly.
How do I create a grocery budget that actually works?
Start by establishing a specific monthly spending target using the USDA Food Plans as your benchmark. Track actual spending against that target for 30 days using any tool (spreadsheet, envelope, app). Separate food-at-home from restaurant/delivery spending. Review mid-month to allow course-correction. The tracking habit itself changes behaviour: most households discover $50–$150/month in spending they did not know was occurring once they begin actively measuring. A budget calendar with weekly sub-targets prevents the pattern of overspending early in the month.
Is store-switching really the best strategy?
According to Wealthvieu’s July 2026 analysis, switching stores is the biggest single lever available to most shoppers — more impactful than coupon clipping, rebate apps, or brand switching alone. Consumer Reports found Aldi and Lidl more than 8% cheaper than Walmart on a comparable basket. PocketGuard put Aldi 20% cheaper overall. Aldi gained 19 million new shoppers in 2025. A practical two-store approach — buying staples at Aldi or Lidl and specialty items at a preferred supermarket — captures most of the savings without requiring a complete change in shopping behaviour.
Who qualifies for SNAP in 2026?
SNAP eligibility is based primarily on household income. Gross monthly income must be at or below 130% of the federal poverty level: approximately $1,632/month ($19,584/year) for a single adult in 2026, and approximately $3,354/month for a household of four. SNAP is fully funded through September 2026. The average benefit for a one-person senior household is $188/month. To check eligibility and apply, visit benefits.gov or use the NCOA BenefitsCheckUp tool at benefitscheckup.org. Many households who qualify for SNAP have never applied, assuming they do not meet the income threshold.
What grocery categories are actually getting cheaper in 2026?
Eggs are the standout: the USDA forecasts a 30.7% full-year price decline in 2026, with June 2026 retail prices already 27.9% below June 2025 levels. Farm-level egg prices dropped 83.3% year-over-year in June 2026 as flocks recover from avian flu outbreaks. Fresh fruits are forecast to rise only about 2% for the full year, one of the lower inflation rates in the food basket. Potatoes are up only 1.4% year-over-year. These are the categories to lean into while shifting spending away from beef (+12%) and coffee (+12–20%).
How much can I realistically save by taking control of my grocery budget?
Wealthvieu’s July 2026 analysis estimates most single adults can cut $100–$200/month from their grocery bill without significantly changing what they eat. For a family of four, the equivalent figure is $200–$400/month achievable through strategic store switching, meal planning, and waste reduction alone. Individual results vary significantly by current spending levels, household size, geographic location, and which strategies are implemented. The USDA’s family-of-four food waste estimate of $1,500/year alone represents a starting point for savings that costs nothing to realise except better planning and storage habits.
0 Comments
Be the first to share your thoughts on this article.