
Investing
Oil Near $100? How a Pipeline Yield Differs From a Producer.

Brent about $118.70 on Oct 30, about $97 on Nov 5 (−18%), about $100–$103 on Nov 6; WTI about $87–$92; a 12% weekly drop for both, the biggest since the pandemic by one report; Brent finished January at $70.69 and is about 54% above a year ago; drivers: the Iran conflict, tanker attacks near the Strait of Hormuz, and hopes of de-escalation. Enterprise Products Partners, Q3 2026 (Oct 29): revenue $17.95 billion (+49.3%); adjusted EBITDA $2.8 billion (+16%); operational distributable cash flow $2.3 billion (+27%), 1.9x coverage; record pipeline volumes 14.8 million barrels a day (+7%); Permian plant inlet volumes +12%; leverage 2.9x; distribution $0.56 a quarter (+2.8%), about $2.24 a year; yield about 5.7%–6.0%. My arithmetic: revenue grew about 1.8 times as fast as cash flow, showing it is driven by commodity prices; a hypothetical producer selling a million barrels earns $118.7 million at Brent’s October 30 level and $70.7 million at January’s price (−40%) while a $2-a-barrel pipeline fee stays at $2 million if volumes hold; coverage of 1.9x means cash flow could fall about 47% before the payout was uncovered; $10,000 at a 6.0% yield earns about $600 a year.
That is the idea behind a recent Motley Fool piece arguing that the best energy stock with oil near $105 is not an oil producer but a pipeline company, Enterprise Products Partners, which yields about 6%. I want to test that idea with the data instead of repeating it. This guide covers what oil has done, how pipeline economics differ from a producer’s, what Enterprise’s latest quarter shows, where the risks still sit and how to think about the choice. It is not a recommendation.
The longer view is just as dramatic. Brent finished January at $70.69 and reached a four-year high of $126 at some point this year, according to a chronology of oil markets, and is about 54% above a year ago. From January’s level to $100 is a rise of about 41%; from $100 back to January’s level would be a fall of about 29%. An 18% fall in about a week is what volatility looks like, and it is why some investors want income that does not depend on the price.
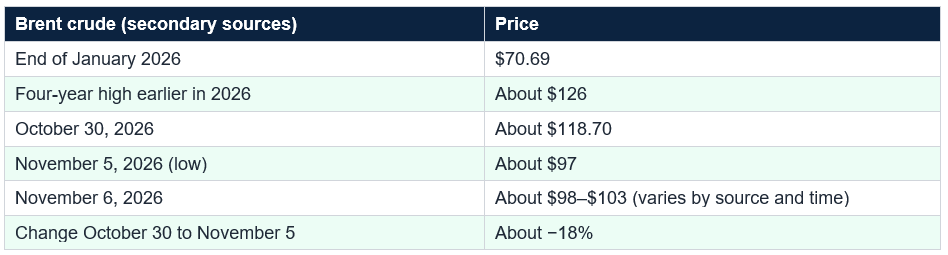
Brent: about $118.70 on Oct 30, about $97 on Nov 5 (−18%), about $100–$103 on Nov 6; WTI about $87–$92. Both fell about 12% for the week. Brent finished January at $70.69 and is about 54% above a year ago. Drivers: the Iran conflict, tanker attacks near the Strait of Hormuz and hopes of de-escalation.
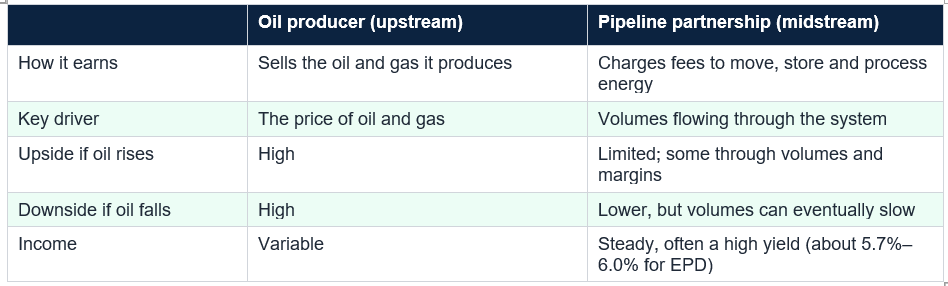
That distinction is what the Fool article is about: midstream businesses charge fees for the use of their assets, so the volume flowing through their systems is more important than the price of what is being moved. The price of oil still matters indirectly, since high prices encourage drilling, which fills pipelines, but the link is looser. It helps to picture a toll road: the operator earns when cars use it, not by the price of the goods inside.
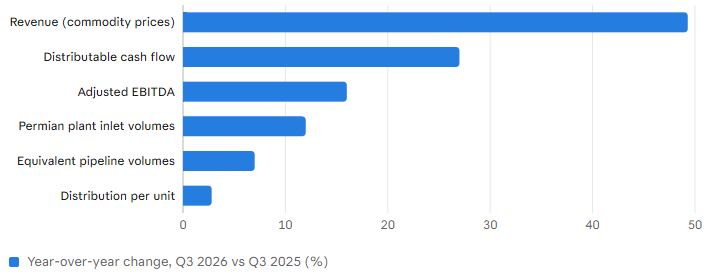
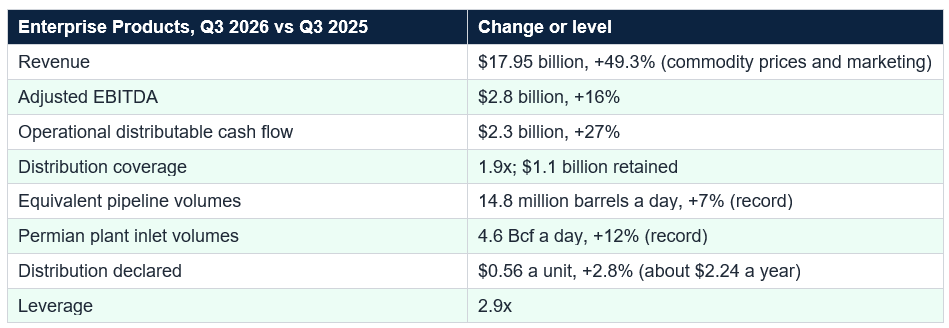
Now compare the headline numbers. Revenue was $17.95 billion, up 49.3% from a year ago, but that was mostly higher commodity prices and marketing sales, which do not translate fully into profit, since the cost of sales rises too. In my arithmetic, revenue grew about 1.8 times as fast as cash flow, which is the point: cash flow tracked volumes, not prices. The partnership declared a distribution of $0.56 a unit, up 2.8%, about $2.24 a year, and leverage held at 2.9 times. Over the last 12 months it returned $5.3 billion to investors through distributions and buybacks, a 54% payout of adjusted cash flow.
Contracts reinforce the stability. In my general knowledge, which I did not retrieve in detail, many midstream agreements include minimum volume commitments, so customers pay whether or not they ship. Enterprise’s results show a record 8.2 Bcf a day of fee-based natural gas processing volumes. So Enterprise’s reported cash flow is not tied to a week like this one, though its unit price can still react, since units trade on sentiment too, and I did not retrieve how EPD moved this week.
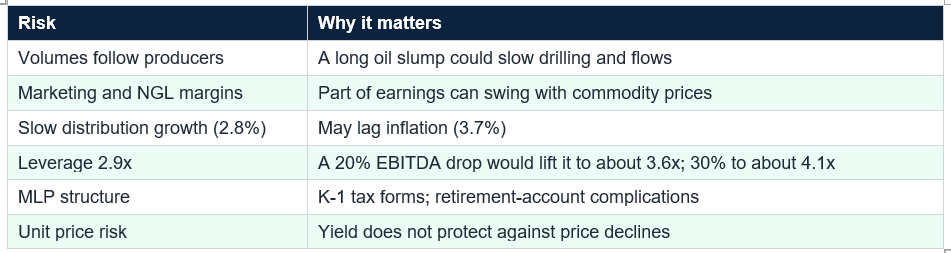
Other risks are structural. The units are those of a master limited partnership, which generally issue a Schedule K-1 and can complicate taxes and retirement accounts, which I note from general knowledge. The distribution has grown slowly, 2.8% in the latest quarter, so it will not keep pace with a surge in inflation, which was 3.7% in September. Leverage of 2.9 times is moderate, but a 20% fall in EBITDA would lift it to about 3.6 times in my arithmetic, and a 30% fall to about 4.1. And a high yield can fall with the unit price: income is only part of the return.
Coverage gives a measure of the cushion. At 1.9 times, distributable cash flow could fall about 47% before it would no longer cover the distribution, in my arithmetic. If the distribution grows 2.8% a year, it would reach about $2.95 in 10 years from $2.24, which is a yield on today’s cost of about 7.9% if the unit price were unchanged, though prices rarely stand still. None of this guarantees anything: the distribution can be cut, and I cannot predict future payouts or prices.
Whichever you choose, do the basics. Read the latest results, check coverage and leverage, and keep the position to a size you can hold through a drop. Remember that the headline price of oil is only one input and that a stock that looks safe in a boom is tested in a bust. Be wary of buying any energy stock because oil is at a certain price: that is chasing. Decide first what job the holding does in your portfolio, and use sources, like the company’s own releases, that you can check.
A fee-based model reduces commodity risk; it does not remove market risk, distribution risk or the chance that volumes fall. A high yield is partly compensation for risk, and distributions are not guaranteed. Common mistakes include buying an energy stock because oil is at a certain price, assuming a pipeline has no commodity exposure, chasing the highest yield, ignoring leverage and coverage, overlooking the tax forms, putting too much in one sector and treating a headline price as current when it may be days old. Another is forgetting that this week’s oil swing, about 18% in six days, can reverse just as fast. Boring cash flow is often the point of a midstream holding, not a flaw.
But it is not a commodity-free bet. Volumes follow producers, marketing margins swing, the distribution grows only about 2.8% a year, the units carry K-1 paperwork and the unit price can fall like any stock. You give up much of the upside if oil keeps rising. Decide what you want from an energy holding, check the coverage and leverage yourself and size the position for a bad outcome. This is general education, not personalized investment advice, and I cannot predict oil prices or distributions.
Midstream companies such as Enterprise Products Partners mostly charge fees to move, store and process energy, so their income depends more on the volume flowing through their systems than on the price of what is moved. In the third quarter, Enterprise’s revenue rose about 49% on higher commodity prices while its distributable cash flow rose 27% on record volumes, which shows the difference. Less sensitive does not mean immune.
Is Enterprise Products Partners really free of commodity risk?
No. Its volumes depend on producers’ activity, which responds to prices over time, and it has marketing and NGL activities where margins can swing. One analysis noted that revenue beats driven by higher commodity prices can reverse quickly and do not necessarily flow through to distributable cash flow. A fair description is that it is far less exposed than a producer, not that it has none.
What is Enterprise’s yield and how safe is it?
Sources show about 5.7% to 6.0% depending on the date and unit price, based on a $0.56 quarterly distribution, or $2.24 a year. Distributable cash flow covered the distribution 1.9 times in the third quarter, leverage was 2.9 times and the partnership has raised its payout for 27 to 28 straight years, according to earlier reports. Distributions are never guaranteed, and I cannot predict future payouts.
Is oil really near $105?
It depends on the day and the benchmark. Brent reached about $118.70 on October 30, fell roughly 18% to about $97 on November 5 on hopes of easing in the Iran conflict, and rebounded to about $100 to $103 on November 6 after tanker attacks. WTI traded near $87 to $92. A headline price of $105 can be a day or two old, which is itself a sign of how volatile oil is.
Should I buy a pipeline stock instead of an oil producer?
That depends on your goals. A pipeline partnership offers income and lower commodity sensitivity but limited upside if oil keeps rising. A producer offers more upside from higher prices and more downside if they fall. Many investors hold neither individually and use diversified funds. Pipeline units also generate Schedule K-1 tax forms. This is general education, not personal advice.
Table of Contents
- Oil Is High, and So Is the Whiplash
- The Short Answer
- What Oil Actually Did
- Upstream, Midstream, Downstream
- Enterprise Products’ Third Quarter
- Why Fees Change the Equation
- The Risks That Remain
- The Yield Math
- Pipeline or Producer? How to Think About It
- Common Mistakes
- Conclusion
- Frequently Asked Questions
Enterprise Products Q3 2026: revenue follows prices, cash flow follows volumes (% change)
Change vs a year earlier (%) by Enterprise Products Partners Q3 2026 release (Oct 29) and earnings call, via company, Motley Fool, GuruFocus and Yahoo Finance; revenue growth of 49.3% is from GuruFocus
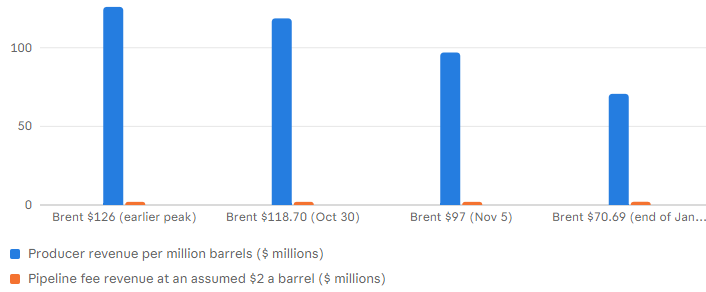
Why fees differ: hypothetical revenue on one million barrels at different oil prices ($ millions)
Revenue ($ millions) by Author's hypothetical illustration: the $2 a barrel fee is assumed, volumes held constant, no costs or hedges; producer revenue falls 40% from $118.70 to $70.69; the scales differ widely, so read the trend, not the size
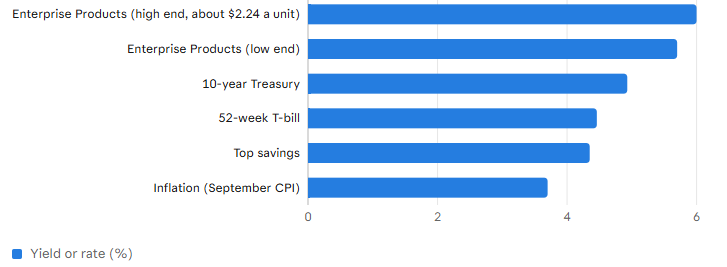
What the income looks like: Enterprise Products' yield vs. safer alternatives and inflation (%)
% by Motley Fool and GuruFocus (EPD yield 5.66%-6.0%, varies by date and unit price), The Mortgage Reports, MyMoneyBlog, Bankrate, First Trust; distributions are not guaranteed; unit prices can fallOil Is High, and So Is the Whiplash
When oil trades around $100 a barrel, owning an energy stock sounds like a no-brainer. It is also a little frightening, because a barrel that was $70 in January has been anywhere from $97 to nearly $119 in the past two weeks. The conflict involving Iran and attacks on tankers near the Strait of Hormuz have pushed prices up sharply and now, with hopes of de-escalation, down just as sharply. Anyone who bought a producer on a high day knows how quickly the mood can change.That is the idea behind a recent Motley Fool piece arguing that the best energy stock with oil near $105 is not an oil producer but a pipeline company, Enterprise Products Partners, which yields about 6%. I want to test that idea with the data instead of repeating it. This guide covers what oil has done, how pipeline economics differ from a producer’s, what Enterprise’s latest quarter shows, where the risks still sit and how to think about the choice. It is not a recommendation.
The Short Answer
A fee-based pipeline partnership earns most of its money from the volume it moves, not the price of the oil, so its cash flow is far steadier than a producer’s. Enterprise Products Partners illustrates this: in the third quarter its revenue rose about 49% on higher commodity prices, but its distributable cash flow rose 27% on record volumes, and it covered its distribution 1.9 times with leverage of 2.9 times. It yields about 5.7% to 6.0%. But it is not free of commodity risk, its units can fall, its distribution grows slowly and you give up much of the upside if oil keeps climbing. The trade is income and stability for less upside.
What Oil Actually Did
The details matter because the “oil near $105” in the headline was already stale when I checked. Brent crude, the international benchmark, was around $118.70 on October 30, according to Vantage, and fell to about $97 on November 5, a drop of about 18%, after the US midterm results lifted hopes of a settlement in the Middle East. Both Brent and WTI fell more than 8% on Wednesday to their lowest settlements in over two months. Then fresh attacks on tankers sent Brent back to about $100 to $103 on November 6, with WTI near $91. Both were on track for a weekly decline of about 12%, the biggest since the pandemic by one report.The longer view is just as dramatic. Brent finished January at $70.69 and reached a four-year high of $126 at some point this year, according to a chronology of oil markets, and is about 54% above a year ago. From January’s level to $100 is a rise of about 41%; from $100 back to January’s level would be a fall of about 29%. An 18% fall in about a week is what volatility looks like, and it is why some investors want income that does not depend on the price.
Brent: about $118.70 on Oct 30, about $97 on Nov 5 (−18%), about $100–$103 on Nov 6; WTI about $87–$92. Both fell about 12% for the week. Brent finished January at $70.69 and is about 54% above a year ago. Drivers: the Iran conflict, tanker attacks near the Strait of Hormuz and hopes of de-escalation.
Upstream, Midstream, Downstream
The energy sector splits into three parts. Upstream companies, the producers, explore for and pump oil and gas, so their revenue is volume times price, and when prices double or halve, so does much of their income. Downstream companies, the refiners and chemical makers, buy crude and sell products, so they earn the spread. Midstream companies, the pipelines, storage and processing, sit in between. They own the infrastructure that connects the two, and they mostly get paid for using it.That distinction is what the Fool article is about: midstream businesses charge fees for the use of their assets, so the volume flowing through their systems is more important than the price of what is being moved. The price of oil still matters indirectly, since high prices encourage drilling, which fills pipelines, but the link is looser. It helps to picture a toll road: the operator earns when cars use it, not by the price of the goods inside.
Enterprise Products’ Third Quarter
Enterprise Products Partners reported its third-quarter results on October 29, and they illustrate the model. Operational distributable cash flow rose 27% to $2.3 billion, which covered the distribution 1.9 times and left $1.1 billion to reinvest, repurchase units and reduce debt. Adjusted EBITDA rose 16% to $2.8 billion. Volumes hit records: equivalent pipeline volumes of 14.8 million barrels a day, up 7%, NGL pipeline volumes of 5.0 million barrels a day, up 6%, natural gas processing inlet volumes of 8.5 billion cubic feet a day and Permian plant inlet volumes of 4.6 billion cubic feet a day, up 12%.Now compare the headline numbers. Revenue was $17.95 billion, up 49.3% from a year ago, but that was mostly higher commodity prices and marketing sales, which do not translate fully into profit, since the cost of sales rises too. In my arithmetic, revenue grew about 1.8 times as fast as cash flow, which is the point: cash flow tracked volumes, not prices. The partnership declared a distribution of $0.56 a unit, up 2.8%, about $2.24 a year, and leverage held at 2.9 times. Over the last 12 months it returned $5.3 billion to investors through distributions and buybacks, a 54% payout of adjusted cash flow.
Why Fees Change the Equation
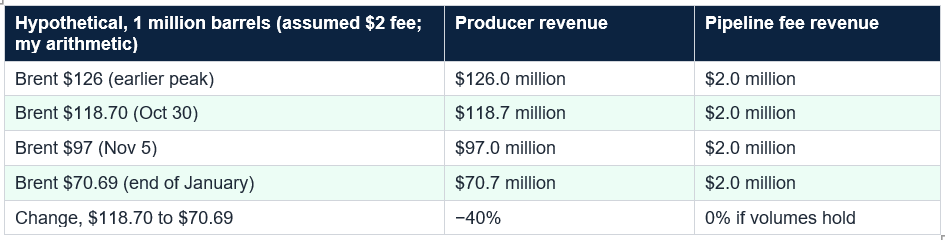
To see what fee-based means, here is a hypothetical. Imagine a producer that sells one million barrels, and a pipeline that charges $2 a barrel to move one million barrels. At Brent’s October 30 level of $118.70, the producer’s revenue is $118.7 million; at January’s $70.69 it is $70.7 million, a fall of 40%. The pipeline’s fee revenue is $2 million at either price, as long as the volume holds. The numbers are invented, and real producers have costs and hedges, but they capture why one earns on price and the other on throughput.Contracts reinforce the stability. In my general knowledge, which I did not retrieve in detail, many midstream agreements include minimum volume commitments, so customers pay whether or not they ship. Enterprise’s results show a record 8.2 Bcf a day of fee-based natural gas processing volumes. So Enterprise’s reported cash flow is not tied to a week like this one, though its unit price can still react, since units trade on sentiment too, and I did not retrieve how EPD moved this week.
The Risks That Remain
Fee-based does not mean risk-free. First, volumes depend on producers, and producers respond to prices. If oil fell sharply and stayed low, drilling would slow, and in time volumes could suffer. Second, Enterprise has marketing and NGL activities where margins can swing: one analysis cautioned that the revenue beat could reverse quickly and does not necessarily flow through to distributable cash flow, and that coverage is sensitive to processing and pipeline volumes. Third, geopolitics cuts both ways: disruptions in the Gulf could raise US export demand in my general understanding, but a broad energy shock could also hit economies and demand.Other risks are structural. The units are those of a master limited partnership, which generally issue a Schedule K-1 and can complicate taxes and retirement accounts, which I note from general knowledge. The distribution has grown slowly, 2.8% in the latest quarter, so it will not keep pace with a surge in inflation, which was 3.7% in September. Leverage of 2.9 times is moderate, but a 20% fall in EBITDA would lift it to about 3.6 times in my arithmetic, and a 30% fall to about 4.1. And a high yield can fall with the unit price: income is only part of the return.
The Yield Math
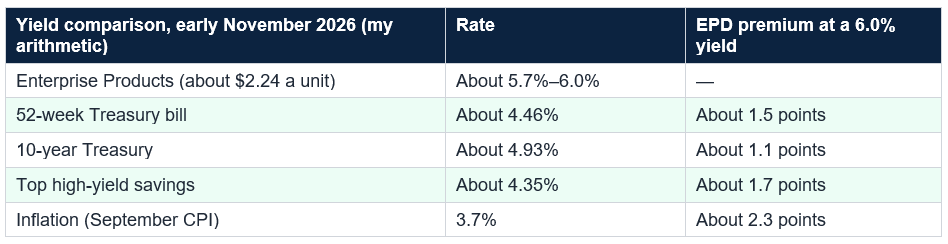
Sources show Enterprise yielding about 5.7% to 6.0%, depending on the date and the unit price, on a $2.24 annual distribution. At a 6.0% yield, $10,000 earns about $600 a year, and at 5.7% about $566, which is more than a 52-week Treasury bill at about 4.46%, the 10-year Treasury near 4.93% and top savings accounts at about 4.35%. In my arithmetic, a 6.0% yield is about 1.5 points above the T-bill and 1.1 above the 10-year. That premium is the pay for taking equity and unit-price risk.Coverage gives a measure of the cushion. At 1.9 times, distributable cash flow could fall about 47% before it would no longer cover the distribution, in my arithmetic. If the distribution grows 2.8% a year, it would reach about $2.95 in 10 years from $2.24, which is a yield on today’s cost of about 7.9% if the unit price were unchanged, though prices rarely stand still. None of this guarantees anything: the distribution can be cut, and I cannot predict future payouts or prices.
Pipeline or Producer? How to Think About It
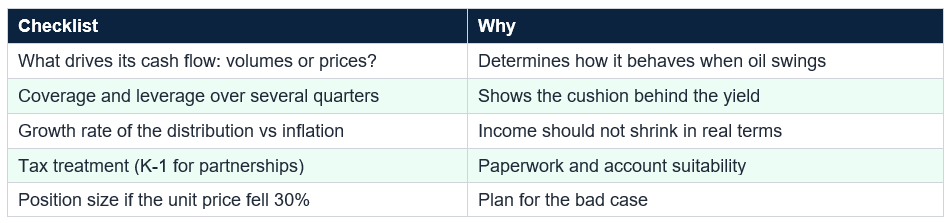
The right choice depends on what you want. If you want income and fewer sleepless nights, a fee-based midstream company fits better than a producer: its cash flow is steadier, its yield is higher than cash or bonds and it moves less with oil. If you want to bet that oil stays high or rises, a producer gives you leverage to prices, but you must be willing to see the stock fall when oil does, as it did this week. Neither is a sure thing. A third option is to own neither directly and hold diversified energy or broad market funds.Whichever you choose, do the basics. Read the latest results, check coverage and leverage, and keep the position to a size you can hold through a drop. Remember that the headline price of oil is only one input and that a stock that looks safe in a boom is tested in a bust. Be wary of buying any energy stock because oil is at a certain price: that is chasing. Decide first what job the holding does in your portfolio, and use sources, like the company’s own releases, that you can check.
A fee-based model reduces commodity risk; it does not remove market risk, distribution risk or the chance that volumes fall. A high yield is partly compensation for risk, and distributions are not guaranteed. Common mistakes include buying an energy stock because oil is at a certain price, assuming a pipeline has no commodity exposure, chasing the highest yield, ignoring leverage and coverage, overlooking the tax forms, putting too much in one sector and treating a headline price as current when it may be days old. Another is forgetting that this week’s oil swing, about 18% in six days, can reverse just as fast. Boring cash flow is often the point of a midstream holding, not a flaw.
Conclusion
With Brent swinging from about $118.70 to about $97 and back to roughly $100 in a single week, the case for owning energy through a fee-based pipeline instead of a producer is clear: the producer’s revenue rises and falls with the barrel, while the pipeline earns on throughput. Enterprise Products Partners’ third quarter shows it. Revenue rose about 49% on higher commodity prices, but distributable cash flow rose 27% on record volumes, covering its distribution 1.9 times with leverage of 2.9 times, and its roughly 5.7% to 6.0% yield sits well above cash and Treasuries.But it is not a commodity-free bet. Volumes follow producers, marketing margins swing, the distribution grows only about 2.8% a year, the units carry K-1 paperwork and the unit price can fall like any stock. You give up much of the upside if oil keeps rising. Decide what you want from an energy holding, check the coverage and leverage yourself and size the position for a bad outcome. This is general education, not personalized investment advice, and I cannot predict oil prices or distributions.
Frequently Asked Questions
Why would a pipeline stock be less sensitive to oil prices?Midstream companies such as Enterprise Products Partners mostly charge fees to move, store and process energy, so their income depends more on the volume flowing through their systems than on the price of what is moved. In the third quarter, Enterprise’s revenue rose about 49% on higher commodity prices while its distributable cash flow rose 27% on record volumes, which shows the difference. Less sensitive does not mean immune.
Is Enterprise Products Partners really free of commodity risk?
No. Its volumes depend on producers’ activity, which responds to prices over time, and it has marketing and NGL activities where margins can swing. One analysis noted that revenue beats driven by higher commodity prices can reverse quickly and do not necessarily flow through to distributable cash flow. A fair description is that it is far less exposed than a producer, not that it has none.
What is Enterprise’s yield and how safe is it?
Sources show about 5.7% to 6.0% depending on the date and unit price, based on a $0.56 quarterly distribution, or $2.24 a year. Distributable cash flow covered the distribution 1.9 times in the third quarter, leverage was 2.9 times and the partnership has raised its payout for 27 to 28 straight years, according to earlier reports. Distributions are never guaranteed, and I cannot predict future payouts.
Is oil really near $105?
It depends on the day and the benchmark. Brent reached about $118.70 on October 30, fell roughly 18% to about $97 on November 5 on hopes of easing in the Iran conflict, and rebounded to about $100 to $103 on November 6 after tanker attacks. WTI traded near $87 to $92. A headline price of $105 can be a day or two old, which is itself a sign of how volatile oil is.
Should I buy a pipeline stock instead of an oil producer?
That depends on your goals. A pipeline partnership offers income and lower commodity sensitivity but limited upside if oil keeps rising. A producer offers more upside from higher prices and more downside if they fall. Many investors hold neither individually and use diversified funds. Pipeline units also generate Schedule K-1 tax forms. This is general education, not personal advice.
0 Comments
Be the first to share your thoughts on this article.