
Investing
Is Procter & Gamble the Ultimate $1,000 Dividend Stock Now?!

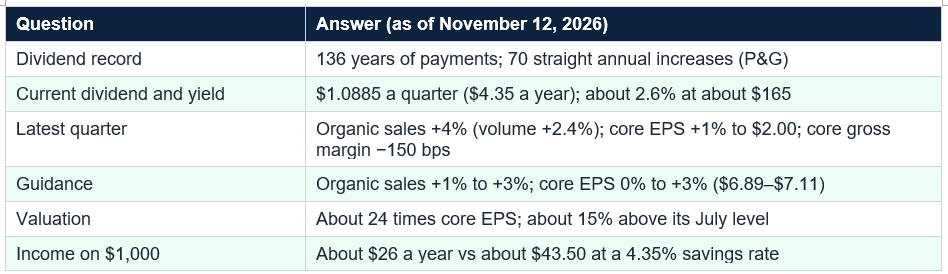
The dividend (P&G filings): 136 straight years of dividends and 70 straight annual increases; quarterly $1.0885 (up 3% from $1.0568), or $4.354 a year; up about 63% from $2.678 in 2016, a compound rate of about 5% a year; yield about 2.6% at about $165; payout about 63% of fiscal 2026 core EPS of $6.89 (my arithmetic). The quarter and guidance (fiscal Q1 2027, ended September 30): net sales $23.3 billion (+4%); organic sales +4% (volume +2.4%, mix +1.1%, price +0.4%); core EPS $2.00 (+1%); core gross margin −150 basis points; free cash flow $4.4 billion; fiscal 2027 core EPS growth guided to 0% to 3% ($6.89–$7.11) with a $0.79 per share cost headwind; about $15 billion to be returned to shareholders. My arithmetic: $1,000 buys about 6 shares paying about $26 a year versus about $43.50 in a 4.35% savings account; the dividend would overtake that cash interest in about 17 years at 3% growth or about 10 years at 5%; about 24 times core EPS; planned $15 billion of shareholder returns equals about 98% of trailing free cash flow of $15.3 billion.
That is a reasonable argument, and this guide tests it: what the dividend record really shows, how the latest quarter looked, what the stock costs relative to earnings, what $1,000 earns compared with a savings account and whether past performance, as the article’s subtitle suggests, indicates what is likely. I rely on P&G’s own releases where I can.
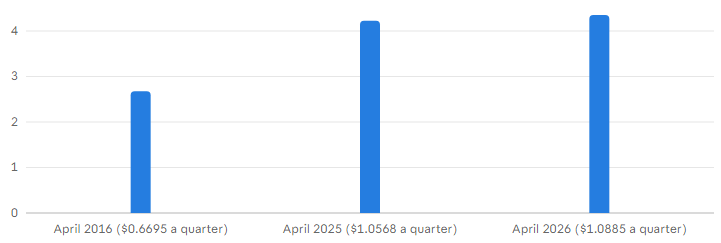
The growth rate is steady rather than spectacular. P&G’s April 2016 release shows a quarterly dividend of $0.6695 after its 60th consecutive increase, or $2.678 a year. In my arithmetic today’s $4.354 is about 63% higher, a compound rate of about 5% a year, in line with 4.9% over ten years on one data site. The latest raise, 3%, was smaller, and the Fool says it roughly matches the past decade’s growth, which does not quite match P&G’s own history (a discrepancy I flag). The payout is about 63% of fiscal 2026 core EPS of $6.89, versus over 70% expected in 2016.
P&G: dividends paid 136 straight years, raised 70 straight years; $1.0885 quarterly ($4.354 a year), up 3%; about 5% a year over ten years; payout about 63% of core EPS. Q1 FY27: net sales $23.3B (+4%), organic +4%, core EPS $2.00 (+1%), core gross margin −150 bps. FY27 core EPS guided 0%–3%; about $15B returned to shareholders.
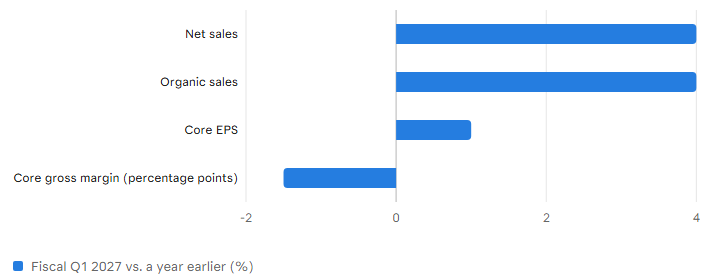
The weak spot is profitability. Core EPS rose only 1% and was flat in constant currency. Core gross margin fell 150 basis points despite 120 basis points of productivity savings, and core operating margin fell 80 basis points, as commodity costs and reinvestment outweighed savings: P&G sold more but kept less of each dollar. Free cash flow productivity was a strong 93%, free cash flow was $4.4 billion and the company returned $3.9 billion to shareholders ($2.6 billion of dividends, $1.3 billion of buybacks).
The company also closed a $3.9 billion all-cash acquisition of Thorne (a supplements company, general knowledge) on October 1, raising all-in sales guidance to 2% to 4%, per a secondary summary. Commodities are about three-quarters of the total headwind in my arithmetic. The key point is that the dividend grows about 3% to 5% while earnings are guided to grow 0% to 3%, so the payout ratio is edging up, which is manageable at about 63% but limits how fast the dividend can grow.
That is normal for a mature consumer company, and the dividend looks affordable. The buyback is more flexible than the dividend: if cash tightens, P&G can cut repurchases long before the payout, which it has not cut in 70 years. The Thorne deal and capital spending of 4.5% to 5.5% of sales add demands on cash, but with free cash flow productivity guided at 85% to 90% of earnings the dividend is not under obvious strain
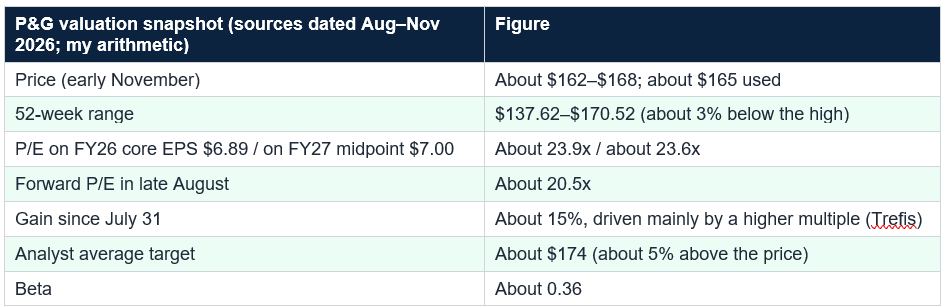
Analysts remain positive: the average target is about $174, roughly 5% above the price, and BofA raised its target to $185, per one data site. Consumer staples also surged more than 11% in October as investors looked beyond the AI trade, per CNBC, so some of P&G’s strength reflects a defensive rotation that could reverse. A beta of about 0.36 means the stock tends to move less than the market, but a high multiple on 0% to 3% earnings growth leaves limited room for disappointment.
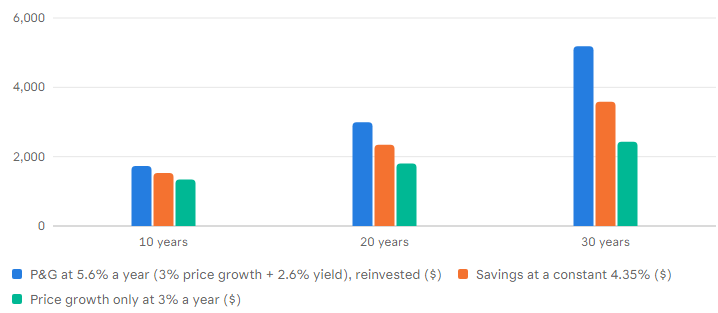
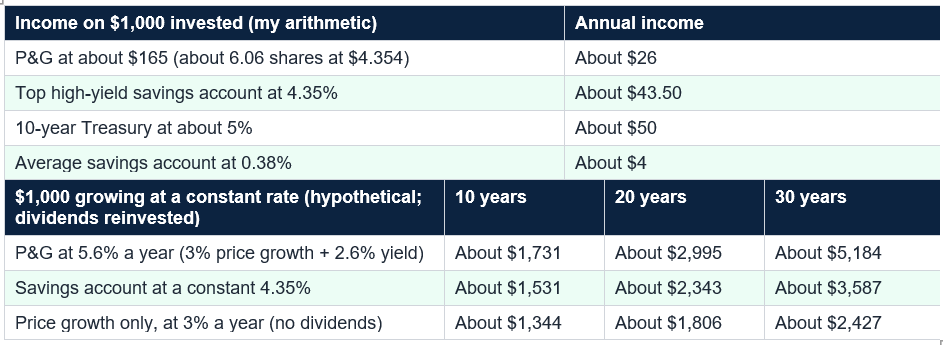
How long would the growing dividend take to catch up with cash? In my arithmetic, if the dividend grew 3% a year and a savings account paid a constant 4.35%, it would overtake the savings interest in about 17 years, or about 10 years at 5% growth, ignoring share price changes; savings rates will not stay constant, of course. Reinvested at a total return of about 5.6% a year (3% price growth plus the 2.6% yield), $1,000 would grow to about $1,731 in 10 years, $2,995 in 20 and $5,184 in 30, against $1,531, $2,343 and $3,587 at a constant 4.35%, all hypothetical.
A company can keep raising its dividend and still be a mediocre investment if you pay too much. In late 2024 P&G’s valuation was above 26 times earnings, a peak the multiple has since moved well off, per the Fool. A 70-year record tells you about the dividend, not the price you will pay for it: past performance indicates reliability, and is a poor guide to returns from a particular starting price.
Several events will give more information. P&G’s Investor Day presentation will be webcast on November 19, 2026, and the next quarterly report is expected in January. Investors will watch whether organic growth stays within or above the 1% to 3% guidance, whether margins stabilize and whether Thorne adds to growth, and the April dividend decision, which P&G has announced in April in recent years, will show whether the raise stays near 3%. A dividend can be cut in a crisis, even by a strong company, though P&G has never done so in its 70-year streak.
A long dividend record does not guarantee a future raise or a good return from today’s price. P&G’s yield is about 2.6%, below savings and Treasury rates, its margins are under pressure and the stock has risen about 15% since July. Never invest money you may need soon.
Also consider the price you pay. Some investors build positions gradually rather than all at once after a rally, and others wait for a lower multiple; neither is right for everyone, and I cannot say which is better. What matters is that the position is small enough that a 20% decline would not alter your plans and that you hold it for years, not weeks. Staples have been steady, but they have also had long stretches of flat prices.
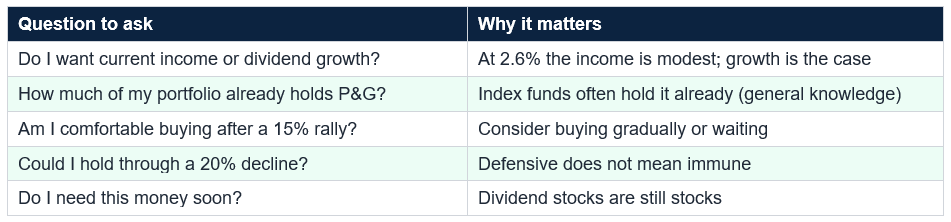
Compare your current savings rate with P&G’s 2.6% yield, then decide what role you want it to play: a growing income stream over decades, or a defensive holding. Check P&G’s Investor Day on November 19 before deciding. Common mistakes include assuming a long dividend streak guarantees a good return, ignoring valuation, chasing a stock after a 15% rally, comparing a 2.6% yield with savings without considering growth, overlooking that index funds already hold it and assuming the dividend can never be cut. “Ultimate” is also an opinion, not a fact.
So is it the ultimate dividend stock to buy with $1,000? It is a high-quality, low-volatility holding with a remarkable record, but at about $165 the yield is about 2.6%, below the 4.35% on top savings accounts, and $1,000 buys about 6 shares paying about $26 a year; the dividend would take roughly 10 to 17 years to overtake savings interest in my arithmetic. The answer depends on your goals, time horizon and the price you pay. Check current data and keep the position sized sensibly.
Procter & Gamble has paid a dividend for 136 consecutive years since its 1890 incorporation and has increased it for 70 consecutive years, according to its own July 2026 release. That makes it a Dividend King, a company with at least 50 straight years of increases. The quarterly dividend is $1.0885, up 3% from $1.0568 in April 2026, or about $4.35 a year.
What is P&G’s dividend yield now?
About 2.6% to 2.7%, depending on the day’s price, which has been roughly $162 to $168 since the October earnings report. That is below the 4.35% on top high-yield savings accounts and the roughly 5% yield on the 10-year Treasury in my earlier research. P&G’s appeal is growth: the dividend rose about 5% a year over the last decade, from P&G’s own releases, though the latest raise was 3%.
Is the P&G dividend safe?
It looks well covered by earnings: in my arithmetic the $4.35 dividend is about 63% of fiscal 2026 core earnings per share of $6.89. But P&G plans to return about $15 billion in fiscal 2027, over $10 billion of dividends and about $5 billion of buybacks, which is close to its trailing free cash flow of about $15.3 billion. Margins are under pressure from commodity costs. Dividends are never guaranteed, though the 70-year record is strong. This is general education, not personal advice.
Is P&G stock expensive?
It is not cheap. At roughly $165 it trades at about 24 times trailing core earnings, against about 20.5 times forward in August, according to Yahoo Finance data. Most of the roughly 15% rise since July came from a higher multiple, not higher earnings, per a Trefis analysis. Fiscal 2027 core EPS is guided to grow 0% to 3%, so the valuation leaves limited room for disappointment. Analysts’ average target is about $174.
What does $1,000 buy and earn?
At about $165, $1,000 buys about 6 shares, which pay about $26 a year in dividends at the current rate, compared with about $43.50 in a 4.35% savings account. In my arithmetic, the dividend would take about 17 years to overtake that cash interest if it grew 3% a year, or about 10 years at 5%, ignoring price changes and the fact that savings rates vary. The decision depends on your goals and time horizon.
Table of Contents
- The Claim
- The Short Answer
- The Dividend Record
- What the Latest Quarter Shows
- Guidance and the Cost Headwind
- Cash Flow and Shareholder Returns
- Valuation: Not Cheap
- What $1,000 Actually Earns
- Does Past Performance Predict Future Results?
- Risks and What to Watch
- How a $1,000 Investor Might Think About It
- Common Mistakes
- Conclusion
- Frequently Asked Questions
70 years of raises: P&G's annual dividend per share, 2016 vs. 2025 vs. 2026 ($)
Annual dividend per share ($) by P&G SEC filings and the Q1 FY27 release: quarterly dividends annualized by the author; about +63% over the decade (about 5% a year); the latest raise was 3%; 136 straight years of dividends and 70 str
Sales up, profit barely: P&G fiscal Q1 2027 (% change vs. a year earlier; margin change in points)
Change (% or percentage points) by P&G earnings release, October 22, 2026: net sales +4%, organic +4% (volume +2.4%, mix +1.1%, price +0.4%), core EPS +1% (flat in constant currency), core gross margin down 150 basis points (shown as -
Hypothetical growth of $1,000 over 10, 20 and 30 years ($)
Value of $1,000 ($) by Author's hypothetical arithmetic with constant assumptions (not a forecast): P&G's total return of about 5.6% assumes 3% price growth plus the 2.6% yield reinvested; savings assume a constant 4.35%, w
The Claim
Some stocks are so familiar they become clichés, and Procter & Gamble is one. The maker of Tide, Pampers, Gillette and Charmin has raised its dividend every year for 70 years, and a Motley Fool article published November 12 calls it the ultimate dividend stock to buy with $1,000. The article admits the yield is only respectable, about 2.6%, and the stock is not dirt cheap, but argues that quality and dividend pedigree make it worth the price.That is a reasonable argument, and this guide tests it: what the dividend record really shows, how the latest quarter looked, what the stock costs relative to earnings, what $1,000 earns compared with a savings account and whether past performance, as the article’s subtitle suggests, indicates what is likely. I rely on P&G’s own releases where I can.
The Short Answer
P&G is one of the most reliable dividend payers in the market, but “ultimate” depends on what you want. It has paid dividends for 136 years and raised them for 70, the dividend is about 63% of earnings and organic sales grew 4% last quarter with volume leading. But core EPS grew only 1%, margins are under pressure from $1.4 billion of after-tax commodity costs, the stock has risen about 15% since July mostly through a higher multiple and the 2.6% yield is well below the 4.35% on a top savings account. In my arithmetic $1,000 buys about 6 shares paying about $26 a year: a quality, low-volatility holding at a full price, not a bargain.
The Dividend Record
The record is what makes P&G special. In its July 2026 dividend announcement the company said it has paid a dividend for 136 consecutive years since its 1890 incorporation and increased it for 70 consecutive years. That makes it a Dividend King (50 or more straight years of increases), and the Fool notes it is one of only five companies in the world with a 70-year streak. The quarterly dividend is $1.0885, raised 3% in April from $1.0568, or $4.354 a year.The growth rate is steady rather than spectacular. P&G’s April 2016 release shows a quarterly dividend of $0.6695 after its 60th consecutive increase, or $2.678 a year. In my arithmetic today’s $4.354 is about 63% higher, a compound rate of about 5% a year, in line with 4.9% over ten years on one data site. The latest raise, 3%, was smaller, and the Fool says it roughly matches the past decade’s growth, which does not quite match P&G’s own history (a discrepancy I flag). The payout is about 63% of fiscal 2026 core EPS of $6.89, versus over 70% expected in 2016.
P&G: dividends paid 136 straight years, raised 70 straight years; $1.0885 quarterly ($4.354 a year), up 3%; about 5% a year over ten years; payout about 63% of core EPS. Q1 FY27: net sales $23.3B (+4%), organic +4%, core EPS $2.00 (+1%), core gross margin −150 bps. FY27 core EPS guided 0%–3%; about $15B returned to shareholders.
What the Latest Quarter Shows
P&G’s fiscal first quarter, ended September 30 and reported October 22, was better than the headline in some ways and worse in others. Net sales rose 4% to $23.3 billion and organic sales, which exclude currency and acquisitions, also grew 4%, with every category and region growing. The quality of growth improved: volume rose 2.4%, mix 1.1% and price only 0.4%, against fiscal 2026, when organic growth was just 1% and came from price and mix. Core EPS of $2.00 beat the $1.89 estimate.The weak spot is profitability. Core EPS rose only 1% and was flat in constant currency. Core gross margin fell 150 basis points despite 120 basis points of productivity savings, and core operating margin fell 80 basis points, as commodity costs and reinvestment outweighed savings: P&G sold more but kept less of each dollar. Free cash flow productivity was a strong 93%, free cash flow was $4.4 billion and the company returned $3.9 billion to shareholders ($2.6 billion of dividends, $1.3 billion of buybacks).
Guidance and the Cost Headwind
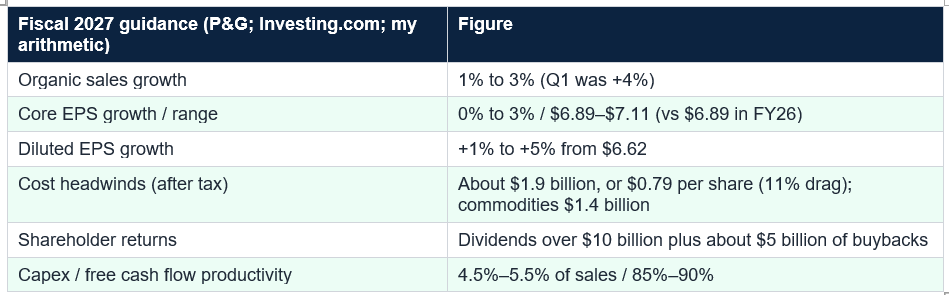
P&G kept its fiscal 2027 guidance but made the road harder. It expects organic sales growth of 1% to 3% (Q1’s 4% ran ahead of the range) and core EPS growth of 0% to 3%, or $6.89 to $7.11 per share, with diluted EPS up 1% to 5% from $6.62. But it raised its after-tax commodity cost headwind from about $1.0 billion to $1.4 billion, and with foreign exchange, higher interest expense and lower non-operating income the total is about $1.9 billion, or $0.79 per share, an 11% drag on core EPS growth, up from $0.56 and 8% in July.The company also closed a $3.9 billion all-cash acquisition of Thorne (a supplements company, general knowledge) on October 1, raising all-in sales guidance to 2% to 4%, per a secondary summary. Commodities are about three-quarters of the total headwind in my arithmetic. The key point is that the dividend grows about 3% to 5% while earnings are guided to grow 0% to 3%, so the payout ratio is edging up, which is manageable at about 63% but limits how fast the dividend can grow.
Cash Flow and Shareholder Returns
The dividend is funded by cash. P&G generated $19.6 billion of operating cash flow in fiscal 2026, and trailing free cash flow is about $15.3 billion, per one data site. For fiscal 2027 it plans over $10 billion of dividends and about $5 billion of buybacks, about $15 billion in total: about 98% of trailing free cash flow in my arithmetic, with the dividend alone about 65%. The company is returning nearly all its free cash, and while it can also borrow, there is little cushion if earnings fall short.That is normal for a mature consumer company, and the dividend looks affordable. The buyback is more flexible than the dividend: if cash tightens, P&G can cut repurchases long before the payout, which it has not cut in 70 years. The Thorne deal and capital spending of 4.5% to 5.5% of sales add demands on cash, but with free cash flow productivity guided at 85% to 90% of earnings the dividend is not under obvious strain
Valuation: Not Cheap
The Fool admits the stock is not dirt cheap, and the numbers agree. P&G traded near $165 in early November, up from $143.54 at the end of July, a gain of about 15%, which a Trefis analysis attributes mostly to a roughly 20.6% rise in the P/E multiple rather than earnings growth. In my arithmetic $165 is about 23.9 times fiscal 2026 core EPS and 23.6 times the guidance midpoint of $7.00, against a forward multiple of about 20.5 in late August, and about 3% below the $170.52 52-week high.Analysts remain positive: the average target is about $174, roughly 5% above the price, and BofA raised its target to $185, per one data site. Consumer staples also surged more than 11% in October as investors looked beyond the AI trade, per CNBC, so some of P&G’s strength reflects a defensive rotation that could reverse. A beta of about 0.36 means the stock tends to move less than the market, but a high multiple on 0% to 3% earnings growth leaves limited room for disappointment.
What $1,000 Actually Earns
At about $165, $1,000 buys about 6 shares (6.06 with fractional shares), which pay about $26 a year at the current $4.354 rate. A top high-yield savings account at about 4.35% would earn about $43.50 on the same $1,000, and the 10-year Treasury at about 5% would pay about $50, though savings rates vary and Treasuries carry price risk if sold early. P&G offers less income today in exchange for dividend growth and potential price gains.How long would the growing dividend take to catch up with cash? In my arithmetic, if the dividend grew 3% a year and a savings account paid a constant 4.35%, it would overtake the savings interest in about 17 years, or about 10 years at 5% growth, ignoring share price changes; savings rates will not stay constant, of course. Reinvested at a total return of about 5.6% a year (3% price growth plus the 2.6% yield), $1,000 would grow to about $1,731 in 10 years, $2,995 in 20 and $5,184 in 30, against $1,531, $2,343 and $3,587 at a constant 4.35%, all hypothetical.
Does Past Performance Predict Future Results?
The article’s subtitle says past performance is no guarantee but a pretty good indication of what to expect from P&G. For the dividend that is fair: 70 straight increases signal management’s priorities and the business’s resilience, and it has paid through 26 recessions, per the Fool. For the stock price it is less clear, because returns depend on the starting valuation: P&G rose about 14.5% over 12 months against 13.4% for the S&P 500 (Trefis), but most of the recent jump came from a higher multiple, which does not repeat by itself.A company can keep raising its dividend and still be a mediocre investment if you pay too much. In late 2024 P&G’s valuation was above 26 times earnings, a peak the multiple has since moved well off, per the Fool. A 70-year record tells you about the dividend, not the price you will pay for it: past performance indicates reliability, and is a poor guide to returns from a particular starting price.
Risks and What to Watch
The risks are real, though mild. Costs come first: commodity prices, currency and interest expense are squeezing margins, and a further rise could pressure core EPS, guided to grow 0% to 3%. Competition is another, with rivals and private-label brands fighting for price-aware shoppers (P&G’s price growth was only 0.4%). And with the 10-year Treasury yield near 5%, a 2.6% dividend yield has to compete with safer income, which can weigh on high-multiple dividend stocks.Several events will give more information. P&G’s Investor Day presentation will be webcast on November 19, 2026, and the next quarterly report is expected in January. Investors will watch whether organic growth stays within or above the 1% to 3% guidance, whether margins stabilize and whether Thorne adds to growth, and the April dividend decision, which P&G has announced in April in recent years, will show whether the raise stays near 3%. A dividend can be cut in a crisis, even by a strong company, though P&G has never done so in its 70-year streak.
A long dividend record does not guarantee a future raise or a good return from today’s price. P&G’s yield is about 2.6%, below savings and Treasury rates, its margins are under pressure and the stock has risen about 15% since July. Never invest money you may need soon.
How a $1,000 Investor Might Think About It
If you are considering P&G with $1,000, a few points help. A single stock is a concentrated bet, even a defensive one, so many investors hold it alongside broad index funds. Consider whether you want income now or dividend growth over decades: at 2.6% the income is modest, and the case rests on reinvesting dividends and on 3% to 5% annual raises, which many brokers’ reinvestment plans can automate. A tax-advantaged account can simplify taxes (general knowledge).Also consider the price you pay. Some investors build positions gradually rather than all at once after a rally, and others wait for a lower multiple; neither is right for everyone, and I cannot say which is better. What matters is that the position is small enough that a 20% decline would not alter your plans and that you hold it for years, not weeks. Staples have been steady, but they have also had long stretches of flat prices.
Compare your current savings rate with P&G’s 2.6% yield, then decide what role you want it to play: a growing income stream over decades, or a defensive holding. Check P&G’s Investor Day on November 19 before deciding. Common mistakes include assuming a long dividend streak guarantees a good return, ignoring valuation, chasing a stock after a 15% rally, comparing a 2.6% yield with savings without considering growth, overlooking that index funds already hold it and assuming the dividend can never be cut. “Ultimate” is also an opinion, not a fact.
Conclusion
Procter & Gamble has paid dividends for 136 years and raised them for 70 straight, with a quarterly payout of $1.0885, about $4.35 a year, roughly 63% of earnings and growing about 5% a year over the last decade. The latest quarter showed 4% organic growth led by volume, but core EPS rose only 1%, core gross margin fell 150 basis points and the company faces a $0.79 per share cost headwind in fiscal 2027, with core EPS guided to grow 0% to 3%. The stock has risen about 15% since July mostly through a higher multiple and trades near 24 times core earnings.So is it the ultimate dividend stock to buy with $1,000? It is a high-quality, low-volatility holding with a remarkable record, but at about $165 the yield is about 2.6%, below the 4.35% on top savings accounts, and $1,000 buys about 6 shares paying about $26 a year; the dividend would take roughly 10 to 17 years to overtake savings interest in my arithmetic. The answer depends on your goals, time horizon and the price you pay. Check current data and keep the position sized sensibly.
Frequently Asked Questions
How long has P&G raised its dividend?Procter & Gamble has paid a dividend for 136 consecutive years since its 1890 incorporation and has increased it for 70 consecutive years, according to its own July 2026 release. That makes it a Dividend King, a company with at least 50 straight years of increases. The quarterly dividend is $1.0885, up 3% from $1.0568 in April 2026, or about $4.35 a year.
What is P&G’s dividend yield now?
About 2.6% to 2.7%, depending on the day’s price, which has been roughly $162 to $168 since the October earnings report. That is below the 4.35% on top high-yield savings accounts and the roughly 5% yield on the 10-year Treasury in my earlier research. P&G’s appeal is growth: the dividend rose about 5% a year over the last decade, from P&G’s own releases, though the latest raise was 3%.
Is the P&G dividend safe?
It looks well covered by earnings: in my arithmetic the $4.35 dividend is about 63% of fiscal 2026 core earnings per share of $6.89. But P&G plans to return about $15 billion in fiscal 2027, over $10 billion of dividends and about $5 billion of buybacks, which is close to its trailing free cash flow of about $15.3 billion. Margins are under pressure from commodity costs. Dividends are never guaranteed, though the 70-year record is strong. This is general education, not personal advice.
Is P&G stock expensive?
It is not cheap. At roughly $165 it trades at about 24 times trailing core earnings, against about 20.5 times forward in August, according to Yahoo Finance data. Most of the roughly 15% rise since July came from a higher multiple, not higher earnings, per a Trefis analysis. Fiscal 2027 core EPS is guided to grow 0% to 3%, so the valuation leaves limited room for disappointment. Analysts’ average target is about $174.
What does $1,000 buy and earn?
At about $165, $1,000 buys about 6 shares, which pay about $26 a year in dividends at the current rate, compared with about $43.50 in a 4.35% savings account. In my arithmetic, the dividend would take about 17 years to overtake that cash interest if it grew 3% a year, or about 10 years at 5%, ignoring price changes and the fact that savings rates vary. The decision depends on your goals and time horizon.
0 Comments
Be the first to share your thoughts on this article.