

Investing
The 10-5-3 Rule: How to Use It to Estimate Investing Returns

10% from stocks, 5% from bonds, 3% from cash a year. Long-run data (Wells Fargo Investment Institute via Kiplinger): large-cap stocks 10.5% annualized 1926–2025, long-term Treasury bonds 5%, T-bills 3.3%; SPY about 11% over the past 20 years; DALBAR: average investor 6.8% vs 10.2% over 30 years. Today (early November 2026): 52-week T-bill about 4.46%; top savings 4.35%; 10-year Treasury about 4.93%; inflation 3.7%; Shiller CAPE above 41; SPY −18.2% in 2022; 27 bear markets since 1928 averaging a 35% loss. My arithmetic: a 60/30/10 portfolio expects 7.8% under the rule (doubling in about 9.2 years); $500 a month for 30 years grows to about $716,000 at 7.8% vs about $502,000 if stocks earn 7% (portfolio 6.0%); at 3.7% inflation the rule’s real returns are about 6.1% (stocks), 1.3% (bonds) and −0.7% (cash).
A Rule of Thumb Worth Understanding
Investing is full of rules of thumb, and most are better at sounding wise than helping. The 10-5-3 rule is different in one respect: it is simple enough to use in your head and specific enough to be useful. It says that over the long term you can expect roughly 10% a year from stocks, 5% from bonds and 3% from cash. With those three numbers you can estimate what a portfolio might earn, how long it might take to double and how much you would need to save to reach a goal.
It is also easy to misuse. Treat the numbers as promises and you will be disappointed. Treat them as a starting point that you stress-test, and they become a decent planning tool. This guide explains what the rule says, where the numbers come from, how to apply it step by step and how it holds up against today’s yields and inflation, and it is candid about where it breaks down.

A common mix-up is worth flagging. One site describes the rule as suggesting an allocation of 10% to cash, 5% to bonds and 3% to commodities. That is not how the rule is generally explained, and the numbers do not describe weights at all. They describe expected returns. Your allocation, how much you hold in each, is a separate decision that depends on your goals, your time horizon and how much loss you can tolerate. The rule helps you see what each choice might earn, not what to choose.
That is nearly a century of history, including the Great Depression, wars, high inflation and several bull markets. It is also a single country’s experience, the United States, which was an unusually successful market, a point I take up below. And the averages hide enormous variation: stocks have had years up more than 25% and years down more than 18%. The rule’s value is in the long-run central tendency, not in any given year, and it works best over horizons of 15 years or more.
Step two is to turn the return into dollars. In my arithmetic, $500 a month for 30 years grows to about $716,000 at 7.8%, about $564,000 at 6.6% and about $897,000 at 8.9%. Turn it around: to reach $1 million in 30 years you would need about $558 a month at 8.9%, $699 at 7.8% and $996 at 6.0%. Step three is to stress-test: lower the stock assumption to 7% and the 60/30/10 mix falls to 6.0%, and the same $500 a month grows to about $502,000, about $214,000 less. If your plan still works at the lower number, it is sturdier.
Under the rule, a 60/30/10 portfolio expects 7.8% a year, so $500 a month for 30 years grows to about $716,000. If stocks earn only 7% (portfolio 6.0%), the same savings reach about $502,000. $10,000 grows to about $67,300 at 10%, $26,500 at 5% and $18,100 at 3% over 20 years.
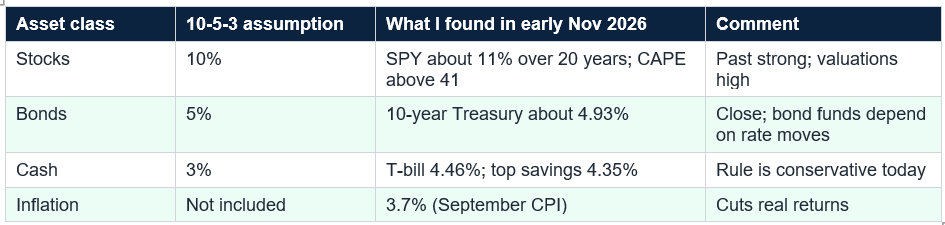
Bonds are the second. The rule assumes 5%, and the 10-year Treasury yield was near 4.93% at the end of October, so a new bond bought today could plausibly earn close to that if held to maturity. But existing bond funds have often earned less when rates rose, because prices fall as yields climb. Stocks are the third. SPY’s roughly 11% over 20 years beats the rule’s 10%, but the Shiller CAPE was above 41 in early October, a measure of high valuations that does not predict a crash but suggests caution about extrapolating. A 60/30/10 portfolio using today’s cash and bond yields would expect about 7.9%, close to the 7.8% from the rule.
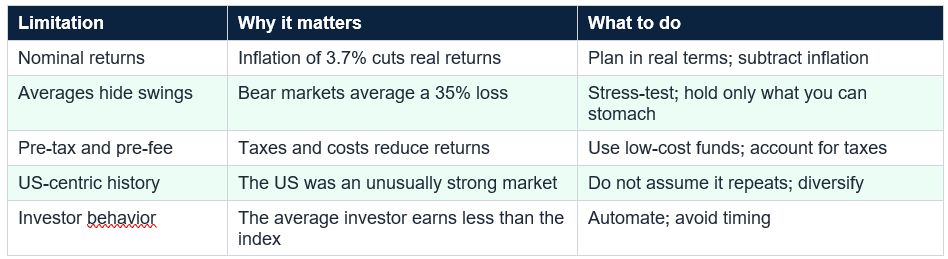
The second problem is that averages hide volatility. SPY lost 18.18% in 2022, QQQ lost 32.58%, and the 27 US bear markets since 1928 averaged a 35% decline, which needs a 54% gain to recover. A portfolio that averages 7.8% will not earn 7.8% in any given year, and the order of returns matters if you are withdrawing. The rule is also pre-tax and pre-fee, US-centric, based on index returns most investors do not fully capture, and DALBAR found the average investor earned 6.8% against 10.2% for the S&P 500. Use the rule as a ceiling for planning, not a floor.
The rule describes long-run averages, not guarantees. A portfolio can earn far less than the rule suggests for a decade, especially if you start when valuations are high.
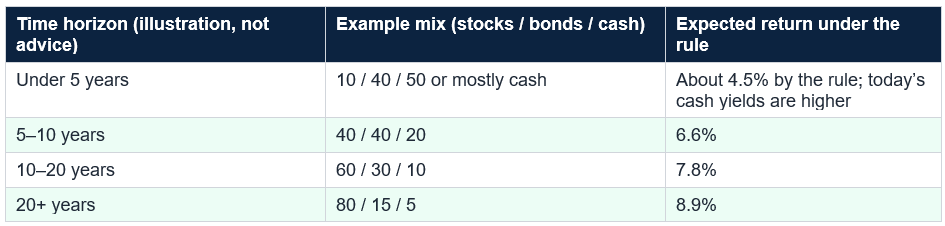
As an example, a person with 30 years until retirement might hold 80% in stocks, which the rule expects to earn 8.9% with bonds and cash, while someone five years from retirement might hold 40/40/20 for an expected 6.6% and much smaller swings. A near-term goal, such as a down payment, might sit mostly in cash and short-term bonds, where today’s 4.4% yields are comfortably above the rule’s 3%. The point is that lower expected returns are the price of lower risk, and you decide how much of each to buy.
This is the rule’s real use: it turns vague hopes into numbers, then shows how sensitive they are. A plan that works only if stocks earn 10% is fragile. A plan that still works at 7% has room for bad luck. Revisit the numbers each year, adjust your savings if returns disappoint and remember that your own saving rate usually matters more than the return assumption, especially in the early years.

Write down your portfolio weights, multiply by 10, 5 and 3 and then redo the sum with stocks at 7%. If your goal needs more saving at the lower return, you have just found your margin of safety. Common mistakes include treating the three numbers as guarantees, ignoring inflation, applying the 10% to a short-term goal, assuming the US result will repeat, forgetting taxes and fees, reading the rule as an allocation and failing to stress-test. Another is expecting your own results to match the index: behavior, timing and costs often cost investors a couple of points a year. The best use of the rule is to build a plan with room for lower returns and to keep investing through the swings.
Today the rule needs adjusting: cash yields about 4.4%, above its 3%, the 10-year Treasury is near 4.9%, inflation is 3.7% and valuations are high. Remember that the figures are nominal, that averages hide declines like 2022’s 18% and the 35% average bear market and that your own results depend on costs, taxes and behavior. In my example, stocks at 7% instead of 10% cut a $500-a-month plan from about $716,000 to $502,000. A plan that survives that is a good one. This is general education, not personalized advice.
It is a rule of thumb for long-term average annual returns: about 10% from stocks, 5% from bonds and 3% from cash and cash equivalents. It is meant to help you estimate what a portfolio might earn and plan how much to save, not to tell you what to buy. The figures are nominal, meaning before inflation, taxes and fees.
Where do the 10%, 5% and 3% come from?
They are rounded long-run US averages. According to Wells Fargo Investment Institute data cited by Kiplinger, large-cap stocks returned 10.5% annualized from 1926 through 2025, long-term Treasury bonds about 5% and short-term Treasury bills about 3.3%. They are averages over nearly a century, not forecasts for any particular decade.
Does the 10-5-3 rule still work in 2026?
As a rough guide, partly. Cash currently pays more than 3%, with top savings around 4.35% and a 52-week Treasury bill about 4.46%, and the 10-year Treasury yield was near 4.93%. Stocks returned about 11% a year over the past 20 years, but high valuations and future uncertainty mean many planners use lower stock assumptions. Inflation of 3.7% also cuts real returns.
How do I use the rule to estimate my portfolio’s return?
Multiply each asset class’s weight by its assumed return and add them up. A 60% stock, 30% bond and 10% cash portfolio gives 0.6 × 10 + 0.3 × 5 + 0.1 × 3 = 7.8% a year, which would double your money in about nine years by the rule of 72. Then test it with lower assumptions, since returns vary.
Is the 10-5-3 rule about how much to allocate?
No, though some websites describe it that way. The rule is about expected returns, not allocation percentages. Your allocation depends on your goals, time horizon and ability to tolerate losses. This is general education, not personal advice.
Table of Contents
- A Rule of Thumb Worth Understanding
- The Short Answer
- What the Rule Says (and a Common Mix-Up)
- Where the 10, 5 and 3 Come From
- How to Use It: Three Steps
- Testing the Rule Against Today
- Where the Rule Misleads
- Matching the Mix to Your Time Horizon
- A Worked Example
- Common Mistakes
- Conclusion
- Frequently Asked Questions
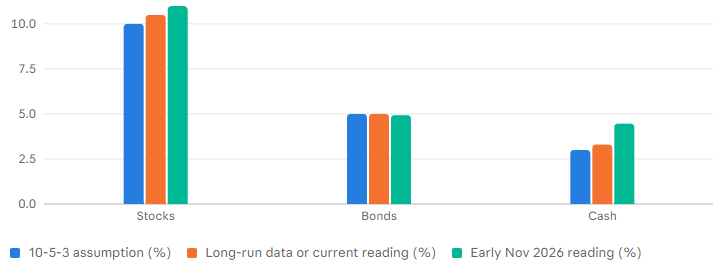
The rule vs. history vs. today: stocks, bonds and cash (% a year)
% a year by Wells Fargo Investment Institute (1926-2025); today: SPY 20-year return (Kiplinger), 10-year Treasury yield (Oct 30), 52-week T-bill (MyMoneyBlog); different measures, so indicative only.
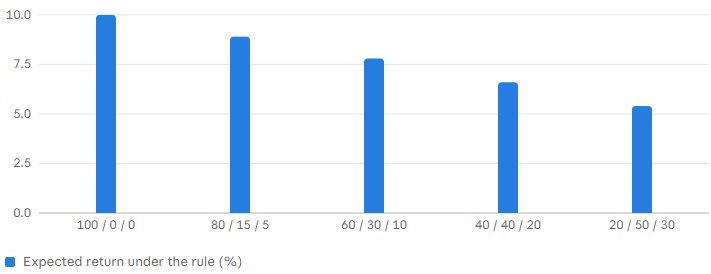
Expected return under the rule by portfolio mix (stocks / bonds / cash, %)
Expected return (% a year) by my arithmetic: weights x 10%, 5% and 3%; nominal returns before inflation, taxes and fees; not a forecast
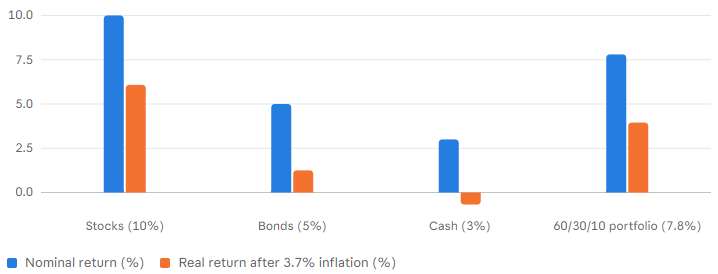
The catch: the rule's nominal returns vs. real returns after 3.7% inflation (%)
% a year by Author's arithmetic: (1 + nominal) / (1 + 3.7%) - 1; inflation per First Trust (September CPI); at the historical 3% inflation, real returns would be about 6.8%, 1.9% and 0%A Rule of Thumb Worth Understanding
Investing is full of rules of thumb, and most are better at sounding wise than helping. The 10-5-3 rule is different in one respect: it is simple enough to use in your head and specific enough to be useful. It says that over the long term you can expect roughly 10% a year from stocks, 5% from bonds and 3% from cash. With those three numbers you can estimate what a portfolio might earn, how long it might take to double and how much you would need to save to reach a goal.
It is also easy to misuse. Treat the numbers as promises and you will be disappointed. Treat them as a starting point that you stress-test, and they become a decent planning tool. This guide explains what the rule says, where the numbers come from, how to apply it step by step and how it holds up against today’s yields and inflation, and it is candid about where it breaks down.
The Short Answer
The 10-5-3 rule is a shorthand for long-run average annual returns: about 10% from stocks, 5% from bonds and 3% from cash and cash equivalents. You use it by multiplying each asset class’s share of your portfolio by its assumed return and adding the results. A 60% stock, 30% bond, 10% cash mix comes to 7.8% a year. The rule is useful for planning but imperfect: the numbers are nominal, US-centric averages that ignore inflation, taxes, fees and the wild swings along the way. Today cash yields more than 3%, inflation is 3.7% and stock valuations are high, so it pays to test the rule with lower assumptions.
What the Rule Says (and a Common Mix-Up)
The rule is about expected returns, not allocation. Kiplinger describes it as a guideline that assumes you can expect 10% from stocks, 5% from bonds and 3% from cash and cash equivalents such as Treasury bills and money market funds over the long term. FinHabits, TMX Money and Get Rich Slowly describe it the same way. The three numbers are rough averages meant for long horizons, and not one of those sources claims any particular year will match them.A common mix-up is worth flagging. One site describes the rule as suggesting an allocation of 10% to cash, 5% to bonds and 3% to commodities. That is not how the rule is generally explained, and the numbers do not describe weights at all. They describe expected returns. Your allocation, how much you hold in each, is a separate decision that depends on your goals, your time horizon and how much loss you can tolerate. The rule helps you see what each choice might earn, not what to choose.
Where the 10, 5 and 3 Come From
The numbers are rounded long-run US averages. According to Wells Fargo Investment Institute data cited by Kiplinger, large-cap stocks returned 10.5% annualized from 1926 through 2025, long-term Treasury bonds about 5% and short-term Treasury bills about 3.3%. Rounding 10.5% down to 10% builds in a little conservatism. Other data back up the stock figure: SPY returned about 11% a year over the past 20 years, according to Kiplinger, and the S&P 500 returned about 10.2% a year over 30 years in the DALBAR comparison.That is nearly a century of history, including the Great Depression, wars, high inflation and several bull markets. It is also a single country’s experience, the United States, which was an unusually successful market, a point I take up below. And the averages hide enormous variation: stocks have had years up more than 25% and years down more than 18%. The rule’s value is in the long-run central tendency, not in any given year, and it works best over horizons of 15 years or more.
How to Use It: Three Steps
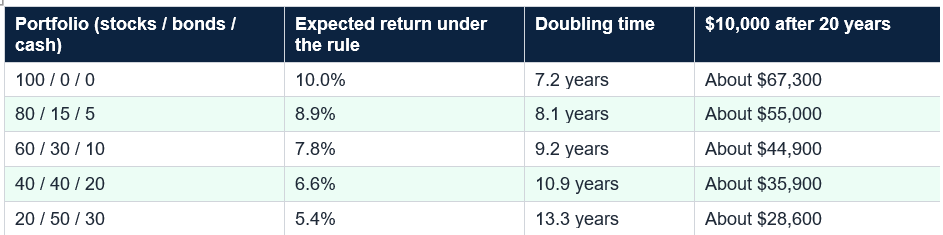
Step one is to estimate your portfolio’s return. Take your weights, multiply each by its assumed return and add. A 100% stock portfolio expects 10%. A 80/15/5 mix expects 0.8 × 10 + 0.15 × 5 + 0.05 × 3 = 8.9%. A 60/30/10 mix expects 7.8%, a 40/40/20 mix 6.6% and a 20/50/30 mix 5.4%. Then use the rule of 72 to estimate doubling time: divide 72 by the return. At 7.8%, money doubles in about 9.2 years; at 5.4%, about 13.3 years. The more you hold in bonds and cash, the slower the growth.Step two is to turn the return into dollars. In my arithmetic, $500 a month for 30 years grows to about $716,000 at 7.8%, about $564,000 at 6.6% and about $897,000 at 8.9%. Turn it around: to reach $1 million in 30 years you would need about $558 a month at 8.9%, $699 at 7.8% and $996 at 6.0%. Step three is to stress-test: lower the stock assumption to 7% and the 60/30/10 mix falls to 6.0%, and the same $500 a month grows to about $502,000, about $214,000 less. If your plan still works at the lower number, it is sturdier.
Under the rule, a 60/30/10 portfolio expects 7.8% a year, so $500 a month for 30 years grows to about $716,000. If stocks earn only 7% (portfolio 6.0%), the same savings reach about $502,000. $10,000 grows to about $67,300 at 10%, $26,500 at 5% and $18,100 at 3% over 20 years.
Testing the Rule Against Today
Cash is the first surprise. The rule assumes 3%, but in early November a 52-week Treasury bill yielded about 4.46% and top high-yield savings accounts paid about 4.35%, according to MyMoneyBlog and Bankrate. At 3%, $10,000 grows to about $13,400 in 10 years; at 4.46% it reaches about $15,500. Cash returns follow short-term interest rates, which have risen, so cash is currently more generous than the rule says, though that can change when rates fall. Cash was also the asset that lagged inflation in many years.Bonds are the second. The rule assumes 5%, and the 10-year Treasury yield was near 4.93% at the end of October, so a new bond bought today could plausibly earn close to that if held to maturity. But existing bond funds have often earned less when rates rose, because prices fall as yields climb. Stocks are the third. SPY’s roughly 11% over 20 years beats the rule’s 10%, but the Shiller CAPE was above 41 in early October, a measure of high valuations that does not predict a crash but suggests caution about extrapolating. A 60/30/10 portfolio using today’s cash and bond yields would expect about 7.9%, close to the 7.8% from the rule.
Where the Rule Misleads
The biggest limitation is inflation. The figures are nominal, so they do not account for the erosion of purchasing power. At 3.7% inflation, my arithmetic gives real returns of about 6.1% for stocks, 1.3% for bonds and minus 0.7% for cash, and a 60/30/10 portfolio’s 7.8% becomes about 4.0% real. Over history, inflation has been lower, near 3%, which would give real returns of about 6.8%, 1.9% and 0% for the three. Either way, cash at 3% merely holds its value, which is why TMX Money notes it provides stability, not growth.The second problem is that averages hide volatility. SPY lost 18.18% in 2022, QQQ lost 32.58%, and the 27 US bear markets since 1928 averaged a 35% decline, which needs a 54% gain to recover. A portfolio that averages 7.8% will not earn 7.8% in any given year, and the order of returns matters if you are withdrawing. The rule is also pre-tax and pre-fee, US-centric, based on index returns most investors do not fully capture, and DALBAR found the average investor earned 6.8% against 10.2% for the S&P 500. Use the rule as a ceiling for planning, not a floor.
The rule describes long-run averages, not guarantees. A portfolio can earn far less than the rule suggests for a decade, especially if you start when valuations are high.
Matching the Mix to Your Time Horizon
The rule helps you see the trade-off between growth and stability, and your time horizon should drive the mix. Money you need within five years does not belong in stocks, whatever 10% says, because a 35% decline may not recover in time. Money for goals 10 to 20 years away can carry a mix, and money for goals 20 years or more away can lean toward stocks. This is a general principle, and the percentages below are illustrations, not advice.As an example, a person with 30 years until retirement might hold 80% in stocks, which the rule expects to earn 8.9% with bonds and cash, while someone five years from retirement might hold 40/40/20 for an expected 6.6% and much smaller swings. A near-term goal, such as a down payment, might sit mostly in cash and short-term bonds, where today’s 4.4% yields are comfortably above the rule’s 3%. The point is that lower expected returns are the price of lower risk, and you decide how much of each to buy.
A Worked Example
Imagine a 35-year-old who wants $1 million at 65 and can save $700 a month. With a 60/30/10 mix, the rule gives 7.8% and $700 a month for 30 years grows to about $1.0 million, since $699 a month is what 7.8% requires. That sounds on track. Now stress-test it: if stocks earn only 7%, the portfolio earns 6.0% and the same $700 a month grows to about $703,000, falling short by almost $300,000. To close the gap, the person could save about $996 a month, work a few years longer or hold more stocks and accept more risk.This is the rule’s real use: it turns vague hopes into numbers, then shows how sensitive they are. A plan that works only if stocks earn 10% is fragile. A plan that still works at 7% has room for bad luck. Revisit the numbers each year, adjust your savings if returns disappoint and remember that your own saving rate usually matters more than the return assumption, especially in the early years.
Write down your portfolio weights, multiply by 10, 5 and 3 and then redo the sum with stocks at 7%. If your goal needs more saving at the lower return, you have just found your margin of safety. Common mistakes include treating the three numbers as guarantees, ignoring inflation, applying the 10% to a short-term goal, assuming the US result will repeat, forgetting taxes and fees, reading the rule as an allocation and failing to stress-test. Another is expecting your own results to match the index: behavior, timing and costs often cost investors a couple of points a year. The best use of the rule is to build a plan with room for lower returns and to keep investing through the swings.
Conclusion
The 10-5-3 rule is a handy shorthand: about 10% a year from stocks, 5% from bonds and 3% from cash. It reflects long-run US data, with Wells Fargo Investment Institute figures of 10.5% for large-cap stocks, about 5% for long-term Treasuries and 3.3% for T-bills from 1926 through 2025. Use it by weighting each return by your allocation, as in the 7.8% for a 60/30/10 mix, then convert it to dollars and stress-test it with lower stock returns.Today the rule needs adjusting: cash yields about 4.4%, above its 3%, the 10-year Treasury is near 4.9%, inflation is 3.7% and valuations are high. Remember that the figures are nominal, that averages hide declines like 2022’s 18% and the 35% average bear market and that your own results depend on costs, taxes and behavior. In my example, stocks at 7% instead of 10% cut a $500-a-month plan from about $716,000 to $502,000. A plan that survives that is a good one. This is general education, not personalized advice.
Frequently Asked Questions
What is the 10-5-3 rule?It is a rule of thumb for long-term average annual returns: about 10% from stocks, 5% from bonds and 3% from cash and cash equivalents. It is meant to help you estimate what a portfolio might earn and plan how much to save, not to tell you what to buy. The figures are nominal, meaning before inflation, taxes and fees.
Where do the 10%, 5% and 3% come from?
They are rounded long-run US averages. According to Wells Fargo Investment Institute data cited by Kiplinger, large-cap stocks returned 10.5% annualized from 1926 through 2025, long-term Treasury bonds about 5% and short-term Treasury bills about 3.3%. They are averages over nearly a century, not forecasts for any particular decade.
Does the 10-5-3 rule still work in 2026?
As a rough guide, partly. Cash currently pays more than 3%, with top savings around 4.35% and a 52-week Treasury bill about 4.46%, and the 10-year Treasury yield was near 4.93%. Stocks returned about 11% a year over the past 20 years, but high valuations and future uncertainty mean many planners use lower stock assumptions. Inflation of 3.7% also cuts real returns.
How do I use the rule to estimate my portfolio’s return?
Multiply each asset class’s weight by its assumed return and add them up. A 60% stock, 30% bond and 10% cash portfolio gives 0.6 × 10 + 0.3 × 5 + 0.1 × 3 = 7.8% a year, which would double your money in about nine years by the rule of 72. Then test it with lower assumptions, since returns vary.
Is the 10-5-3 rule about how much to allocate?
No, though some websites describe it that way. The rule is about expected returns, not allocation percentages. Your allocation depends on your goals, time horizon and ability to tolerate losses. This is general education, not personal advice.
0 Comments
Be the first to share your thoughts on this article.