
Savings
UK Energy Price Cap Predictions: What Comes Next?
Table of Contents
- The Number You Need to Know: Understanding the Two Cap Figures
- Confirmed Cap Levels and the Latest Forecasts
- What Drove the July 2026 Spike — and Why October May Ease
- What Could Change the Forecast Before October
- The Long-Run Outlook: Why Bills Will Stay Elevated
- What This Means for Households: Fixed vs Variable in July 2026
- Conclusion
- Frequently Asked Questions (FAQ)
- What is the energy price cap for October 2026?
- External References
The UK energy price cap rose 13% on 1 July 2026, the single largest quarterly increase since the energy crisis of 2022 — and the news about what comes next has just changed. Cornwall Insight, the independent forecasting firm whose quarterly predictions have historically come within a few pounds of Ofgem's confirmed figures, released an updated forecast on 30 June 2026 showing the October cap now expected to fall marginally, by approximately 0.5%, to around £1,654 per year under new Ofgem consumption assumptions. That modest improvement follows the announcement of a 60-day US-Iran ceasefire, which gave wholesale gas markets some breathing room after the spike that drove the July rise.
However, Cornwall Insight's Dr Craig Lowrey was unambiguous about what that breathing room means: 'The Iran ceasefire gave the markets some breathing room, but this is a pause, not a resolution to the conflict.' The Strait of Hormuz — the critical waterway through which a significant share of global LNG shipments must pass — remains only partially open, with conflicting reports about the timeline for full restoration of supply routes and patchy progress on peace talks. The October cap forecast may be slightly lower than July, but it remains dramatically higher than April, and the structural drivers that pushed it there have not been resolved.
This guide provides the most current, accurate picture of UK energy price cap predictions available as of early July 2026. It covers the confirmed quarterly history, the latest October 2026 forecast and the factors that could shift it before Ofgem's 26 August announcement, the long-run structural outlook, the critical TDCV measurement change that has caused widespread confusion about headline figures, and a practical decision framework for households choosing between variable and fixed tariffs in this uncertain environment.
The Number You Need to Know: Understanding the Two Cap Figures
Before examining the forecast data, it is essential to address the single most common source of confusion in current media coverage of the energy price cap: the existence of two different headline figures for the same Q3 2026 cap.From 1 July 2026, Ofgem changed its definition of a 'typical household' — the consumption benchmark used to calculate the annual headline figure — to reflect the fact that average UK household energy use has genuinely fallen in recent years. The old benchmark used 2,700 kWh of electricity and 11,500 kWh of gas per year; the new benchmark uses 2,500 kWh of electricity and 9,500 kWh of gas. The actual unit rates and standing charges set by the cap did not change. Only the assumed consumption level used to calculate a headline annual figure changed.
The result is two entirely different-sounding headline figures for exactly the same cap. Under old consumption assumptions: the Q3 2026 cap is £1,862 per year. Under new consumption assumptions: the same Q3 2026 cap is £1,663 per year. These are not two different caps — they are the same cap expressed against two different benchmark household sizes. The unit rate of 26.11p/kWh for electricity and 7.33p/kWh for gas is identical in both cases. Whether your household is 'typical' under the old or new benchmark has no bearing on what you pay — your actual bill depends entirely on your actual consumption multiplied by those unit rates, not on which benchmark Ofgem happened to pick.
How to use the right figure: When comparing energy prices over time, use the same set of consumption assumptions throughout. MoneySavingExpert uses the new (lower) TDCVs going forward, so headlines from MSE will reference £1,663 for Q3 2026. Some older articles and comparison sites still reference £1,862. Both are accurate under their respective assumptions; neither is wrong. When comparing a current fixed deal against the cap, your energy supplier's comparison tool will show both on the same basis, which is the most reliable way to assess whether a specific tariff is worth taking.
Confirmed Cap Levels and the Latest Forecasts
The table below presents the confirmed quarterly cap levels for 2026 to date alongside the latest Cornwall Insight forecasts for Q4 2026 and beyond. All figures use Ofgem's new Typical Domestic Consumption Values (TDCVs) of 2,500 kWh electricity and 9,500 kWh gas, except where noted. All figures are for direct debit customers paying a dual-fuel bill.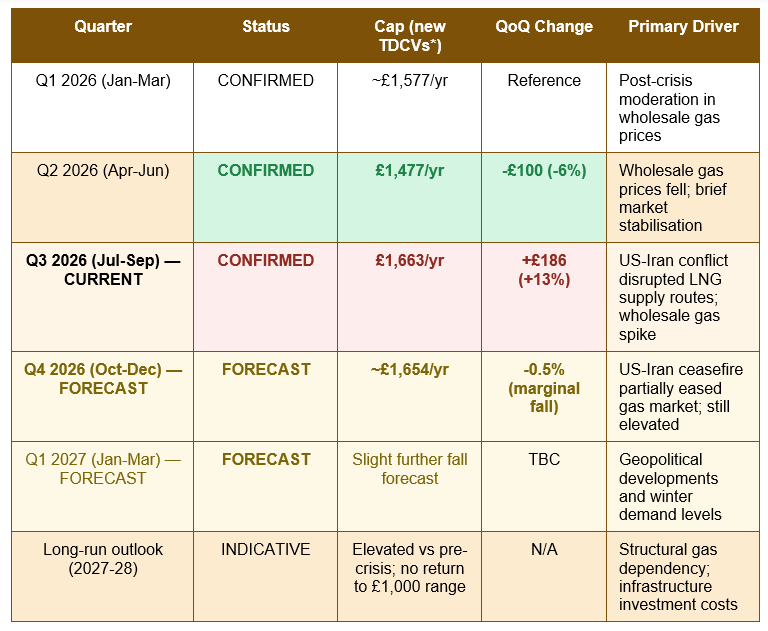
* New TDCVs: 2,500 kWh electricity / 9,500 kWh gas, effective from 1 July 2026. The Q1 and Q2 2026 confirmed figures have been restated to new TDCV basis for direct comparison.
October 2026 cap forecast (Cornwall Insight, 30 June 2026): ~£1,654/yr — a marginal -0.5% fall from Q3 — the first downward move since Q2 2026, driven by the US-Iran 60-day ceasefire partially stabilising wholesale gas markets — but Dr Craig Lowrey explicitly described this as 'a pause, not a resolution' and forecasts remain well above the April 2026 level of £1,477 (Cornwall Insight press release, 30 June 2026).
What Drove the July 2026 Spike — and Why October May Ease
The 13% cap rise from April to July 2026 had a specific, identifiable cause that distinguishes it from the 2021-2022 energy crisis: the US-Israeli military operations against Iran that escalated in early 2026 effectively disrupted global liquefied natural gas supply routes at a critical shipping chokepoint. The Strait of Hormuz — through which approximately 20% of the world's LNG passes — was effectively operating at constrained capacity during the assessment window that fed into the Q3 cap calculation. Gas unit rates on variable tariffs jumped approximately 28% in a single quarter as a result.The subsequent announcement of a 60-day US-Iran ceasefire in late June 2026 provided the partial market relief that has eased the Q4 forecast slightly. However, several significant uncertainties remain that make this relief genuinely fragile. The Strait of Hormuz reopening is still subject to 'conflicting reports on the status of repairs to key regional infrastructure', according to Cornwall Insight's 30 June press release. Peace talks are described as having made 'patchy progress.' And the assessment window for the Q4 2026 cap — the 13-week period of wholesale market data that Ofgem will use to calculate the October level — runs from 19 May to 18 August 2026. Any escalation of the conflict before 18 August would flow directly through into the October cap calculation.
This is why the phrase 'these figures can shift significantly before confirmation' appears with unusual frequency in even the most reputable energy forecasting commentary as of early July 2026. The October forecast is based on early data from an assessment window that has barely started. Cornwall Insight's own forecasting guidance notes that predictions this far in advance carry significant uncertainty, and that meaningful data is still to be gathered before Ofgem's 26 August announcement.
What Could Change the Forecast Before October
The following table maps the specific factors that could push the October 2026 cap higher or lower than current forecasts, based on Cornwall Insight's analysis of the primary drivers of the Q3 2026 assessment: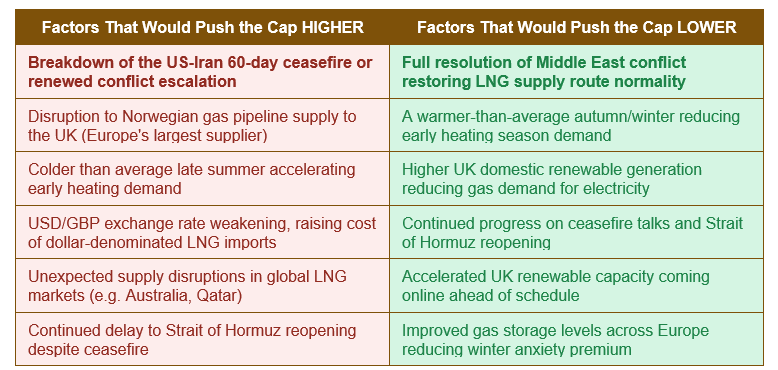
Why 'October may feel harder than July': Cornwall Insight's Dr Craig Lowrey made a specific observation that is easy to overlook in the headline numbers. Even if October's cap level is marginally lower than July's in pound terms, the October cap increase lands at the start of autumn — precisely when UK households turn their heating back on after the summer. The annual impact of the July cap rise (when most households use minimal gas) is substantially smaller in practice than the same cap level would be in winter. An October rise, or even a sustained high level, hits at the moment of highest household gas consumption and therefore produces the most visible real-world impact on bills.
The Long-Run Outlook: Why Bills Will Stay Elevated
Beyond the geopolitical volatility of 2026, Cornwall Insight's longer-term analysis reinforces a structural point that has been consistent across all their published commentary since 2023: there is no current forecasting scenario in which UK energy bills return to the pre-2021 range of £800-£1,000 per year in any plausible near-term period. The January 2027 forecast suggests a 'slight further fall from October' — but the long-run outlook keeps bills well above what UK households paid before the energy crisis, and significantly above the levels that preceded the 2021-2026 period.Several structural factors explain this persistence. The first is physical infrastructure: the UK's gas network infrastructure remains expensive to maintain and operate, and those costs are built into the network component of the price cap, which unlike wholesale costs does not respond to short-term geopolitical developments. The second is the ongoing transition costs of the UK's decarbonisation programme: installing new renewable capacity, expanding the electricity grid, and managing the intermittency of wind and solar all involve real costs that feed through into network charges over the medium term. The third is the UK's structural reliance on global LNG imports, which leaves the cap perpetually exposed to geopolitical events in producing and transit regions far beyond the government's control.
Cornwall Insight's longer-term commentary has described the only durable path to consistently lower energy bills as accelerating the transition to domestic renewable generation — reducing the UK's dependence on imported gas and therefore its vulnerability to geopolitical price shocks. That transition is underway but, as the firm itself acknowledges, will not happen overnight and involves short-term costs along the way.
What This Means for Households: Fixed vs Variable in July 2026
The practical decision facing UK households on variable tariffs right now is straightforward in its structure, even if the inputs to it are genuinely uncertain. You are paying the Q3 2026 cap rate. You can either stay on the variable tariff and accept whatever Q4 brings (currently forecast as a slight improvement), or you can fix at a rate that is currently available below the July cap level, locking in some protection against uncertainty.As of early July 2026, fixed tariffs are available from several suppliers at rates below the current variable cap. MoneySavingExpert's comparison tool shows deals priced below the Q3 2026 level, and pricecaprates.co.uk confirms that 'fixed tariffs are currently available below the July 2026 cap level.' The October forecast shows only a marginal fall, not a return to the April level — meaning anyone fixing at below-cap rates in July is locking in savings relative to both the Q3 confirmed cap and the Q4 forecast simultaneously.
The key considerations for each household's decision remain the same as in any fixed-versus-variable comparison: do you value cost certainty over the next 12 months, do you plan to move within the contract period, are exit fees acceptable, and are you comfortable with the risk that prices might fall further than the marginal October improvement currently forecast? The Middle East situation remains the dominant wildcard — if the ceasefire holds and supply routes fully normalise, October could come in below current forecasts; if it breaks down, October could exceed them.
- Use the current cap as your comparison baseline: Any fixed deal priced below £1,663 per year (new TDCV basis, direct debit) is currently below the variable rate you would pay on a standard tariff from 1 July.
- Compare against the October forecast, not just July: The Q4 2026 forecast of ~£1,654 is only marginally below the confirmed Q3 level of £1,663. Fixing at below £1,654 provides protection even if the October cap comes in at the forecast level.
- Use a whole-of-market comparison tool at your postcode: Uswitch, MoneySuperMarket, and EDF's own forecasting service all show tariffs specific to your region and payment method. The national average cap figures in this guide may differ from what your regional supplier charges.
- Check exit fees before committing: Fixed deals with no exit fee — available from Octopus and some other suppliers — provide the option to switch back if wholesale prices fall sharply before your contract ends, removing the principal financial risk of fixing.
- Set a reminder for 26 August 2026: That is the day Ofgem must confirm the Q4 2026 cap. If you are still on a variable tariff on that date, you will know the confirmed October rate and can make a final decision with actual rather than forecast data.
Conclusion
The UK energy price cap in 2026 is being shaped almost entirely by a single external factor: the status of the US-Iran conflict and its impact on global LNG supply through the Strait of Hormuz. The 13% jump to £1,663 per year (new TDCV basis) from 1 July was driven by wholesale gas prices spiking during the assessment window as supply routes were disrupted. The partial improvement now forecast for October — a marginal 0.5% fall to approximately £1,654 — is driven by the 60-day ceasefire that has partially stabilised markets. And the primary risk to that October forecast is that the ceasefire does not hold, or that supply route restoration proves slower than markets have priced in.Cornwall Insight's long-running structural analysis provides the clearer and more durable conclusion: regardless of what happens in the Middle East over the next few months, UK energy bills are unlikely to return to pre-crisis levels in any near-term period. The network costs, infrastructure investment charges, and transitional costs of decarbonisation that sit in the non-wholesale portion of the cap are going nowhere quickly, and they provide a floor beneath which the cap cannot fall even if wholesale prices moderate significantly.
For households managing energy costs against this backdrop, the practical priorities remain consistent: compare current fixed deals against the cap benchmark using a postcode-specific tool; consider no-exit-fee fixes for households that want protection without locking in indefinitely; reduce actual energy consumption to limit exposure to per-unit price risk regardless of cap direction; and mark 26 August 2026 in the calendar as the date on which all forecast uncertainty for the Q4 cap resolves into a confirmed figure.
Frequently Asked Questions (FAQ)
What is the energy price cap for October 2026?
The October 2026 energy price cap has not yet been confirmed by Ofgem — the official announcement is due by 26 August 2026. The current forecast from Cornwall Insight, published on 30 June 2026, projects the October cap at approximately £1,654 per year for a typical dual-fuel direct debit household under Ofgem's new consumption assumptions (2,500 kWh electricity, 9,500 kWh gas). This would represent a marginal fall of approximately 0.5% from the confirmed Q3 2026 cap of £1,663. The forecast is subject to significant uncertainty and could change materially before the assessment window closes on 18 August 2026.Why is the Q3 2026 cap reported as both £1,862 and £1,663?
Both figures are accurate — they describe the same cap under different consumption assumptions. From 1 July 2026, Ofgem changed its definition of a 'typical household' from 2,700 kWh of electricity and 11,500 kWh of gas per year to 2,500 kWh and 9,500 kWh respectively, reflecting the fact that average household energy use has genuinely fallen in recent years. The cap's actual unit rates (26.11p/kWh electricity, 7.33p/kWh gas) and standing charges are identical in both cases. The £1,862 figure uses the old benchmark; the £1,663 figure uses the new benchmark. Your actual bill depends on what you actually use, not on either benchmark.When will Ofgem announce the October 2026 price cap?
Ofgem must announce the Q4 2026 (October-December) price cap level by 26 August 2026. The announcement typically comes a few days before the statutory deadline. Once confirmed, the new cap level takes effect for all variable tariff customers from 1 October 2026. Energy suppliers must give customers at least 30 days' notice of any change to their variable tariff rates, so the 26 August announcement date is timed to allow exactly this notice period before the 1 October implementation date.Will energy prices fall back to pre-crisis levels?
According to Cornwall Insight's long-term analysis, there is no current forecasting scenario in which UK energy bills return to the pre-2021 range in any near-term period. Even if geopolitical conditions fully normalise and wholesale gas prices moderate, the non-wholesale components of the cap — network charges, infrastructure investment costs, and policy levies — have risen structurally and are not expected to fall significantly. Cornwall Insight's own long-term commentary explicitly identifies accelerating the UK's transition to domestic renewable generation as the only durable route to meaningfully lower energy bills over the medium to long term.Should I fix my energy now or wait for October?
This depends on your risk tolerance and specific circumstances rather than on a universally right answer, and this guide does not provide financial advice. What the data shows is: fixed tariffs are currently available below the Q3 2026 variable cap of £1,663; the October forecast is only a marginal improvement on that level (approximately -0.5%); and the primary risk that could push October higher than forecast is a breakdown of the Iran ceasefire, which Cornwall Insight explicitly cannot rule out. Households that value certainty and want protection against that upside risk may prefer to fix now; those comfortable with the current geopolitical trajectory and happy to wait for the 26 August confirmation may prefer to stay variable until the October rate is known. A no-exit-fee fixed deal represents a middle path that provides some protection while retaining flexibility. Use Uswitch, MoneySavingExpert's Cheap Energy Club, or EDF's forecasting service to compare available deals at your postcode.External References
The following authoritative sources were used in researching this article and are recommended for further reading. Note: this topic is rapidly evolving — checking each source for updated forecasts is advisable.1. Cornwall Insight — Household Energy Costs Look Set to Remain High Through Winter (30 June 2026)
https://www.cornwall-insight.com/press-releases/household-energy-costs-look-set-to-remain-high-through-winter/
2. Cornwall Insight — Default Tariff Cap Predictor (Updated Quarterly)
https://www.cornwall-insight.com/predictions-and-insights-into-the-default-tariff-cap/
3. MoneySavingExpert — Energy Price Cap Prediction (Updated Weekly)
https://www.moneysavingexpert.com/utilities/energy-price-cap-prediction/
4. Ofgem — Changes to Energy Price Cap 1 July to 30 September 2026
https://www.ofgem.gov.uk/news/changes-energy-price-cap-between-1-july-and-30-september-2026
5. EDF Energy — Energy Price Cap Predictions and Forecast
https://www.edfenergy.com/gas-and-electricity/price-cap-predictions
6. British Gas — Energy Price Cap: Confirmed Changes and Future Predictions
https://www.britishgas.co.uk/energy/price-cap.html
7. PriceCapRates.co.uk — Energy Price Cap Forecast October 2026
https://www.pricecaprates.co.uk/forecast
8. Utility Warehouse — Energy Price Cap: Current Rates and Future Predictions (2026)
https://uw.co.uk/energy/the-energy-price-cap

0 Comments Comments