
Finance
What Are Economic Indicators in Trading? Complete Guide


Table of Contents
- The Data That Moves Markets
- What Are Economic Indicators?
- The Consensus Mechanism: Why Surprises Move Markets
- Leading, Lagging, and Coincident Indicators: The Three-Category System
- The 10 Most Important Economic Indicators for Traders: Complete 2026 Reference
- GDP: The Broadest Measure of Economic Health
- CPI and Inflation: The Central Banker's Primary Target
- Core vs Headline CPI
- Non-Farm Payrolls: The Monthly Market Earthquake
- The Economic Calendar: The Trader's Essential Tool
- How to Trade Around Economic Data Releases
- Pre-Release Positioning: Trading the Expectation
- Post-Release Trend Trading: The Most Reliable Approach
- Avoiding Releases: The Risk Management Approach
- Conclusion
- Frequently Asked Questions (FAQ)
- External References
The Data That Moves Markets
On the first Friday of every month at precisely 8:30 AM Eastern Time, the US Bureau of Labor Statistics releases the Non-Farm Payrolls report. In the 60 seconds that follow, the financial markets experience one of the most intense concentrations of trading activity in the entire month. CME Group's research — using multiple linear regression analysis of trading data from January 2021 to January 2025 — found that a single one-standard-deviation surprise in the NFP figure triggers 174,173 additional interest rate futures contracts traded in the first 60 seconds alone, from a baseline of 20,663 on a normal day. Currency pairs move 50 to 100 pips or more within minutes. Gold reacts. Stock index futures reprice. Bond yields shift. All from a single monthly data release.This is the power of economic indicators in trading. Economic indicators are statistical measures of an economy's performance — data releases produced by government agencies, central banks, and survey organisations that quantify the state of key economic variables including output, employment, inflation, consumer confidence, and business activity. Traders, investors, and algorithmic trading systems monitor these indicators because they are the primary inputs into central bank decision-making, and central bank decisions — particularly interest rate changes — are the single most powerful driver of asset prices across currencies, bonds, equities, and commodities.
This guide provides the complete picture of economic indicators in trading: what they are, the three-category classification system (leading, lagging, and coincident), the ten most important indicators every trader should monitor, the live July 2026 readings for each, how to use the economic calendar to plan around releases, the practical strategies for trading around high-impact data, and the key risks to manage when markets react to economic surprises. Whether you trade forex, equities, commodities, or interest rate instruments, economic indicators are the fundamental data layer beneath all market movement.
What Are Economic Indicators?
Economic indicators are statistics that measure specific aspects of an economy's health and performance. They are produced by government statistical agencies (like the US Bureau of Labor Statistics and the UK Office for National Statistics), central banks, international organisations (IMF, World Bank, BIS), and private survey organisations (S&P Global, the Conference Board). Each indicator measures a specific slice of economic activity — employment levels, consumer prices, production output, consumer confidence, trade flows — and is released on a regular schedule, typically monthly or quarterly.For traders, economic indicators matter for two interconnected reasons. First, they determine what central banks do with interest rates — the single most powerful lever in financial markets. Inflation data (CPI) determines whether a central bank tightens or eases policy. Employment data (NFP, unemployment rate) informs whether the economy is strong enough to withstand higher rates. GDP measures overall economic health. When economic data comes in above or below market expectations, traders immediately reassess their interest rate expectations, and asset prices across markets reprice to reflect the new outlook. Second, economic data is the fundamental input for assessing whether currencies, equities, commodities, and bonds are fairly valued — providing the analytical backdrop for longer-term directional positioning.
The Consensus Mechanism: Why Surprises Move Markets
One of the most important principles in trading around economic indicators is that markets price in expectations in advance. Before any major economic release, professional economists and research houses publish their forecasts — the consensus estimate, or simply 'the consensus.' This consensus is widely available on economic calendars and financial data platforms. Because institutional traders and algorithmic systems act on these forecasts, the consensus estimate is essentially priced into markets before the data is released.What moves markets, therefore, is not the headline figure itself but the difference between the actual figure and the consensus — the surprise. If the consensus for NFP was 200,000 new jobs and the actual figure is 250,000, that 50,000 beat is the surprise, and it drives the market reaction. If the actual is 150,000 — a 50,000 miss — the market reaction is in the opposite direction. Switch Markets (April 2026) summarises this precisely: 'When economic data is released, immediately compare the actual value with the forecast. A significant positive surprise typically strengthens the currency. A negative surprise often triggers sell-offs. The bigger the deviation, the stronger the market reaction.'
The NFP's market impact in one number: 174,173 additional contracts traded in 60 seconds from a 1-standard-deviation NFP surprise (vs 20,663 baseline) — CME Group's multiple linear regression analysis of trading data (January 2021 to January 2025) found NFP surprises trigger the largest trading volume response of any economic release in the first minute. The analysis also found traders reacted MORE to employment surprises than to CPI surprises over this period — consistent with consumer spending accounting for more than two-thirds of US economic activity (CME Group, 2025 research report).
Leading, Lagging, and Coincident Indicators: The Three-Category System
Economic indicators are classified into three types based on when they change relative to the broader economic cycle. Understanding this classification is essential for knowing what each indicator tells you and how to use it: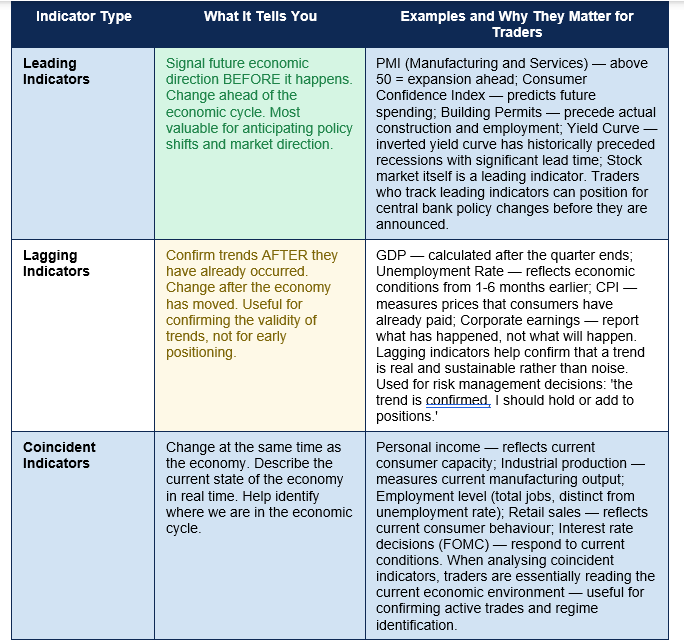
The most important leading indicator for traders: PMI. The Purchasing Managers Index (PMI) is widely considered the most actionable leading indicator for traders. Released monthly by S&P Global and ISM, it surveys purchasing managers at companies about new orders, production, employment, supplier deliveries, and inventories. A PMI reading above 50 signals expansion in the sector; below 50 signals contraction. Because purchasing managers are on the front line of business activity — they see new orders, hiring decisions, and supply chain pressures before they appear in official GDP or employment data — PMI provides a genuine forward signal. ACY Securities' 2026 education guide is clear: 'PMI is considered a leading indicator — it gives us an early signal of how the economy might perform before more official data is released.' A manufacturing PMI dropping from 53 to 47 over two months is a powerful signal of economic deterioration that will likely show up in GDP and employment data months later.
The 10 Most Important Economic Indicators for Traders: Complete 2026 Reference
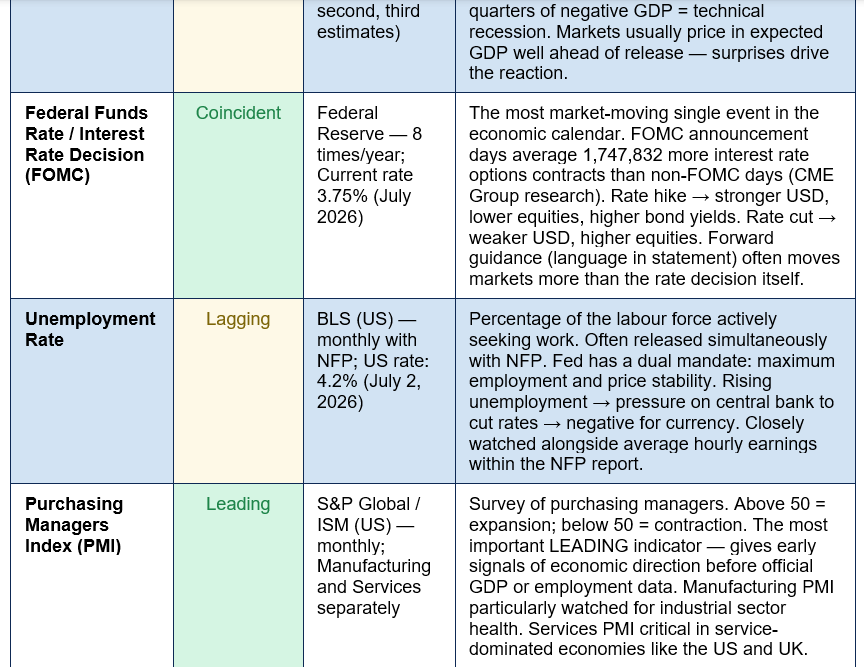
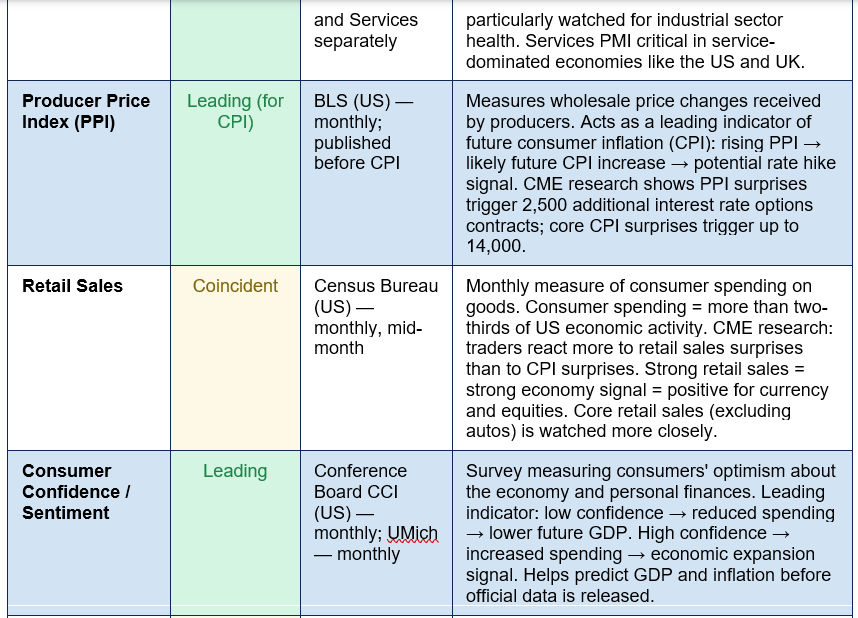
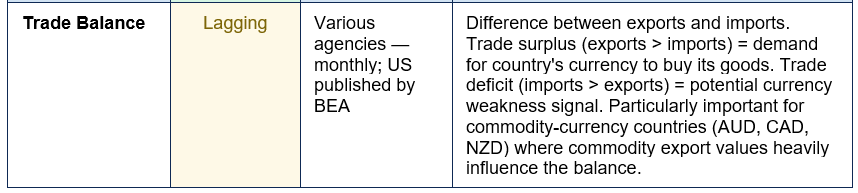
The economic calendar on platforms like Investing.com, Forex Factory, and TradingView tracks over 300,000 indicators from more than 190 countries. In practice, a small number of high-impact releases drive the vast majority of market-moving events across forex, equities, bonds, and commodities. The table below covers the ten most important indicators every trader should monitor, with their July 2026 readings, market impact data, and classification: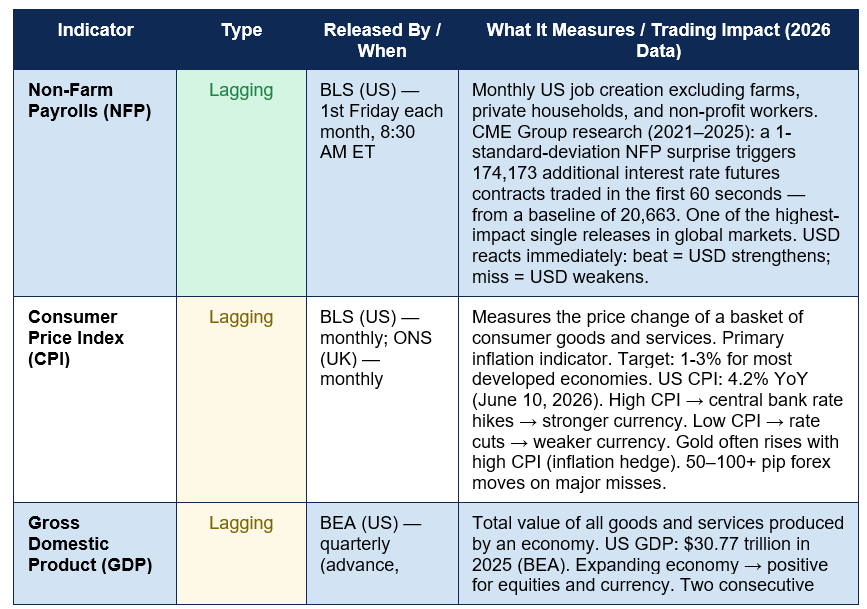
GDP: The Broadest Measure of Economic Health
Gross Domestic Product is the total monetary value of all goods and services produced within a country's borders in a specific period — typically reported quarterly in the United States as advance, second, and third estimates. The US economy reached $30.77 trillion in GDP in 2025 according to TradingView's BEA data. GDP is the most comprehensive single measure of economic performance and forms the ultimate foundation for currency valuation, equity market performance, and central bank policy.For traders, GDP's impact is nuanced. Because GDP is a lagging indicator — it measures what has already happened over the previous quarter — markets tend to price in GDP expectations well in advance based on leading and coincident indicators that come through during the quarter. The advance estimate (released approximately one month after the quarter ends) is the most market-moving of the three GDP reports because it contains the most new information. Subsequent revisions are less impactful unless they significantly change the picture.
The most significant GDP event for markets is the identification of a technical recession — two consecutive quarters of negative GDP growth. Such an outcome produces significant risk-off moves: equity markets decline, safe-haven currencies (JPY, CHF, USD) tend to strengthen, and markets aggressively price in central bank rate cuts. The inverse — GDP growth significantly above trend — can trigger central bank tightening concerns and currency strength. In the current 2026 environment, with the Fed having cut rates throughout 2025 and inflation remaining at 4.2% YoY, any strong GDP print that suggests the economy is running too hot could revive rate hike expectations and generate significant market volatility.
CPI and Inflation: The Central Banker's Primary Target
The Consumer Price Index measures the average change over time in the prices paid by urban consumers for a basket of goods and services — food, housing, clothing, transportation, medical care, recreation, and education. It is the primary inflation gauge used by most central banks when setting interest rate policy, and is one of the most consistently market-moving monthly releases in the economic calendar.The US CPI reading for June 2026 was 4.2% YoY — above the Federal Reserve's 2% target and above the 1-3% range that most developed economies consider price stability. This elevated reading explains the Fed's current rate level of 3.75% even after a series of cuts from higher levels in 2024-2025. The interplay between CPI and interest rate policy is the central dynamic of the current macro environment: if CPI shows unexpected further acceleration, rate cut expectations will reverse, the dollar will strengthen, and growth assets (equities) will face pressure. If CPI declines toward the 2% target, further rate cuts become more likely, which tends to weaken the dollar and support risk assets.
ACY Securities' 2026 education guide summarises the CPI-market chain concisely: 'High CPI → Rate hikes → Stronger currency. Low CPI → Rate cuts → Weaker currency. Gold also reacts: it often rises when CPI is high (inflation hedge) and falls when CPI is low.' The gold relationship is particularly important for commodity traders. High CPI creates demand for gold as a store of value against purchasing power erosion, while low CPI reduces the inflation hedge appeal and can push gold prices down.
Core vs Headline CPI
Traders and central banks pay close attention to both headline CPI (which includes all components) and core CPI (which excludes food and energy prices). Core CPI is generally more informative for monetary policy because food and energy prices are highly volatile and subject to supply shocks outside the central bank's control — a spike in oil prices does not necessarily reflect underlying inflationary pressure in the economy. The Fed's preferred inflation measure is actually Core PCE (Personal Consumption Expenditures), not CPI, though CPI remains the most widely reported and most immediately market-moving inflation release.Non-Farm Payrolls: The Monthly Market Earthquake
The Non-Farm Payrolls (NFP) report is released on the first Friday of each month at 8:30 AM Eastern Time by the US Bureau of Labor Statistics. It reports the net change in employment across all sectors of the US economy except farms, private households, non-profit organisations, and some government employees. Because the US is the world's largest economy and the dollar is the world's reserve currency, NFP drives market movements across currencies, equities, bonds, and commodities simultaneously.The CME Group's research into NFP's market impact (data from January 2021 to January 2025) provides the most rigorous quantification of this indicator's power: a single one-standard-deviation surprise triggers 174,173 additional interest rate futures contracts traded in the first 60 seconds, from a baseline of 20,663. The statistical significance is overwhelming — the P-value for the NFP-to-trading-volume relationship in the five minutes after release is 3E-05 (0.003%), meaning there is a 0.003% chance the observed relationship is due to chance.
The NFP report contains several components beyond the headline jobs number, all of which affect the overall market reaction. The unemployment rate (US: 4.2% as of July 2, 2026), average hourly earnings (wage inflation), the labour force participation rate, and revisions to prior months' figures can all cause the market to react differently from what the headline jobs number alone would suggest. A strong headline NFP beat accompanied by weak wage growth and a rising unemployment rate will produce a more muted positive reaction than a beat with strong wages and a falling unemployment rate. FOREX.com's trading academy guidance recommends watching all secondary components: 'Monitor all data points — focus on the headline figure but also watch secondary components such as wage growth in NFP or core inflation in CPI since they can offset the headline effect.'
The Economic Calendar: The Trader's Essential Tool
The economic calendar is a real-time schedule of upcoming economic data releases and events, showing the date, time, country, indicator name, previous reading, consensus forecast, and actual reading once released. It is the fundamental planning tool for any trader who incorporates economic data into their strategy. Platforms including Investing.com, Forex Factory, TradingView, Forex.com, and TradingEconomics all provide free economic calendars that cover thousands of indicators globally.Investing.com's economic calendar uses a three-star importance rating system that is now an industry standard. One star indicates low expected market impact; two stars indicate moderate potential volatility; three stars signal high-impact events — these are the releases most likely to cause significant price movement across multiple asset classes. The highest-impact three-star events in the US include the FOMC interest rate decision, NFP, GDP releases, CPI, and unemployment data. Filtering to three-star events on any given week provides a focused map of the highest-risk and highest-opportunity moments in the trading calendar.
The calendar format typically shows three numbers for each release: Previous (the most recently reported figure), Forecast (the consensus estimate from economists), and Actual (populated in real time when the data is released). The comparison of Actual versus Forecast is the live market signal — when Actual significantly exceeds Forecast (shown in green on most platforms), the typical response is a positive reaction for the releasing economy's currency. When Actual significantly misses Forecast (shown in red), the opposite reaction typically follows. The size of the deviation between actual and expected determines the magnitude of the market response.
HOW TO USE THE ECONOMIC CALENDAR EFFECTIVELY: Check the calendar at the start of each week and identify all three-star events. Note the expected release time, the previous reading, and the consensus forecast for each. Decide in advance what your trading response will be for beat vs miss scenarios for each key release. Switch Markets' April 2026 guide recommends: 'Avoid holding risky positions during high-impact events unless you have a specific event-trading strategy. Many traders close positions 30 minutes before major releases.' If you choose to trade around releases, wait 15–30 minutes after the initial data hits before entering — allowing the initial volatility whipsaw to settle and a clearer trend direction to emerge. Always use a stop loss.
How to Trade Around Economic Data Releases
Traders use economic data in several distinct ways, ranging from long-term fundamental positioning to short-term volatility trading around the actual release moment. Understanding which approach fits your strategy and risk tolerance is essential before engaging with high-impact releases.Pre-Release Positioning: Trading the Expectation
Many professional traders and investors position themselves in advance of expected economic surprises, based on their own analysis of the likely outcome versus the consensus. If leading indicators (PMI, jobless claims) have been pointing toward a strong NFP, a trader may take a long dollar position before the release, hoping the actual NFP beats consensus and validates the directional thesis. This approach is higher risk — the market often moves against pre-release positioning in the moments just before the data drops, as traders take profits or hedge — but can produce large gains if the fundamental analysis is correct.Post-Release Trend Trading: The Most Reliable Approach
The most consistently recommended approach for retail traders trading around economic releases is to wait for the initial volatility to settle after the data is published, then trade the emerging trend direction. The first 60 seconds to 5 minutes after a high-impact release are characterised by extreme volatility, wide spreads, and frequent whipsaws — prices moving sharply in one direction and then reversing before settling into the sustained directional move. Waiting 15–30 minutes after the release allows the initial reaction to play out and a clearer trend to establish. The sustained trend that follows a strong data surprise is the more reliable trading opportunity for most traders.Avoiding Releases: The Risk Management Approach
Many experienced traders — particularly swing traders and position traders with longer time horizons — choose not to trade around high-impact releases at all. Instead, they close or reduce positions before major data events and re-enter after the release has settled. This eliminates the risk of being caught in a whipsaw move, adverse slippage, or an unexpected data outcome that moves the market sharply against an open position. This approach prioritises capital preservation over the opportunity to capture release-driven volatility.RELEASE-DAY RISK WARNING — SLIPPAGE AND SPREAD WIDENING: During high-impact economic releases, brokers often widen spreads significantly and order execution can be delayed due to the extreme volume of simultaneous orders. What appears to be a tight spread of 0.8 pips on EUR/USD during normal hours can widen to 5–20 pips in the seconds surrounding a major NFP, CPI, or FOMC announcement. Stop losses may not be filled at your specified level due to gapping — where the price jumps past your stop without trading at that price. If you trade around high-impact releases, use guaranteed stop loss orders (GSLOs) where available, size positions conservatively, and expect that execution costs will be meaningfully higher than in normal market conditions.
Conclusion
Economic indicators are the fundamental data layer that drives all financial markets. Every asset price — currency exchange rates, stock indices, bond yields, gold, oil, and every commodity and derivative derived from them — is ultimately anchored to expectations about economic growth, inflation, employment, and central bank policy. Those expectations are formed, tested, and revised through the continuous flow of economic data releases that the economic calendar schedules month by month. Understanding what each indicator measures, what it signals about the economy and likely central bank response, and how markets typically react to beats and misses is one of the most practically important analytical skills available to any trader.The ten indicators covered in this guide — NFP, CPI, GDP, interest rate decisions, unemployment, PMI, PPI, retail sales, consumer confidence, and trade balance — are not equally weighted. NFP and the FOMC rate decision generate the largest immediate trading volume responses in the data: a single standard-deviation NFP surprise produces 174,173 additional contracts in the first 60 seconds (CME Group research), while FOMC announcement days produce 1,747,832 more interest rate options contracts than average days. CPI at 4.2% YoY in the US in July 2026 — above the Fed's 2% target — is the central indicator shaping current monetary policy decisions and the macro environment for all asset classes. PMI, as the most important leading indicator, provides the earliest signal of where the economy is heading before official lagging data confirms it.
The economic calendar is the tool through which all of this data is accessed, scheduled, and contextualised against consensus expectations. Filtered to three-star events and used with a clear plan for each potential outcome — beat scenario, in-line scenario, miss scenario — it transforms from a passive information source into an active trading planning tool. The principle that unifies every aspect of economic indicator trading is the consensus mechanism: it is not the headline figure that moves markets, but the distance between what the actual figure shows and what the market already expected. That gap — the surprise — is where price action lives.
Frequently Asked Questions (FAQ)
What are economic indicators in trading?
Economic indicators are statistical measures released by government agencies, central banks, and research organisations that quantify the performance of specific aspects of an economy. In trading, they matter because they are the primary inputs into central bank interest rate decisions — and interest rates are the most powerful single driver of asset prices across forex, bonds, equities, and commodities. When economic data surprises the market — coming in above or below the consensus estimate that analysts had forecast — asset prices reprice immediately to reflect the new economic outlook and the revised expectations for central bank policy that follow. Key economic indicators include GDP (overall economic size and growth), CPI (consumer price inflation), NFP (employment creation), interest rate decisions, PMI (business activity survey), and retail sales (consumer spending).What is the most important economic indicator for traders?
Different traders prioritise different indicators depending on the asset classes they trade and their time horizon. For forex traders, the FOMC interest rate decision and Non-Farm Payrolls are generally considered the two most market-moving events for the USD — the world's most widely traded currency. CME Group's research confirms NFP produces the largest immediate trading volume response of any data release, with a one-standard-deviation surprise generating 174,173 additional futures contracts in the first 60 seconds. For anticipating future central bank policy (and therefore positioning early), PMI is the most important leading indicator because it signals economic direction before official GDP and employment data confirm it. For commodity traders, CPI is particularly important because of gold's role as an inflation hedge. Most experienced traders rank all three — NFP, CPI, and FOMC rate decisions — as equally essential to monitor.What is the difference between leading and lagging economic indicators?
Leading indicators change before the economy changes direction — they signal future economic conditions. PMI (Purchasing Managers Index), consumer confidence, building permits, and new orders data are all leading indicators. They are most valuable for positioning in advance of expected policy changes or economic turning points. Lagging indicators confirm trends that have already developed — they change after the economy has moved. GDP, the unemployment rate, and CPI are all lagging indicators because they measure conditions that have already occurred by the time the data is published. Lagging indicators are useful for confirming that a trend is real and sustainable. Coincident indicators change at approximately the same time as the economy — personal income, industrial production, and retail sales are coincident. Most effective trading strategies combine all three types: use leading indicators to anticipate, coincident indicators to confirm current conditions, and lagging indicators to validate the trend.How does CPI affect currency values?
CPI (Consumer Price Index) affects currency values through its influence on central bank interest rate decisions. High CPI (inflation above target) puts pressure on central banks to raise interest rates to cool inflation. Higher interest rates make a currency more attractive to international capital seeking better returns, increasing demand for the currency and pushing its value up. Low CPI (below target) gives central banks room to cut rates to stimulate growth. Lower rates reduce the return on assets denominated in that currency, reducing demand and weakening the currency. The US CPI was 4.2% YoY in June 2026 — above the Fed's 2% target. This elevated inflation level is the primary reason the Fed's current rate is 3.75% rather than near zero. If CPI were to fall sharply toward 2%, markets would price in aggressive rate cuts, which would weaken the dollar against most major currencies.How should traders use the economic calendar?
The economic calendar should be reviewed at the start of each trading week to identify high-impact events (three-star events on Investing.com, red events on Forex Factory) that could cause significant market volatility. For each high-impact event, note the release time, the previous reading, and the consensus forecast. Before the release, plan your scenarios: what action will you take if the data beats consensus? What if it misses? This advance planning prevents reactive trading in the heat of the moment. During the release itself, brokers widen spreads and order execution may be delayed — use guaranteed stop losses if available. Most traders find it more reliable to wait 15–30 minutes after the release for initial volatility to settle before entering trades based on the emerging post-release trend direction. Always track the difference between actual and forecast — the surprise — not just the headline number, as markets respond to the deviation from expectations rather than the absolute level of the data.External References
1. CME Group — Economic Indicators That Most Impact Markets (Regression analysis Jan 2021–Jan 2025, published 2025)https://www.cmegroup.com/insights/economic-research/2025/economic-indicators-that-most-impact-markets.html
2. Investing.com — Economic Calendar (Real-time, 300,000+ indicators, three-star impact system)
https://www.investing.com/economic-calendar
3. FOREX.com — Key Economic Indicators and Announcements (Trading Academy — GDP, CPI, NFP explained)
https://www.forex.com/en-sg/trading-academy/courses/fundamental-analysis/key-economic-indicators/
4. Switch Markets — How to Read and Trade the Economic Calendar (April 2026)
https://www.switchmarkets.com/learn/read-trade-economic-calendar
5. ACY Securities — Top 5 Economic Indicators Every Forex and Gold Trader Should Know (2026)
https://acy.com/en/market-news/education/top-economic-indicators-forex-gold-trading-l-s-180443/
6. TradingView — Economic Calendar (Live data: US rates, CPI, unemployment, GDP)
https://www.tradingview.com/economic-calendar/
7. ePlanet Brokers — Your Ultimate Guide to the Forex Factory Calendar for 2026 (1 week ago)
https://eplanetbrokers.com/training/forex-factory-calendar
8. TradingEconomics — Economic Calendar (196 countries, 300,000 indicators, live data)
https://tradingeconomics.com/calendar
0 Comments
Be the first to share your thoughts on this article.