

Investing
What Is the Dividend Discount Model? Accountant Explains

Table of Contents
- The Purest Equity Valuation Model
- What Is the Dividend Discount Model?
- The Three DDM Variants: Zero Growth, Gordon Growth, and Multi-Stage
- The Gordon Growth Model: The Most Important DDM Variant
- The Critical r−g Constraint
- Worked Examples: The Gordon Growth Model in Practice
- Example 1 — Stable UK Utility Company
- Example 2 — Coca-Cola Sensitivity Analysis (fffinstill, April 2026)
- The Multi-Stage DDM: Handling High-Growth to Mature Transition
- DDM vs DCF vs Comparable Company Analysis: The Valuation Framework
- Limitations of the Dividend Discount Model
- When to Use the DDM: Ideal Company Profiles
- Conclusion
- Frequently Asked Questions (FAQ)
- External References

The Purest Equity Valuation Model
The Dividend Discount Model is one of the oldest, most theoretically grounded, and most practically constrained tools in investment analysis. It rests on a deceptively simple idea: a share of stock is worth the present value of all the dividends it will ever pay. Not earnings. Not cash flows. Not what the market currently charges for comparable companies. Just dividends — the actual cash that flows from the company to the shareholder, nothing more and nothing less.fffinstill's April 2026 investment concept guide articulates the theoretical appeal precisely: 'DDM is the theoretically purest stock valuation model because dividends are the only cash flows that actually flow from the company to the shareholder. Every other valuation model is, at its foundation, a variation of the DDM.' This purity is the model's greatest strength and its most significant limitation simultaneously. For Coca-Cola — which has paid and grown its dividend for 62 consecutive years — the DDM provides an elegant, transparent, and highly informative estimate of intrinsic value. For Amazon, which paid no dividend for most of its existence and Alphabet, which has historically reinvested almost all earnings, the DDM literally assigns zero value to the stock, because there are no dividends to discount. This is a significant coverage gap in a world where some of the most valuable companies in history built wealth by reinvesting rather than distributing earnings.
This guide covers the complete picture of the Dividend Discount Model: the time value of money logic that underlies it, the three main variants from the simplest zero-growth version to the sophisticated multi-stage model, the Gordon Growth Model in detail as the dominant form, step-by-step worked examples including the Coca-Cola sensitivity analysis, how DDM relates to DCF and comparable company analysis in the valuation toolkit, and the critical limitations that define when and why the model fails. Understanding both when to use it and when not to use it is the most practically important skill in DDM analysis.
What Is the Dividend Discount Model?
The Dividend Discount Model (DDM) is an intrinsic equity valuation method that estimates the fair value of a company's stock by summing the present value of all future dividends it is expected to pay over its lifetime. Its mathematical foundation is the time value of money — the same principle that underpins all discounted cash flow analysis — applied specifically and exclusively to dividends.The Corporate Finance Institute's May 2026 guide defines it precisely: 'The Dividend Discount Model (DDM) is a quantitative method for valuing a company's stock price, assuming that the current fair price equals the sum of all future dividends discounted to present value. The dividend discount model was developed under the assumption that the intrinsic value of a stock reflects the present value of all future cash flows generated by a security. At the same time, dividends are essentially the positive cash flows generated by a company and distributed to the shareholders.'
The general DDM equation, as taught in Harvard Business School's Strategic Financial Analysis course, is:
V₀ = D₁/(1+r)¹ + D₂/(1+r)² + D₃/(1+r)³ + ... + Dₙ/(1+r)ⁿ
• V₀ = the intrinsic value of the stock today (per share)
• Dₜ = the expected dividend in year t
• r = the required rate of return (cost of equity — most commonly estimated using CAPM)
• n = the number of periods in the explicit forecast (extending to infinity in constant-growth models)
CLFI's UK equity valuation guide (April 2026) adds an important distinction between DDM and DCF: 'The required rate of return (r) is most often estimated using the Capital Asset Pricing Model (CAPM), in contrast to the weighted average cost of capital (WACC) used in enterprise-level valuations, which blends the cost of debt with the cost of equity. Because the DDM produces a per-share intrinsic value directly, the analyst works entirely within the equity layer and does not need to reconstruct the capital structure to reach a conclusion.' This is the DDM's practical efficiency advantage: it goes directly to equity value per share without the enterprise-to-equity value bridge that DCF requires.
The DDM sensitivity reality: 1% change in r or g moves intrinsic value by 20%+ — always run sensitivity analysis, never rely on a single DDM output — CLFI's April 2026 UK equity valuation guide confirms: 'A one-percentage-point change in the assumed growth rate, or a similar shift in the required return, can move the result by 20% or more, making the assumptions themselves more consequential than the arithmetic.' fffinstill's April 2026 analysis quantifies this specifically for Coca-Cola: changing growth assumption from 5% to 6% moves fair value from $50.93 to $68.53 — a 35% increase from a single one-point change. DDM outputs must always be presented as sensitivity ranges, never point estimates.
The Three DDM Variants: Zero Growth, Gordon Growth, and Multi-Stage
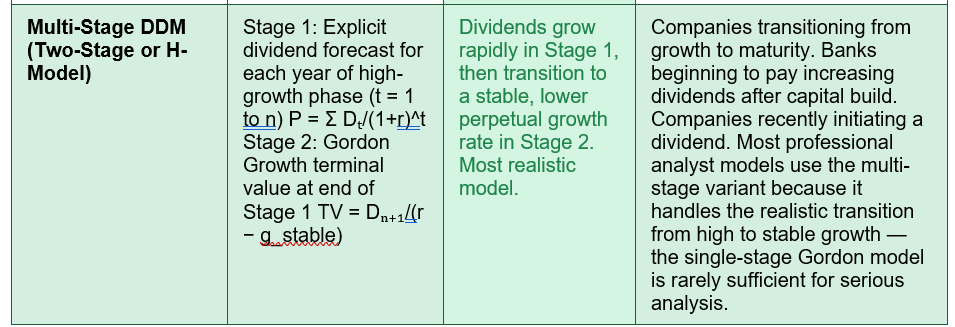
The DDM exists in three main variants that differ in how they model the future growth of dividends. Each is appropriate for different types of companies and investment situations: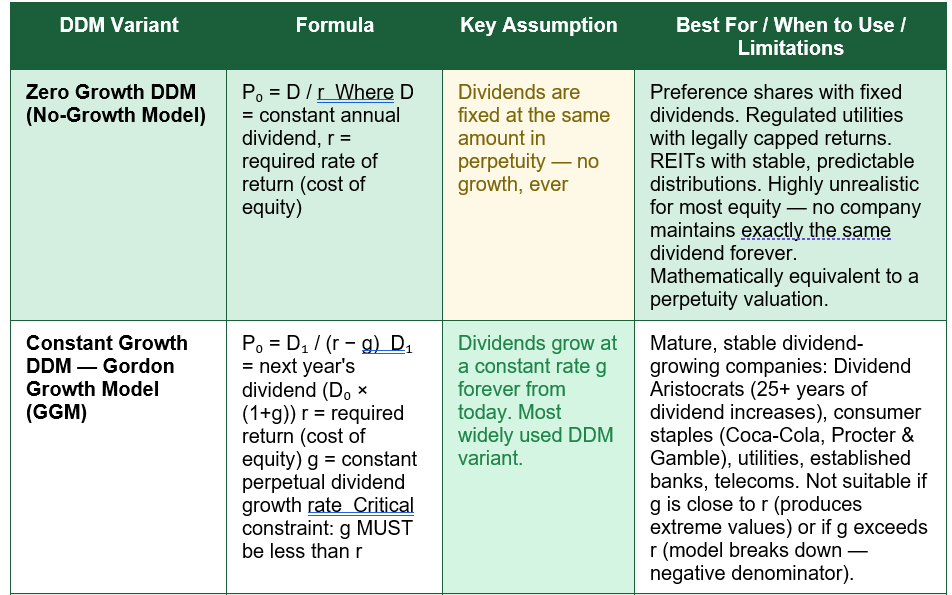
The Gordon Growth Model: The Most Important DDM Variant
The Gordon Growth Model (GGM), also called the Constant Growth DDM, is by far the most widely used variant of the dividend discount model in practice. Named after Myron J. Gordon, who formalised it in 1956, it simplifies the general multi-period DDM into a single elegant formula by assuming that dividends will grow at a constant rate g forever from the next period onwards:P₀ = D₁ / (r − g)
• P₀ = the intrinsic value of the stock today (fair price per share)
• D₁ = the expected dividend one year from now (D₀ × (1+g), where D₀ is the most recent actual dividend)
• r = the required rate of return (cost of equity, typically calculated using CAPM)
• g = the constant perpetual dividend growth rate (must always be less than r, or the formula produces a nonsensical result)
The formula is elegant because it reduces an infinitely long string of discounted dividend payments into a single simple ratio. Mathematically, when a cash flow grows at a constant rate g in perpetuity and is discounted at a rate r that exceeds g, the infinite sum converges to D₁/(r−g). This is the same logic as the standard perpetuity growth formula used in DCF terminal value calculations.
The Critical r−g Constraint
The most important mathematical constraint in the Gordon Growth Model is that the growth rate g must be strictly less than the required return r. The reason is algebraic: if g equals r, the denominator (r−g) becomes zero and the formula produces an infinite value, which is economically meaningless. If g exceeds r, the denominator becomes negative, implying that the stock has a negative value — also economically meaningless.In practice, the perpetual growth rate g in a Gordon Growth Model should never exceed the long-run nominal GDP growth rate of the economy the company operates in — typically 2% to 5% for developed economies in 2026. A growth rate above GDP growth in perpetuity implies the company will eventually be larger than the entire economy, which is arithmetically impossible. The Motley Fool's DDM guide notes: 'Dividends, even those that increase every year, don't usually increase at a constant rate.' This is why the multi-stage model is more realistic for companies in transition.
Worked Examples: The Gordon Growth Model in Practice
Example 1 — Stable UK Utility Company
A UK utility company has just paid an annual dividend of 40p per share. Analysts expect dividends to grow at 3% per year in perpetuity, reflecting the company's regulated revenue model. The investor requires a 7% return (cost of equity estimated using CAPM).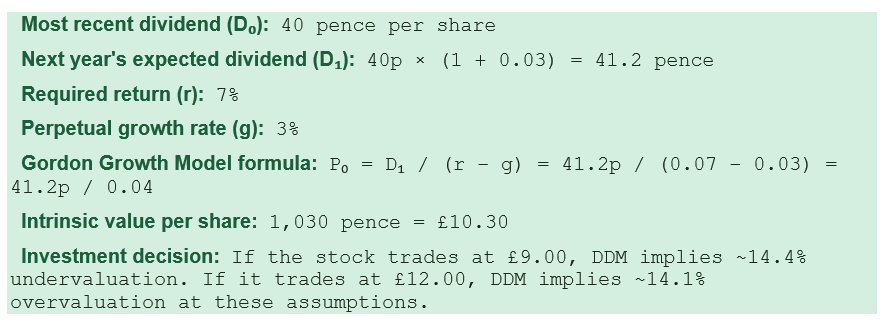
Example 2 — Coca-Cola Sensitivity Analysis (fffinstill, April 2026)
Coca-Cola has paid and grown its dividend for 62 consecutive years — the quintessential Dividend Aristocrat and the most commonly cited DDM example. fffinstill's April 2026 analysis provides the live sensitivity: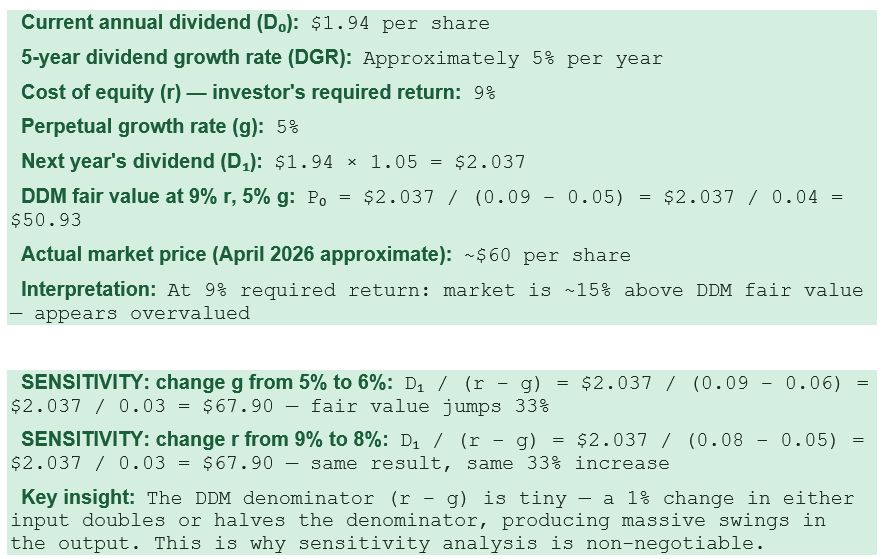
The Coca-Cola tension — DDM says overvalued, market disagrees: fffinstill's April 2026 analysis frames the most instructive DDM outcome precisely: 'At a market price of ~$60, the market is either pricing in 6%+ growth or accepting a lower required return (~8%). If you demand 9%, KO appears ~15% overvalued. This tension — DDM says overpriced, the market disagrees — is a classic value investor's dilemma. DDM forces you to make your assumptions explicit. When the model says overvalued and the market disagrees, either your inputs are wrong (lower cost of equity? higher growth?) or the market is paying an unjustified premium. The exercise of reconciling the two is where investment insight comes from.' This is the most important use of DDM: not to produce a definitive number, but to force explicit assumptions and then interrogate the gap between model output and market price.
The Multi-Stage DDM: Handling High-Growth to Mature Transition
The Gordon Growth Model's constant-growth assumption is too restrictive for many real-world companies. A bank that is building regulatory capital and paying modest dividends today may transition to a much higher payout ratio once its capital ratios are met. A consumer staples company that currently grows dividends at 8% may slow to 3% perpetual growth as its market matures. For these situations, the multi-stage DDM provides a more realistic framework.The two-stage DDM is the most commonly used multi-stage variant. It divides the dividend forecast into two distinct phases: Stage 1 is an explicit, year-by-year dividend forecast for a finite period (typically 5 to 10 years) during which dividends grow at a higher, unsustainable rate. Stage 2 is a terminal value — a Gordon Growth Model calculation applied from the end of Stage 1 onwards at a lower, sustainable perpetual growth rate.
Wall Street Prep's DDM guide illustrates the mechanics with a two-stage example producing an implied share price of $75.21, incorporating explicit Stage 1 dividends plus a Stage 2 terminal value discounted back to today. The mechanics mirror those of the DCF model's terminal value calculation, with the same sensitivity to the assumed perpetual growth rate and the same risk of the terminal value dominating the total value. OpenStax's Principles of Finance textbook (2026 edition) provides a full five-year high-growth Stage 1 plus terminal value calculation resulting in a terminal value of $386.91 and a total intrinsic value of $291.44 per share in their worked example.
WHEN TO USE THE TWO-STAGE DDM INSTEAD OF GGM: Use the two-stage DDM whenever a company's near-term dividend growth rate is materially different from the long-run sustainable rate — which is more common than the reverse. Key situations: a company that recently initiated a dividend and is expected to grow it rapidly for several years before moderating; a bank post-crisis rebuilding its dividend from a lower base; a mature company accelerating dividends as capex needs decline. The Gordon Growth Model's simplicity is appropriate for companies already in stable, mature growth — but 'stable' means genuinely stable: consistent margins, stable competitive position, predictable capital requirements, and a dividend growth history that plausibly continues at the same rate indefinitely.
DDM vs DCF vs Comparable Company Analysis: The Valuation Framework
The DDM is one of three core equity valuation approaches — alongside discounted cash flow (DCF/FCFE) and comparable company analysis (comps) — that professional analysts triangulate between for dividend-paying stocks. Understanding the specific role each plays and how they relate to each other is as important as understanding the DDM mechanics: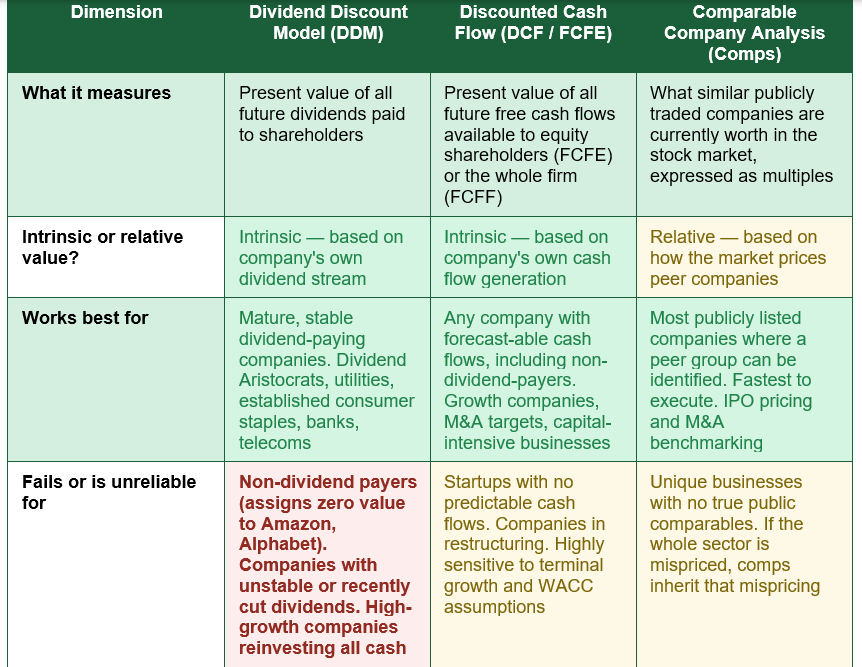
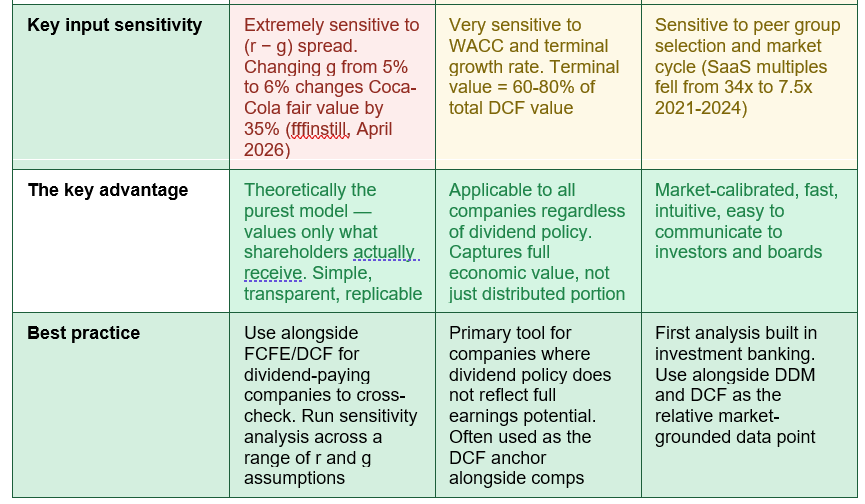
For a company like a UK bank, utility, or established consumer staples brand that pays reliable and growing dividends, the ideal analytical framework uses all three in combination: DDM to establish an intrinsic value from the dividend stream; FCFE (free cash flow to equity) to check whether the dividend is genuinely sustainable or is consuming more cash than the business generates; and comps to calibrate the output against what the market currently pays for the peer group. If DDM says 40p per share fair value and the comps-implied P/E puts the stock at 60p, the 20p gap is the analytical question worth interrogating.
Limitations of the Dividend Discount Model
The DDM's theoretical purity comes with practical constraints that are more binding than those of most other valuation approaches. Every analyst using the DDM must understand and communicate these limitations clearly:- Inapplicable to non-dividend payers: The DDM assigns zero value to any company that pays no dividend — including Amazon, Alphabet, Berkshire Hathaway (pre-2025), and many other companies that have created enormous shareholder value through reinvestment. fffinstill's April 2026 guide notes this limits the DDM's applicability to roughly half of the S&P 500. For non-dividend payers, DCF using free cash flow to equity (FCFE) is the appropriate intrinsic valuation method.
- Extreme sensitivity to (r − g): The denominator of the Gordon Growth Model — (r minus g) — is typically small. Even a 1% change in either input can move the fair value estimate by 20% or more. This mathematical amplification means that the inputs — particularly the growth rate assumption — are far more consequential than the arithmetic. Small differences in reasonable analysts' growth assumptions can produce wildly different fair value estimates for the same company, making DDM outputs particularly vulnerable to the 'garbage in, garbage out' problem.
- The perpetual constant growth assumption is unrealistic: No company maintains exactly the same dividend growth rate forever. Even Coca-Cola — the DDM's most cited example — has experienced periods of accelerating and decelerating dividend growth across its history. The constant growth assumption simplifies reality to a point where the model becomes a useful approximation at best and a dangerously misleading figure at worst for companies whose growth rate is genuinely uncertain or volatile.
- Dividend policy does not always reflect earning power: Wall Street Prep's DDM guide raises a critical practical concern: 'Even poorly run companies could continue to issue large dividends, causing potential distortions in valuations. The decision to issue large dividends could be attributable to upper-level mismanagement — management missing opportunities for reinvesting into core operations and instead focusing on dividends.' Conversely, a highly profitable company that reinvests all earnings — as many technology companies do — will appear worthless under DDM while generating enormous economic value. CLFI's April 2026 UK guide notes: 'Where a company suppresses dividends despite generating strong distributable cash flow, the declared dividend understates the investor's actual claim on the business, and a levered free cash flow (LFCF) approach better reflects economic reality.'
- The model breaks down if g approaches r: When the assumed growth rate approaches the discount rate, the denominator (r−g) approaches zero and the implied share price approaches infinity. This mathematical instability makes the model unreliable for any company where a plausible range of growth assumptions straddles the discount rate.
THE PERPETUAL GROWTH FALLACY: The most dangerous assumption in any DDM is a perpetual growth rate that exceeds long-run economic growth. A g of 6% forever, in an economy growing nominally at 4%, implies that the company will ultimately be larger than the economy itself — an arithmetic impossibility. As Chuck Carnevale (Mr. Valuation, FAST Graphs) states in his January 2026 DDM evaluation: 'I take exception with formulas that talk about calculating things in perpetuity. To my practical mind, that is an aggressive and unrealistic assumption.' Any DDM where the assumed perpetual growth rate is higher than the long-run nominal GDP growth rate of the economy (typically 3-5% for developed economies) should be treated with extreme scepticism.
When to Use the DDM: Ideal Company Profiles
The DDM is most reliable and most informative for a specific category of companies whose characteristics align with the model's core assumptions. CLFI's April 2026 guide identifies the ideal profile: 'Applied to mature, stable, dividend-paying companies where the dividend series is genuinely representative of distributable earnings, it produces an intrinsic value estimate that is transparent, replicable, and straightforward to communicate to a board or investment committee.'The ideal DDM candidate in 2026 exhibits the following characteristics:
- Long, consistent dividend payment history: Dividend Aristocrats (25+ consecutive years of dividend increases) and Dividend Kings (50+ years) are the DDM's natural targets. Companies with at least 5-10 years of unbroken dividend payment and growth provide a credible foundation for perpetual-growth assumptions.
- Stable, predictable earnings and cash flows: Regulated utilities, established consumer staples (food and drink, household products, personal care), large insurance companies, and established banks with stable credit cycles all exhibit the earnings predictability that makes dividend growth forecasting plausible.
- Dividend payout ratio is sustainable: The dividend payout ratio (dividends paid as a percentage of earnings) should be consistent and below 100% to ensure the dividend is not funded by borrowing or asset disposals. A sustainable payout ratio means dividends can grow in line with earnings over time without eroding the financial strength of the business.
- Dividend growth rate is plausibly sustainable at the assumed level: The assumed growth rate should be anchored in the company's historical dividend growth, its earnings growth trajectory, and the long-run growth of its addressable market. It should not exceed the long-run nominal GDP growth rate in perpetuity.
- Operates in a low-disruption sector: Industries at high risk of technological disruption — where future earnings and dividend sustainability are genuinely uncertain — are poor DDM candidates even if they currently pay dividends, because the constant-growth assumption will be violated by structural change.
Conclusion
The Dividend Discount Model is the theoretically purest method in equity valuation — it values a stock based solely on what shareholders actually receive from the company: dividends. The Gordon Growth Model, its most widely used variant, compresses an infinite stream of growing dividend payments into a single elegant formula: P₀ = D₁/(r−g). For Coca-Cola, with 62 consecutive years of dividend growth, the DDM produces an intrinsic value estimate that is transparent, grounded in observable history, and immediately interpretable by any investor.The model's constraints are as significant as its elegance. It assigns zero value to non-dividend payers — limiting its direct application to roughly half the stock market. It is acutely sensitive to the difference between the discount rate (r) and the growth rate (g): a single percentage-point change in either input can move the estimated fair value by 20% or more, and a Coca-Cola growth rate assumption of 5% versus 6% changes the DDM output by 35%. The perpetual constant-growth assumption is a mathematical convenience that becomes increasingly unrealistic the further into the future it extends. And companies can pay large dividends while misallocating capital, or suppress dividends while creating enormous value — both situations where the DDM is misleading as a guide to economic worth.
Used correctly — for mature, stable, dividend-growing companies with long payment histories, sustainable payout ratios, and predictable earnings; alongside FCFE/DCF as a cash flow sanity check; and alongside comparable company analysis for market-calibrated grounding — the DDM provides a valuable, transparent, and defensible intrinsic value estimate. The essential discipline is always to present DDM output as a sensitivity range across plausible combinations of r and g, never as a single authoritative point estimate. As Harvard Business School's Professor Srinivasan puts it: 'Valuation is inherently an estimate. Your results can be different from the estimates of others, and the estimate of value can change as the context and circumstances change.' The DDM's greatest practical value may be less the number it produces and more the discipline it imposes — forcing analysts to state explicitly what dividend growth they expect and what return they require, and then to reconcile the difference between what the model says and what the market prices.
Frequently Asked Questions (FAQ)
What is the dividend discount model in simple terms?
The Dividend Discount Model (DDM) is a method of estimating what a stock is worth today by calculating the present value of all the dividends it is expected to pay in the future. The idea is straightforward: if a company will pay you a dividend each year that grows over time, and you know how much return you require from the investment, you can calculate the maximum you should rationally pay for the stock today. A pound of dividends received in the future is worth less than a pound today because money today can be invested to earn a return — so future dividends are 'discounted' back to their present value. The sum of all those discounted future dividends is the stock's fair value according to the DDM.What is the Gordon Growth Model formula?
The Gordon Growth Model (also called the Constant Growth DDM) simplifies the DDM into a single formula for companies whose dividends grow at a constant rate: P₀ = D₁ / (r − g). Where P₀ is the intrinsic value of the stock today, D₁ is the expected dividend in the next 12 months (the most recent dividend multiplied by one plus the growth rate), r is the required rate of return or cost of equity (typically estimated using CAPM), and g is the constant perpetual dividend growth rate. The critical constraint is that g must always be less than r — if g equals or exceeds r, the formula produces an infinite or negative result that has no economic meaning. In practice, the perpetual growth rate g should not exceed the long-run nominal GDP growth rate of the economy (typically 3-5% for developed economies like the UK and US).What types of companies is the DDM best suited for?
The DDM works best for mature, stable companies with long, consistent dividend payment histories and predictable future earnings. The ideal DDM candidates are Dividend Aristocrats (S&P 500 companies with 25+ consecutive years of dividend increases) and Dividend Kings (50+ years), established consumer staples companies (Coca-Cola, Procter & Gamble, Unilever), regulated utilities with predictable revenues, large established banks with stable credit cycles, and telecoms companies with recurring subscription revenues and consistent dividend policies. In the UK context, FTSE 100 companies with long dividend histories in sectors such as energy (Shell, BP), consumer goods (Unilever, Diageo), utilities (National Grid, SSE), and banking (HSBC, Lloyds) are frequent DDM candidates. The model is least useful for technology companies that reinvest earnings rather than paying dividends, loss-making companies, companies that have recently cut or suspended dividends, and high-growth companies where the dividend payout ratio is very low relative to earnings potential.Why is the DDM so sensitive to small changes in inputs?
The DDM's extreme sensitivity to input assumptions is a direct mathematical consequence of the Gordon Growth Model formula. The fair value equals D₁ divided by (r minus g). The denominator — the difference between the required return and the growth rate — is typically a small number (for example, 9% minus 5% = 4%, or 0.04). When you divide by a small number, small changes to that number produce large changes in the result. If r minus g changes from 4% to 3% (because growth improved by 1%), the denominator drops from 0.04 to 0.03 — a 25% reduction — and the fair value increases by 33%. This mathematical amplification means that the growth rate assumption (g) and the discount rate assumption (r) are far more consequential than the dividend itself. A highly plausible range of g assumptions (say 4% to 6%) can produce fair values that differ by 50% or more. This is why sensitivity analysis — computing the fair value across a range of r and g combinations rather than a single set — is non-negotiable in any serious DDM analysis.What is the difference between a DDM and a DCF?
The Dividend Discount Model and the Discounted Cash Flow model share the same theoretical foundation — both discount future cash flows at a required return to estimate present value. The key difference is what they discount. The DDM discounts only dividends — the cash actually paid to shareholders. The DCF model discounts free cash flow to equity (FCFE) — all cash generated by the business that is available for shareholders, whether distributed as dividends or retained. This makes the DCF more broadly applicable: it can value any company that generates cash, regardless of whether it pays dividends. The DDM is a special case of the DCF where the company's reinvestment decisions are fully reflected in the dividend policy — an assumption that holds for mature, stable companies but fails for growth companies and for companies that pay dividends out of line with their cash generation. In professional practice, analysts typically use both methods for dividend-paying companies, with DDM as the dividend-focused lens and FCFE/DCF as the broader cash flow lens, cross-checking that the two produce broadly consistent results.
External References
1. CLFI — Dividend Discount Model (DDM) Formula and How It Works (April 7, 2026 — UK equity valuation guide with 20%+ sensitivity finding)https://clfi.co.uk/resources/dividend-discount-model-ddm-formula/
2. fffinstill — Dividend Discount Model (DDM): Investment Concept Explained (April 3, 2026 — Coca-Cola sensitivity analysis and 35% fair value swing)
https://fffinstill.com/learning/concepts/dividend-discount-model-ddm
3. Corporate Finance Institute — Dividend Discount Model: Definition, Formulas, Uses in Valuation (May 2026)
https://corporatefinanceinstitute.com/resources/valuation/dividend-discount-model/
4. The Motley Fool — Dividend Discount Model (DDM) Formula and How to Use It (October 2025)
https://www.fool.com/terms/d/dividend-discount-model/
5. FAST Graphs (Chuck Carnevale) — Discounted Dividend Method: Formula, Variations, Examples (January 7, 2026)
https://www.fastgraphs.com/blog/discounted-dividend-method-ddm-formula-variations-examples-and-how-to-use-it
6. Harvard Business School Online — Discounted Dividend Model (DDM) Formula and How to Use It (February 2025 — Prof. Suraj Srinivasan, Strategic Financial Analysis)
https://online.hbs.edu/blog/post/discounted-dividend-model
7. Wall Street Prep — Dividend Discount Model (DDM): Formula and Calculator (authoritative investment banking training resource)
https://www.wallstreetprep.com/knowledge/dividend-discount-model/
8. OpenStax — Dividend Discount Models (DDMs): Principles of Finance (2026 edition — multi-stage terminal value worked example)
https://openstax.org/books/principles-finance/pages/11-2-dividend-discount-models-ddms
0 Comments
Be the first to share your thoughts on this article.